

Lots of Home Runs at Atlanta?
This article was written by Robert H. Kingsley
This article was published in 1980 Baseball Research Journal
“Year after year, lots of home runs at Atlanta.” “Must be about the easiest home-run park.” We’ve all heard these comments. The stadium is a small reason; the big factor is the way they play the game. At Atlanta, they really go after the home run — emphasis, we call it. And they go all out when it’s hot and lay off when it’s cold. This article will prove it.
Granted, strong or weak pitching and home-run hitting affect total home runs at stadiums. Beyond these, the three big factors are physical dimensions of the stadium, weather or ball-carry factors, and emphasis. The first two are pretty well accepted, so let’s try to tie down this emphasis factor.
Busch Memorial Stadium in St. Louis is regarded as one of the more difficult home-run parks. But here’s how it stacks up with Atlanta for physical dimensions and ball carry (all numbers in feet unless otherwise marked):
Physical Dimensions
| Atlanta | St. Louis | ||
|---|---|---|---|
| Fence distance: foul lines | 330 | 330 | |
| Fence distance: power alleys | 385 | 386 | |
| Fence distance: center field | 402 | 414 | |
| Fence height | 6 | 10 1/2 | |
| Slope-HP to fence | 1 | 1 | |
| Foul ball area | 1% easier for HRs |
Weather Factors
| Atlanta | St. Louis | ||
|---|---|---|---|
| Elevation | 960 | 460 | |
| Temperature | 77.5º at airport | 76º | |
| Humidity | 65% at airport | 61% | |
| Winds (RHH) | same | same | |
| Winds (LHH) | 2% easier for hits |
The surprising thing is that these two stadiums aren’t far apart in most comparisons. The only real significant factors are the 500-foot higher altitude and the 41/2 foot lower fence at Atlanta. Throwing everything into the hopper, we came up with Atlanta being 15% easier for physical dimensions and 16% easier for ball-carry factors, or 33% easier overall. There’s no way it can be much more; the deeper St. Louis center field doesn’t matter much.
In the baseball world, an accepted way of comparing stadiums for home runs based on all factors is in terms of home runs hit at home and away. Below are four year home-and-away figures for the Braves and their opponents plus the same for the Cardinals.
| Braves | Opponents | ||||
|---|---|---|---|---|---|
| Home | Away | At ATL | Home vs. Braves | ||
| 1976 | 43 | 39 | 1976 | 56 | 30 |
| 1977 | 97 | 42 | 1977 | 111 | 38 |
| 1978 | 87 | 36 | 1978 | 89 | 43 |
| 1979 | 73 | 53 | 1979 | 80 | 52 |
| 300 | 170 | 336 | 183 | ||
| 300/170 = 1.76 | Avg. 1.80 | 336/183 = 1.84 | |||
| CARDINALS | OPPONENTS | ||||
| Home | Away | At STL | Home vs. Cards | ||
| 1976 | 27 | 36 | 1976 | 40 | 51 |
| 1977 | 41 | 55 | 1977 | 53 | 86 |
| 1978 | 29 | 50 | 1978 | 32 | 62 |
| 1979 | 48 | 52 | 1979 | 65 | 62 |
| 145 | 193 | 190 | 261 | ||
| 145/193 = 0.75 | Avg. 0.74 | 190/261 = 0.73 |
Adjusting these figures so they relate to the average National League stadium for 1976-79 (the two clubs play in different “away” stadiums), it turns out that 69% more home runs were hit at Atlanta, and 26% fewer at Busch Memorial. Now we can solve for the emphasis factor. The 33% comparison favoring Atlanta for physical dimensions and ball-carry factors breaks down to 14% above average for Atlanta and 14% below average for Busch Memorial. All we need to do for Atlanta, for example, is divide 1.69 by 1.14; this equals 1.48. The following are the results:
Atlanta Stadium Compared for Home Runs to 1976-79 National League Average Park
- All factors — 69% more home runs
- Dimensions and weather factors — 14% easier
- Emphasis (or attitude) factor — 48% positive emphasis
Busch Memorial Stadium Compared for Home Runs to 1976-79 N.L. Average Park
- All factors — 26% fewer home runs
- Dimensions and weather factors — 14% more difficult
- Emphasis (attitude) factor — 14% negative emphasis
Surely, these emphasis-factor percentages are larger than expected. Atlanta has had more home-run emphasis than any other major league team. At St. Louis, the Cardinals haven’t had much power in recent years. Consequently negative emphasis makes sense for their team in a relatively large stadium.
What does home-run emphasis really mean? It’s not easy to explain in a few words. Basically, it’s a matter of attitude, strategy, intent, priorities, etc. We’ve been describing positive emphasis as going for the long ball, thinking home run — all of which means more strikeouts and pop-ups, but more home runs, too. Negative emphasis is laying off the long ball, hitting to the opposite field, and trying to avoid striking out.
Why so much emphasis at Atlanta? A flock of reasons — “Some days the ball flies right out of here,” “If Henry could hit them out, so can I,” and a reputation as an easy home-run park. Most of the time visiting teams play the same kind of game as the home team. So visiting teams have been going for the home run the same as the Braves.
We went to spring training by way of Atlanta two years running. Could the fences be shorter than what the measurements say? “No way,” says Robert Johnson, grounds superintendent. “If you don’t believe it, you can measure them yourself.” Joe Shirley, Stadium Operations Director, said “the fences are right” and the Braves’ outlook is to go for the home run. At West Palm Beach, Paul Snyder, Minor League Administrator, said: “I think attitude is the biggest factor in home-run hitting.” It appears he couldn’t be more right.
Home-run emphasis with a specific mathematical meaning has been around awhile. We stumbled on it back in 1973 while using a bunch of mathematics to prove to the Cardinals that it wouldn’t help to shorten their center field fence. When we developed it more, Sports Illustrated introduced it in July 1973. We define it as home runs at home compared to the average of both home and away. (Away is adjusted to include one-eleventh of home-team home runs, which puts “away” on the same basis for all teams.) Since 1975, we’ve been producing and distributing home-run emphasis percentages for all major league teams. The effect of physical dimensions and ball-carry factors is removed from these emphasis figures.
To know more about the many Atlanta home runs, we tried last winter to find out if temperature and humidity had anything to do with it. Could high temperature be “triggering” the stress to hit home runs? Through the courtesy of the Elias Sports Bureau in New York and the Weather Bureau in Atlanta, we obtained home runs hit and the average temperature and humidity for each game in Atlanta in 1978.
Temperature affects home-run hitting in two ways. First is density of the air. Air expands at higher temperatures, becomes thinner or less dense, and offers less resistance to the flight of the ball. The other effect is the resiliency of the baseball. Balls that are warm, rather than cold, go farther as tests have proven. Air density effects are three to four times as great as resiliency effects in most circumstances.
Humidity also affects the resiliency of the baseball. Baseballs now are usually stored in air-conditioned areas, which keeps the cover fairly dry and the weight down. Once the ball is exposed to very moist air, the cover starts moving in the soggy direction, the ball takes on weight and it won’t go as far when hit. Ball-handling practices have a lot to do with humidity effects.
It’s a common misconception that humidity in the air slows down the ball. High humidity, short of fog, rain, etc., results in air only slightly less dense that dry air and causes practically no effect on the flight of the ball.
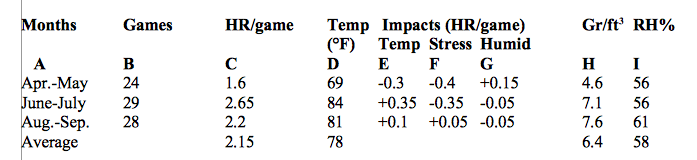
After many alternatives, the following table for Atlanta Stadium in 1978 gets close to the stress-temperature-humidity home-run question.
(Click image to enlarge.)
A few columns need explaining. In column I is the average relative humidity, and in column H is the absolute humidity in terms of grains per cubic foot. A grain is pretty small — 7,000 to the pound. Column C is important; the 2.65 for June-July is much higher and the 1.6 for April-May is much lower compared to the 2.15 home runs per game for the season average. The combined effect, or impact, of all the factors we are trying to tie down causes these numbers to vary from the 2.5 average.
In column E is the impact of the temperatures of column D in terms of home runs per game; similar for the humidities in Column G. At cursory glance, temperature makes quite a difference; humidity not much.
The column F numbers represent stress on home runs. We chose to use the term “stress,” a synonym of emphasis, because we don’t want to confuse the strict “home vs. away” meaning of home-run emphasis described earlier. Everything except temperature and humidity is lumped in the stress column. For example, note that for June-July the 2.65 value is 0.5 home runs above the 2.15 season average; temperature is 0.2 above and humidity is down 0.05, making a combined value of 0.15 above. Subtracting the 0.15 from the 0.5 is the 0.35 stress impact. The most significant thing in the table is that the temperature and stress values are pretty close to each other, have the same plus and minus signs, and actually correlate very well. Overall, the stress values can be seen as about 35% greater than the temperature values. Humidity values are small and very unlike the stress numbers.
In digging deeper, the same analysis was applied to the four cases of the warmest 25 percent of games played per month, likewise the coolest, driest and dampest groups. All of the groups, except the driest, came out very much like the all-season analysis but with the stress values more like 100%, rather than 35%, larger than the temperature values. For the driest group, the stress values looked more like the humidity values, surprisingly. A check revealed a cool but extremely dry spring could make the ball lighter than it is in air-conditioned areas.
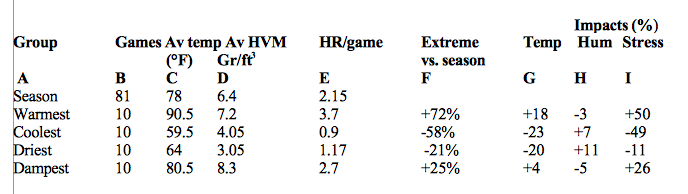
The simple table that follows is a little different twist in that season-long selective groups, rather than bi-monthly, are used for the various impacts.
(Click image to enlarge.)
In the table above the percentages in column F were determined by dividing the home runs per game by the season average of 2.5; again, the stress values are obtained by taking out the temperature and humidity impacts. Note that more than four times as many home runs per game were hit in the warmest groups vs. the coolest. The dampest games were pretty warm, too; the driest among the coolest. The same general relationship occurs between temperature and stress values. The warmest and coolest show the stress values to be about 150% larger than the temperature values, but overall the group shows about 100% increase. A larger number of games considered would yield more consistency within the groups.
Clearly, humidity has little to do with this exercise. When early calculations showed poor consistency, we called Atlanta to find out just how they were handling their baseballs. Very carefully, we learned; they store the balls in air-conditioned areas, rub the surface with clay in air-conditioned areas, keep the ball bag shut, throw out any ball that gets water on it — all things that practically close out the effects of high humidity. So we adjusted our humidity impacts accordingly.
What do the tables mean? In a nutshell, two things: First, the hitters are stressing home runs in Atlanta when the temperature is up and not stressing home runs when the temperature is down. Second, the home-run stress, compared to the impact of temperature, varies from about 35% larger for the average game up to 150% larger in the more extreme temperatures.
Does this make a lot of sense? Of course it does. When the temperature is way up, it’s just like moving the fence in maybe ten feet. Now the sluggers have it a lot easier and more not-so-long hitters get in the act. When it’s real cold, it’s like moving the fence back ten feet and, except for the big hitters, it’s time to get on the base paths some other way. So temperature and home-run stress keep very close company.
We think the stress factor is mostly pure intent, or the lack of it, to hit home runs. There could be other ingredients like how the hitters feel; name your own. Whatever stress includes, it doesn’t change the values; the big thing in this article is how stress values correlate with the temperature values.
Getting back to where we started, there’s a lot of home-run emphasis at Atlanta compared to other stadiums for a flock of good reasons. But it’s the “temperature trigger” that says when to turn on or off the stress on home runs. All this about Atlanta and home runs is “how they play the game.”