

Measuring Franchise Success in the Postseason
This article was written by Stuart Shapiro
This article was published in Fall 2015 Baseball Research Journal
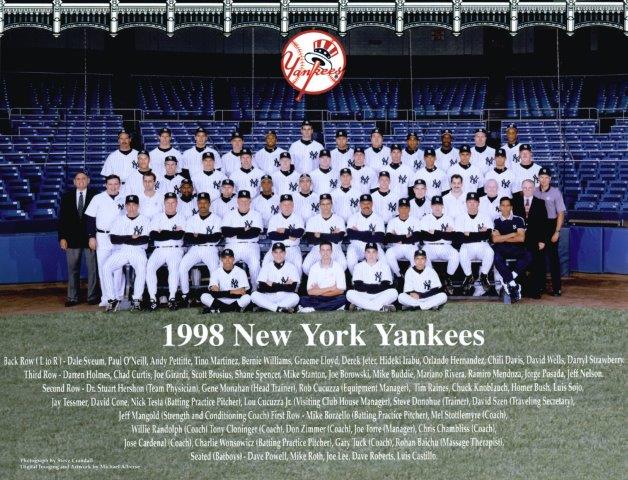
1998 New York Yankees (National Baseball Hall of Fame Library)
Baseball is unique in that its postseason has existed for over 110 years, enough time for teams to have many ups and many downs. This produces a vast trove of data with which to examine franchise success and failure. The history is deep enough that every team that has won a World Series can lay a claim to some period, however brief, when it was king of the hill in Major League Baseball. I will hereby examine the ebbs and flows of baseball and franchise success.
Methodology
I derived the method of analysis from one that Jason Kubatko used to compare basketball dynasties across eras.1 The basic idea is that the goal of a season is to win the World Series and doing so gives you a perfect score for the season of 100 points. All other point totals are derived from how close the team came to winning. The World Series loser gets 50 points because the highest level that they achieved was a 50 percent chance of winning the title. League Championship series losers receive 25 points for being one of the final four teams alive. LDS losers are assigned 12.5 points because they were among the final eight World Series contenders. Finally in 2012 and in 2013, the wild card game losers received 6.25 points because they had a 50 percent chance of reaching the round of eight.
The remainder of the teams are given a number of points equal to 100 divided by the number of major league teams active in that season. In other words, they get the number of points reflecting their probability at the beginning of the season of winning the World Series. With 30 teams currently in the Major Leagues, each non-playoff team get 3.33 points reflecting the 3.33 percent chance that each team had to win the World Series when the season opened. This number increases in earlier seasons when there were fewer teams in the major leagues. The nine cases when a one- or three-game playoff was used to determine playoff eligibility are a special situation. In these cases, teams that lost these playoffs received half the worth of the lowest postseason value described above that was available in the season of the playoff. The points are outlined in Table 1.
Table 1: Postseason point totals
| Accomplishment | Points Earned |
|---|---|
| World Series winner | 100 |
| World Series loser | 50 |
| League Championship Series Losers | 25 |
| League Division Series Losers | 12.5 |
| Wild Card game losers (2012-present) | 6.25 |
| Do Not Make Playoffs | 100 divided by number of teams in league |
This system uses postseason success (including making the playoffs) as the sole barometer of success. The 40-win 1962 Mets receive the same credit as the 103-win 1993 Giants who missed the playoffs by one game.2 One could simply use franchise wins as an alternative measure of success. As discussed below, this leads to very different rankings. Ideally, one may want to combine wins with postseason success in order to come up with a complete system but that is a subject for another article.
Postseason Success
I used the system described above to calculate total postseason success points for each of the thirty major league franchises through 2014. Not surprisingly, the New York Yankees dominate the field with nearly twice the number of points as the second place team. The St. Louis Cardinals hold second by more than 200 points (two World Series victories) over the third place team. The Dodgers, Giants, and A’s are in a tight race for third (with the Giants pulling ahead in 2014) followed by the Boston Red Sox. There is then a significant dropoff between 6th and 7th place. The totals for each of the sixteen franchises in existence at the time of the 1903 World Series are listed in Table 2. Surprisingly the least successful of these is not the much-maligned Chicago Cubs, but rather the Cleveland Indians.
Table 2: Total Postseason Points: Original 16 Franchises
| Franchise | Total Points | Points/Season | Wins | Wins/Season |
|---|---|---|---|---|
| New York Yankees | 3853 | 34.40 | 9913 | 88.51 |
| St. Louis Cardinals | 2121 | 18.94 | 9093 | 81.19 |
| San Francisco/New York Giants | 1974 | 17.63 | 9406 | 83.93 |
| Los Angeles/Brooklyn Dodgers | 1891 | 16.88 | 9121 | 81.44 |
| Oakland/Kansas City/ Philadelphia A’s |
1808 | 16.15 | 8465 | 75.58 |
| Boston Red Sox | 1723 | 15.39 | 8990 | 80.27 |
| Detroit Tigers | 1357 | 12.11 | 8885 | 79.93 |
| Miami/Florida Marlins | 264 | 11.99 | 1643 | 74.68 |
| Atlanta/Milwaukee/ Boston Braves |
1340 | 11.96 | 8475 | 75.67 |
| Arizona Diamondbacks | 202 | 11.91 | 1355 | 79.71 |
| Cincinnati Reds | 1311 | 11.71 | 8795 | 78.53 |
| Pittsburgh Pirates | 1288 | 11.50 | 8794 | 78.52 |
| Chicago Cubs | 1198 | 10.70 | 8770 | 78.30 |
| New York Mets | 550 | 10.37 | 4038 | 76.19 |
| Baltimore Orioles/ St. Louis Browns |
1152 | 10.29 | 8296 | 74.07 |
| Toronto Blue Jays | 389 | 10.22 | 2985 | 78.55 |
| Minnesota Twins/ Washington Senators |
1100 | 9.82 | 8375 | 74.78 |
| Philadelphia Phillies | 1092 | 9.75 | 8117 | 72.47 |
| Kansas City Royals | 439 | 9.55 | 3528 | 76.70 |
| Chicago White Sox | 1002 | 8.94 | 8771 | 78.31 |
| Cleveland Indians | 967 | 8.63 | 8893 | 79.40 |
| Los Angeles/Anaheim/ California Angels |
444 | 8.22 | 4318 | 79.96 |
| Tampa Bay Rays | 131 | 7.69 | 1272 | 74.82 |
| Houston Astros | 345 | 6.50 | 4120 | 77.74 |
| San Diego Padres | 289 | 6.28 | 3398 | 73.87 |
| Colorado Rockies | 136 | 6.17 | 1641 | 74.59 |
| Texas Rangers/ Washington Senators |
331 | 6.14 | 4094 | 75.81 |
| Seattle Mariners | 206 | 5.42 | 2822 | 74.26 |
| Milwaukee Brewers/ Seattle Pilots |
243 | 5.28 | 3501 | 76.11 |
| Washington Nationals/ Montreal Expos |
205 | 4.46 | 3527 | 76.67 |
Using total points makes it impossible to compare the oldest franchises with the expansion teams. By the time of the first expansion since the establishment of the World Series in 1961, the oldest teams had been accumulating postseason points for 58 seasons. That gave even the Indians enough of a head start to make it impossible for expansion teams to catch them in postseason points. However we can use a metric of postseason points per season in existence. For the original teams this would involve dividing their total points by 111, the number of seasons between 1903 and 2014 (excluding 1994 when there was no postseason).3 The results in Table 2 are in order of postseason points/season.
Even this is not a terribly fair comparison for the expansion teams, which are typically awful for a number of years after their creation.4 This will lower their per season averages compared to more established franchises. Still, despite this handicap, the Diamondbacks, Marlins, Mets, Blue Jays, and Royals did manage to achieve per-season postseason point totals that exceeded a number of the original sixteen. Eight of the expansion teams have never won the World Series and they lag even the Cleveland Indians (as do the Los Angeles Angels with one World Series win). At the extreme end of futility the Nationals (née the Montreal Expos) would need three straight World Series triumphs to catch even the Indians.
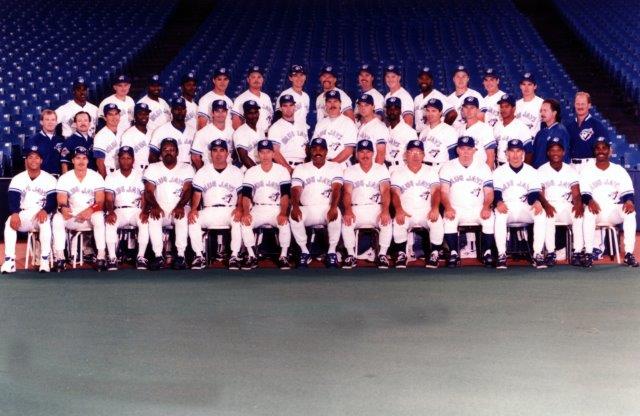
1993 Toronto Blue Jays. (National Baseball Hall of Fame Library)
Postseason Success Compared with Regular Season Success
Table 2 also contains the number of regular season wins and wins/season for each franchise. As one might expect, postseason points for each franchise have a much higher variance than wins. The comparison between wins and postseason points is interesting. Eliminating the Yankees who are outliers in both variables, wins per season range from 83.93 (the New York/San Francisco Giants) to 72.47 (the Phillies) with a standard deviation of 2.75.5 Postseason points/season range from 18.94 (the St. Louis Cardinals) to 4.46 (the Washington Nationals/Montreal Expos) with a standard deviation of 3.83. The standard deviation divided by the mean is nearly ten times as large for postseason points as it is for wins.
Comparing postseason points/season with wins/season allows us to see which teams have been postseason disappointments and which ones have particularly capitalized on their comparatively few opportunities in October.
Lucky Teams That Have Gotten the Most Bang for the Buck in the Postseason
- The Athletics: The Athletics, on their journey from Philadelphia to Kansas City to Oakland, have given baseball fans some of the most memorable teams in baseball history. Before the current Moneyball era, when the A’s were good, they won championships. They had dynasties in the early 1910s, the late 1920s, and the 1970s.6 When they were bad they were awful, losing games in bunches. All this adds up to a team with a lot of postseason points despite a poor overall winning percentage.
- The Marlins: The Marlins rank eighth in postseason points/season, best for any expansion team and better than a majority of original teams. The origin of this is simple; they have been in existence for 21 years and have won the World Series twice. Of course they also dismantled these World Series winning teams more quickly than they built them, leading to a losing overall record despite their postseason success.
Unlucky Teams With Success Through September But Heartbreak in October
- The Indians: They rank eighth in wins/season but are the worst original franchise in postseason points/season. That’s what happens when you make the World Series five times in 111 seasons and win it only twice. That’s also what happens when your greatest success comes at a time when baseball’s dominant franchise is winning AL pennant after AL pennant in the 1950s. Finally, that’s what happens when you win 111 games in a season and then lose in the World Series as the Indians did in 1954.
- The Angels: The Los Angeles Angels have made the playoffs frequently in the expansion era. But the 2014 season was an all too typical outcome for them. They led the American League in wins and then proceeded to lose in the first round of the playoffs to the Royals. Again and again (except in 2002), the Angels have followed wonderful regular seasons with disappointment in October.
Dominating a Time Period
This tool can also be used to provide an answer for questions of which team achieved the most over a given period of time. As each decade concludes, debate often takes place over which team deserves the title, “Team of the Decade.” Table 3 shows the Team of the Decade using this system in each of the eleven completed decades for both the American and National Leagues since 1903. The team with the most postseason points in the majors is highlighted in bold text.
Table 3: Teams of the Decade
(Overall winner in bold)
| Decade | AL | NL |
|---|---|---|
| 2000s | Yankees | Cardinals |
| 1990s | Yankees | Braves |
| 1980s | A’s/Royals | Dodgers |
| 1970s | A’s | Reds |
| 1960s | Yankees | Dodgers |
| 1950s | Yankees | Dodgers |
| 1940s | Yankees | Cardinals |
| 1930s | Yankees | Cardinals |
| 1920s | Yankees | Giants |
| 1910s | Red Sox | Giants |
| 1900s | Tigers | Cubs |
Again the Yankees dominate these titles garnering the most postseason points in the major leagues in six of the eleven decades and winning the American League (but surprisingly not the major leagues) in the 1990s. Other franchises to “win” a decade include the Atlanta Braves in the 1990s, the Los Angeles Dodgers in the 1980s, the Oakland A’s in the 1970s, the Boston Red Sox in the 1910’s and the Chicago Cubs in the 1900s. The Cubs obviously followed their decade win with a bit of an off century.
But ten-year periods don’t all start in years ending in zero. Since 1903, there have been 103 decades in baseball history (1903–12, 1904–13, 1905–14, etc.). Again the Yankees, dominate the list of decades won but a broader array of franchises can claim to have been the most accomplished postseason performers for at least one decade. Table 4 lists the teams that have led the major leagues for at least one decade in postseason points and the number of decades of glory for these teams.
Table 4: Decades “Won”
| Team | Decades |
|---|---|
| Yankees | 58 |
| A’s | 13 |
| Cardinals | 6 |
| Red Sox | 6 |
| Dodgers | 4 |
| Braves | 4 |
| Orioles | 4 |
| Giants | 3 |
| Blue Jays | 2 |
| Twins | 2 |
| Cubs | 1 |
Ten of the original sixteen franchises have won a decade, as has one expansion team (the Toronto Blue Jays which won the decades beginning in 1984 and 1985). Not to pick on the Chicago Cubs, but they won the first complete decade of twentieth-century World Series history (1903–12) with two World Series titles and two other National League pennants and then never won another one. Still one win is more than six of the other original franchises.
What if we shorten the admittedly arbitrary time period from ten years? What if we lengthen it? Has each franchise had its time period in the sun? A time period when it can say, “We were the best?” As a final exercise, I looked at each team and found the longest period over which it had more postseason points than any other team in the majors. Teams that never won the World Series (Expos/Nats, Mariners, Rangers/Senators, Astros, Rays, Brewers, Rockies, and Padres) have no such period. Here are the longest times when every other team could claim it was the best in the sport:
- Arizona Diamondbacks: 2001–03. With a World Series win in 2001 and a playoff appearance in 2002 the Diamond-backs were the best for this brief three year run. The other two World Series winners in this period did not make the playoffs either of the other two years.
- Atlanta/Milwaukee/Boston Braves: 1982–99. It should surprise no one that the Braves’ best era was quite recent, as their three pitching aces and manager from this period have been recently inducted into the Hall of Fame.
- Baltimore Orioles/St. Louis Browns: 1965–80. This represents the peak of the Earl Weaver “Orioles Way” era and includes two World Series titles, three additional pennants, and two more division titles.
- Boston Red Sox: 1903–22. As great as the Red Sox have been recently, their longest period of dominance was the first 19 years of World Series play. With five titles in a 19-year span, they were one of the first MLB powerhouses.
- Chicago Cubs: 1903–12. But if we truncate the beginning of baseball history a bit, the Cubs get to claim the mantle of greatest team. Winning the World Series in 1907 and 1908 and pennants in 1906 and 1910 is enough to give them the title for baseball’s first decade.
- Chicago White Sox: 1917–20. Yes, the White Sox’s greatest era contains the Black Sox team of 1919. This is the only time the White Sox have appeared in more than one World Series in less than forty years.
- Cincinnati Reds: 1973–77. It is a short period but a dominant one. With a division title in 1973 followed by World Series wins in 1975 and 1976, the Big Red Machine won’t be soon forgotten.
- Cleveland Indians: 1920, 1948. Ah the Indians. They are one of only two original franchises that does not have a multi-year period in which it can claim supremacy. They have to settle for their two World Series winning years.
- Detroit Tigers: 1932–35. The Tigers have had a number of great teams but few that were grouped together. Their best team includes the World Series winners of 1935 and pennant winners of 1934.
- Kansas City Royals: 1979–85. The Royals of George Brett were a constant postseason presence in this era winning three divisions (and a half division in the 1981 split season), two pennants, and the 1985 World Series.
- Los Angeles/Anaheim/California Angels: 2002. Like the Indians, the Los Angeles Angels have no multi-year period in which they were dominant.
- Los Angeles/Brooklyn Dodgers: 1962–97. This is the second-longest dominant period of any franchise. It carries through the Koufax era, the great Dodger teams of the 1970s, and the Orel Hershiser/Kirk Gibson team of 1988. Surprisingly it does not include the great Brooklyn teams of the 1950s because they only won the one World Series in 1955 and this era was dominated by the Yankees.
- Miami/Florida Marlins: 1997, 2003. See the discussion above for the reason the Marlins have no multi year periods in which they were the best team.
- Minnesota Twins/Washington Senators: 1982–92. The Twins are the only team to win two World Series in this period which is enough to give them the title for this eleven-year era.
- New York Mets: 1986–88. Ah, what could have been? A team that many forecast to dominate for years had a brief but well documented three-year run at the top of the heap.
- New York Yankees: 1903–2014. Some team has to be the best of all time, and it isn’t close. For this to change, the Cardinals would have to win 18 World Series in a row while the Yankees never make the playoffs. Mystique and aura can rest easy.
- Oakland/Kansas City/Philadelphia Athletics: 1965–98. The great A’s teams of the 1970s coupled with the Bash Brothers of the 1980s, give the A’s the win over a period largely overlapping with and almost as long as the Dodgers. Interestingly the A’s also have a 29-year period of postseason success from 1904–32 spanning Connie Mack’s two great teams.
- Philadelphia Phillies: 2007–11. One of the oldest franchises has recently had its peak. With its five consecutive division titles and 2008 World Series win, it’s been the best time in history to be a Phillies fan.
- Pittsburgh Pirates: 1909, 1925, 1960, 1971, 1979. The oddest result of all the teams in my view. The Pirates have won five World Series but have never had the most postseason points for any period longer than one year (they do tie with the Yankees from 1925–27 and the A’s from 1971–72).
- San Francisco/New York Giants: 1903–37. This is the fourth franchise whose dominant period starts at the beginning of the World Series era. Their stretch goes on significantly longer than those of the Red Sox or Cubs and largely spans John McGraw’s career. For all periods from 1903 to years later than 1937, the Yankees have the most postseason points.
- St. Louis Cardinals: 2000–14. For a team with such a storied history, I was surprised to see we are currently in their best stretch. But over the past 15 seasons, the Cardinals have won two World Series and been in the postseason a remarkable 11 out of 15 years.
- Toronto Blue Jays: 1979–95. The Blue Jays have been away from the postseason longer than any other team. However they also have the longest stretch of superiority of any expansion team. It is easy to forget how they regularly contended for and won AL East titles in the 1980s before breaking through as World Series champions in 1992 and 1993.
STUART SHAPIRO is an Associate Professor and Director of the Public Policy program at the Bloustein School for Planning and Policy at Rutgers University. He received his Ph.D. from the Kennedy School of Government in 1999. He studies and writes about the interaction between politics and regulatory policy-making. A lifelong Yankees fan, he has written two articles for the “Baseball Research Journal” in 1999 and 2001.
Notes
1. Kubatko’s method is described by Neil Paine on ESPN.com: http://insider.espn.go.com/nba/story/_/id/8831674/nba-which-team-lakers-spurs-heat-had-most-playoff-success-2005. ↵
2. Actually the Mets get more credit, there were only 20 major league teams in 1962 but there were 28 in 1993. ↵
3. I did give the New York Giants and Boston Red Sox 50 points each for winning their respective league pennants in 1904. There was no World Series played that year. ↵
4. The expansion era has provided more opportunities for postseason points with expanded playoffs. However, these points are dwarfed by the 100 points for a World Series victory and 50 points for a World Series loss leaving the expansion teams at a disadvantage. ↵
5. The standard deviation is a statistical measure of the variation in a set of data. It is calculated using the average difference between data and the mean of the data set. ↵
6. Rob Neyer and Eddie Epstein, Baseball Dynasties, New York: W.W. Norton & Co, 2000. ↵