Measuring the Greats on Prime Performance
This article was written by Terrence L. Huge
This article was published in 1986 Baseball Research Journal
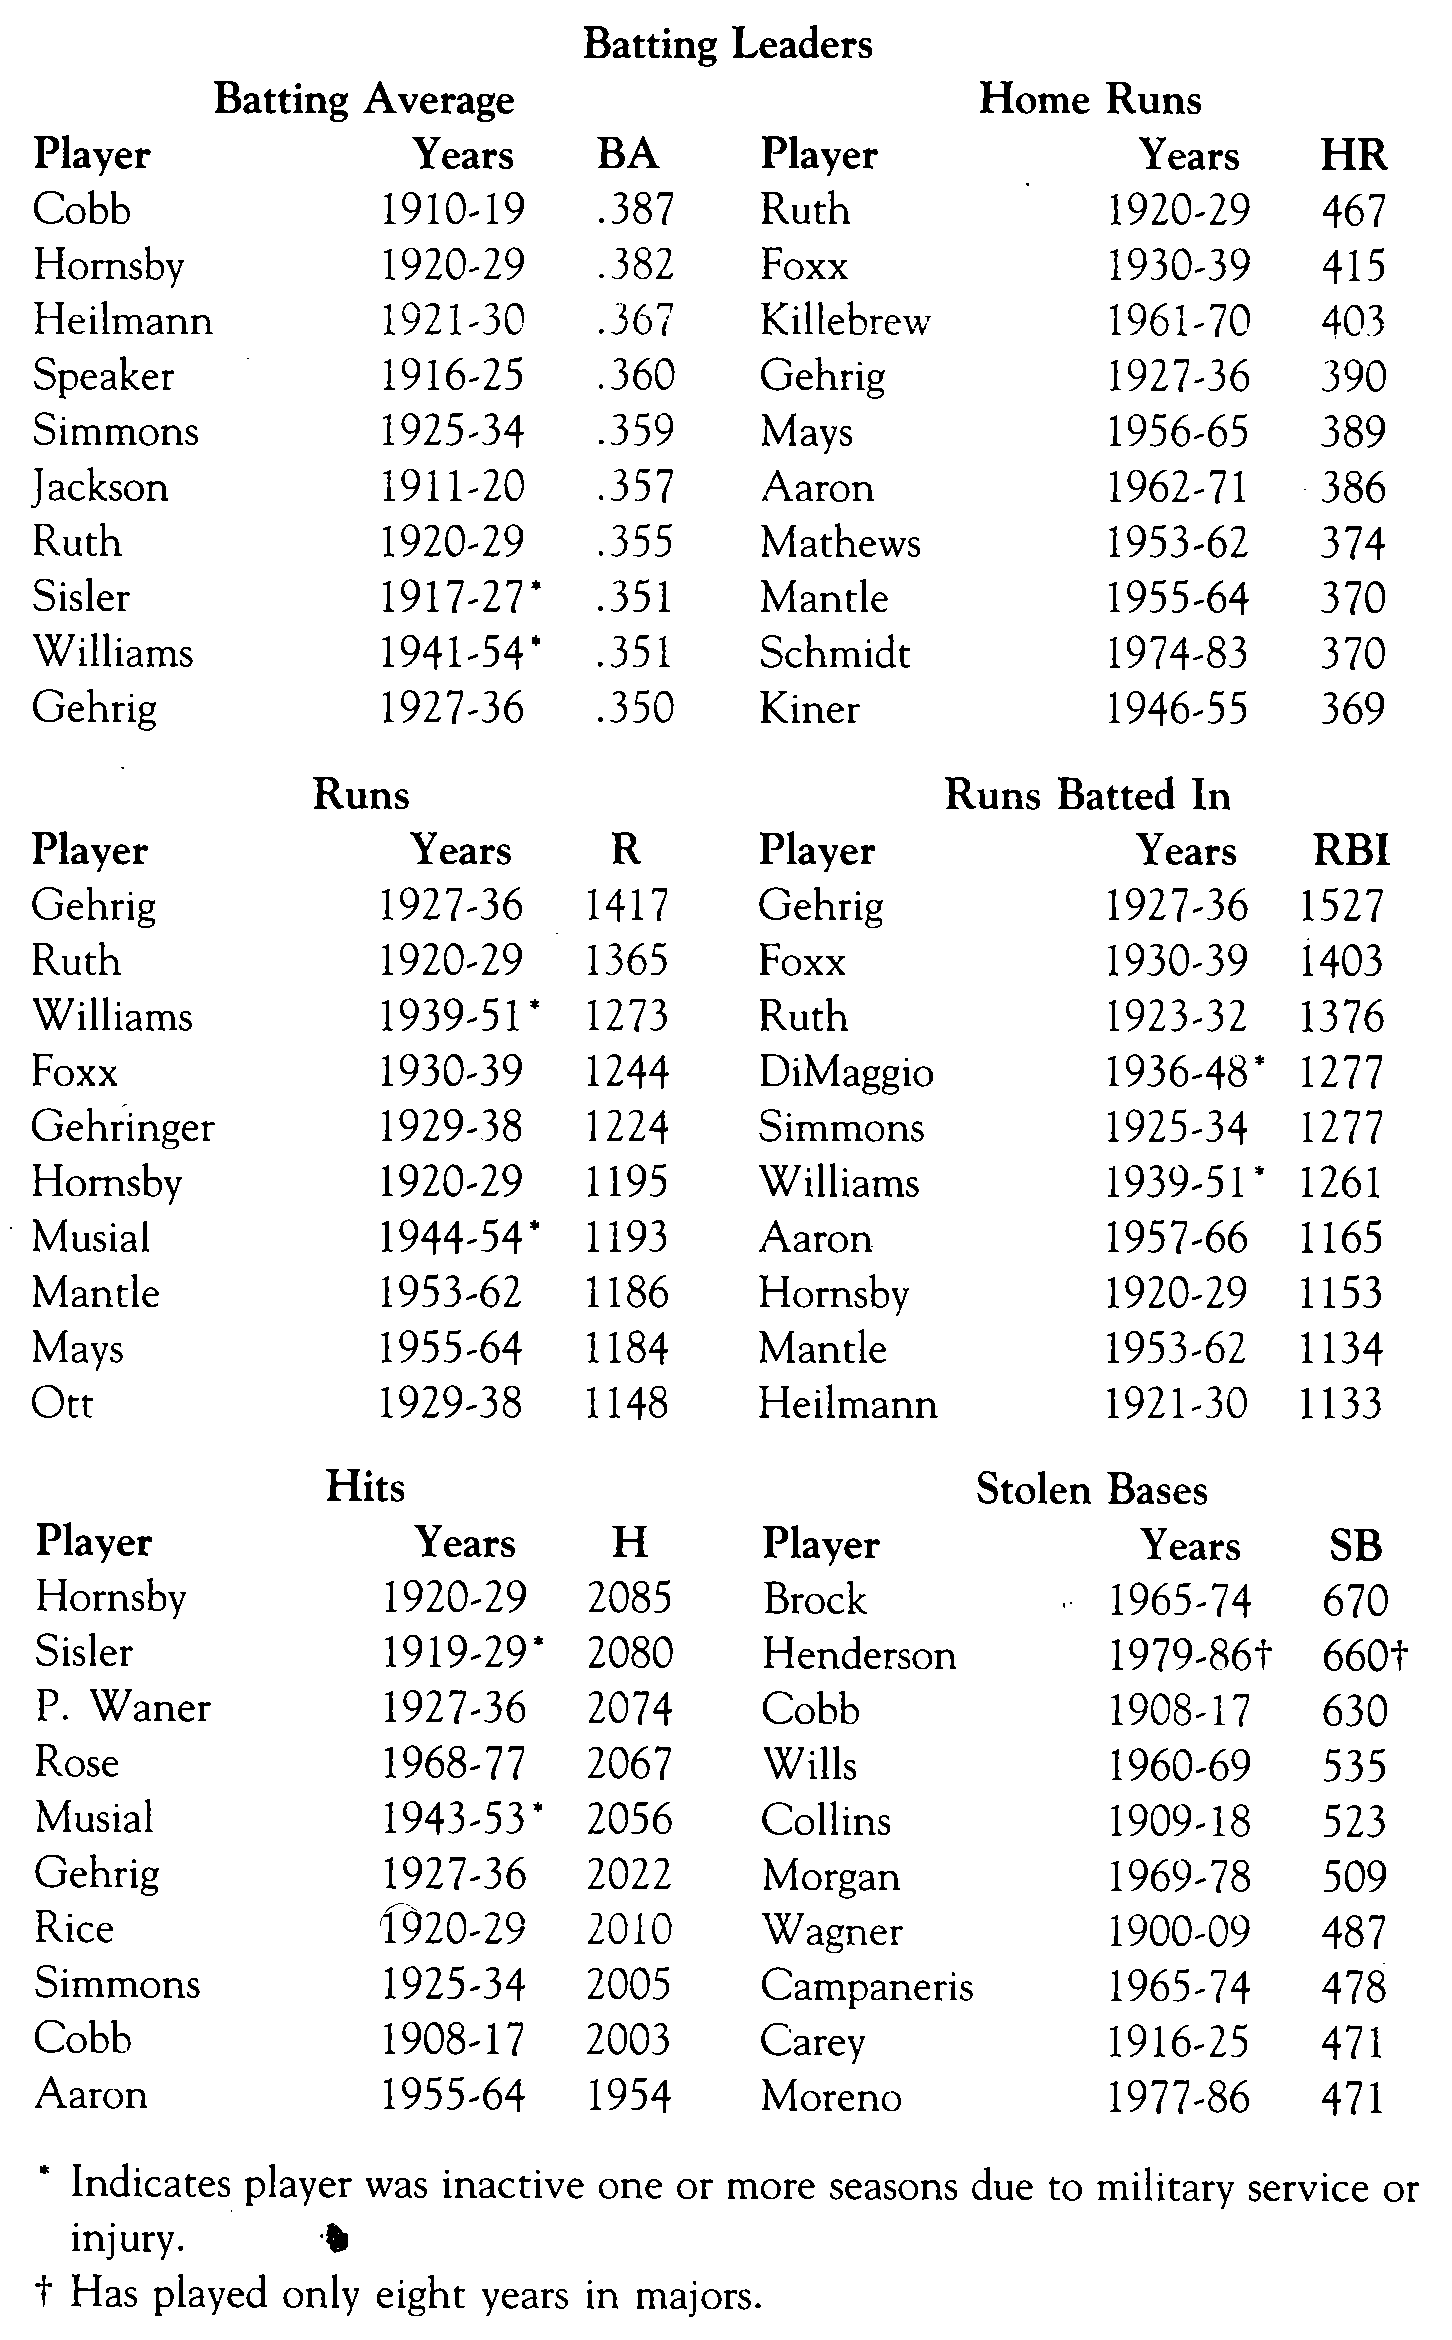
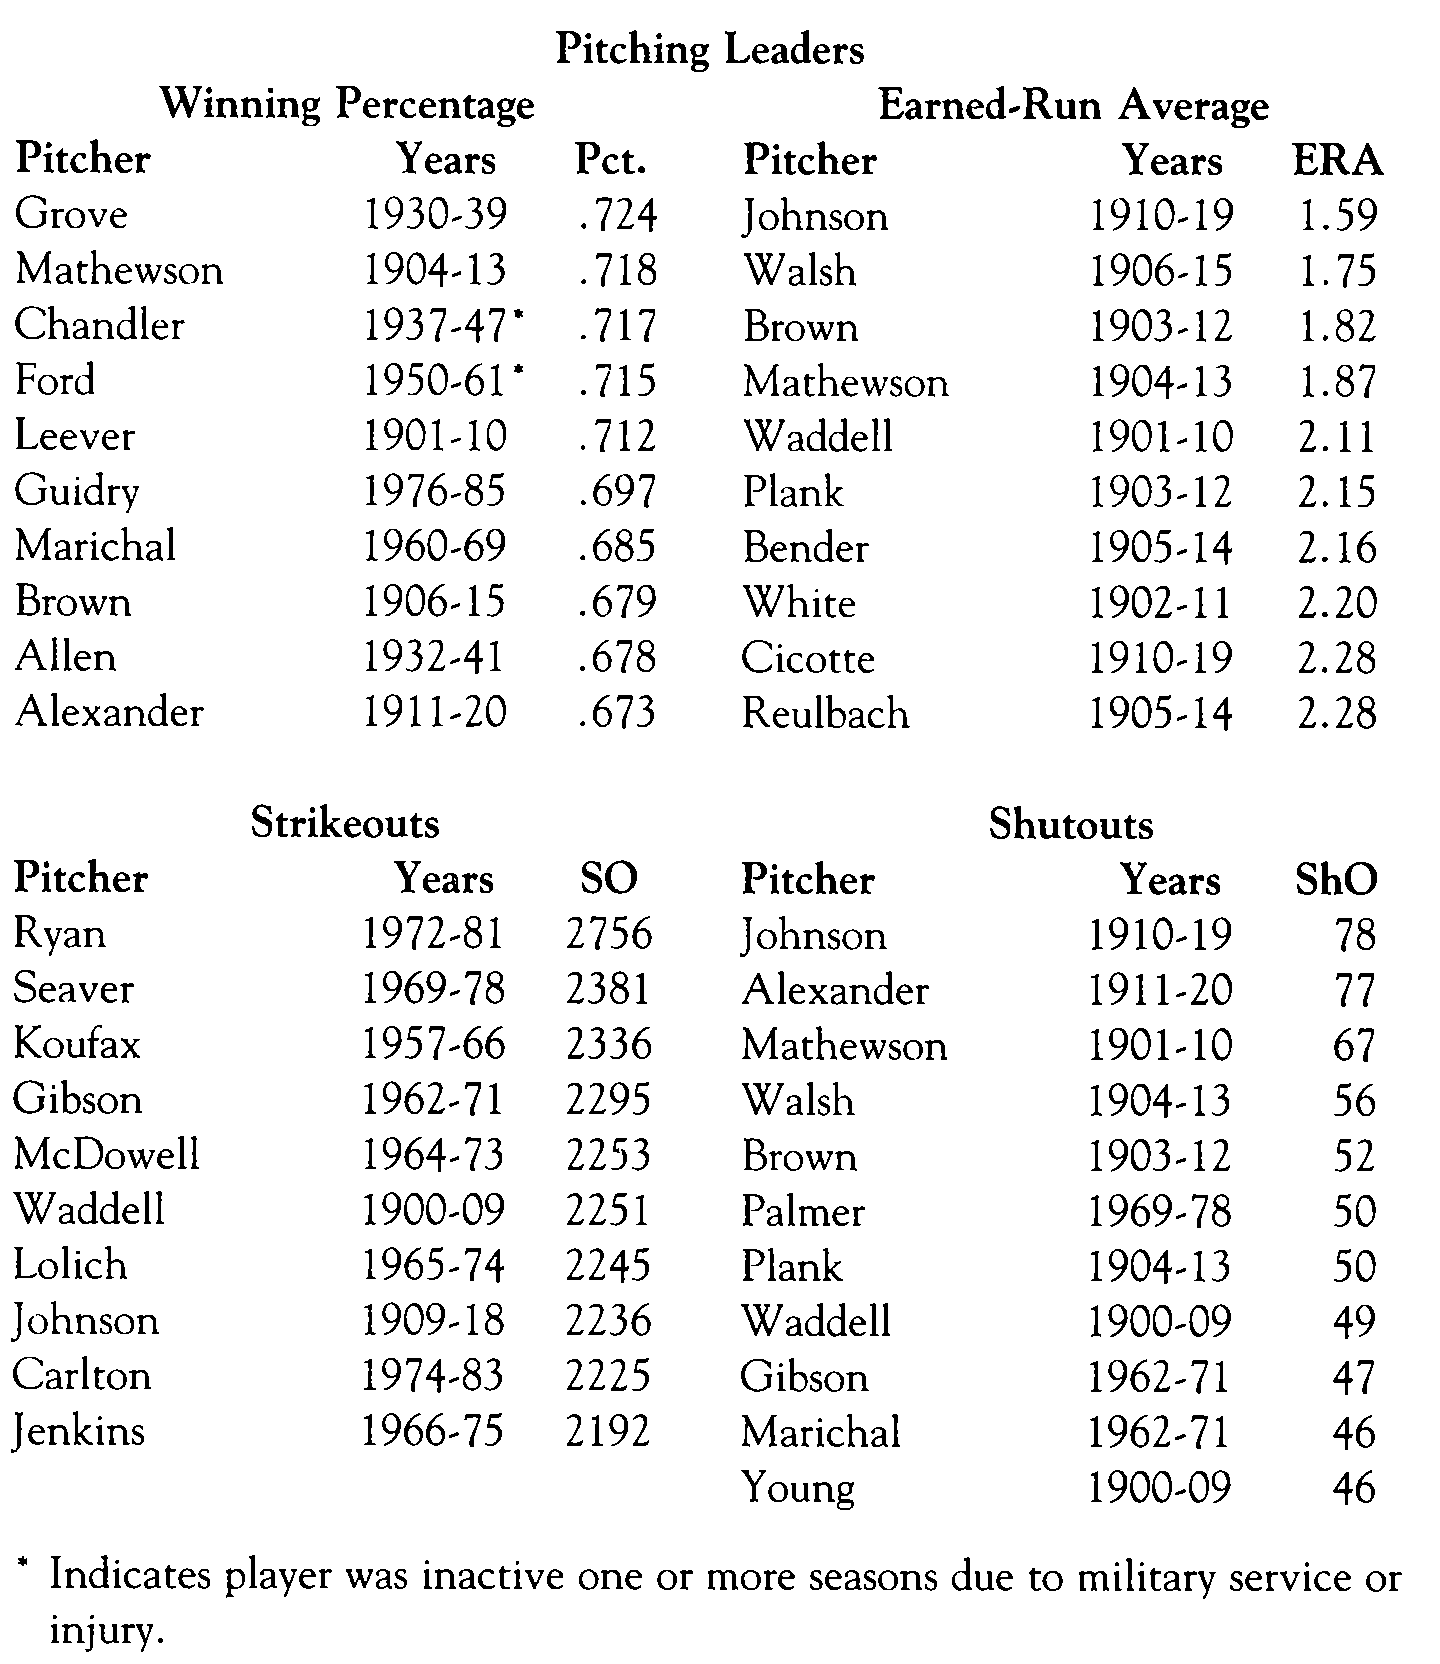
Based on a ten-year span, Cobb batted .387, Ruth averaged 46 home runs and Gehrig had 152 RBIs per season, while Johnson boasted a 1.59 ERA and Grove notched a .724 winning percentage.
A game, a season and a career are baseball’s traditional statistical time slices. For purposeful, analytical and definitive studies, all three of these perspectives are often inadequate and misleading.
A game as a time frame obviously is hardly valid for serious comparisons. A season as a unit provides a larger sample, but there have been many instances of meteoric but totally atypical single-season performances. Mark Fidrych stands out as a good example. He compiled a 19-9 record and a league-leading 2.34 ERA in his rookie year (1976) and then quickly faded. Generally speaking, a player’s career statistics represent a more optimal capsule, yet even career totals can be deceiving for several reasons, including: 1) A few of the greats voted into the Hall of Fame played only ten to 12 years in the majors (Addie Joss, in fact, pitched just nine seasons) whereas others played as many as 20 to 25 years, and 2) some players fared dismally in their early seasons before going on to greatness.
It would therefore seem to follow, that a time-span standard greater than one season, yet not necessarily embracing an entire career, would serve as a superior statistical perspective. The ten seasons of major league experience required for Hall of Fame eligibility could be regarded as an equitable compromise, and almost certainly all would agree that a stretch of ten consecutive seasons could be considered a player’s “prime.”
Using a ten-year period of a player’s career also is convenient from a statistical viewpoint. For instance, the greatest base-hit collector in baseball history, Pete Rose, enjoyed his most productive ten-year span from 1968 through 1977 with 2,067 hits, which rounds off to 207 per season.
Who are the all-time leaders when only the ten-year “primes” are considered? As one might expect, the legendary Ty Cobb, Babe Ruth, Lou Gehrig and Rogers Hornsby dominate batting honors. Cobb averaged an unbelievable .387 at the plate over a ten-year stretch (1910-1919), while Ruth enjoyed a ten-season pace of slightly better than 46 home runs. Gehrig averaged a bit over 152 RBIs and 141 runs scored per season, and Hornsby had a ten-year pace of 208½ hits.
With the exception of Ten Williams, the ten leaders in batting average are all pre-World War II performers. The only current player with a chance of adding his name to the list is another Red Sox star, Wade Boggs, who owns a robust .352 average for his first five seasons.
Several current-day players are included in the Top Ten batting tables. Rose ranks fourth in hits over a ten-year period, and Mike Schmidt is ninth on the home-run list. Even though 1986 was only Rickey Henderson’s eighth season in the majors, he already had stolen enough bases (660) to gain second place and trail leader Lou Brock by only ten.
The tables devoted to “prime” pitching accomplishments, which are limited to twentieth-century hurlers with at least 100 victories in each prime span, exhibit a notable blend of vintage and recent stars, at least in winning percentage, strikeouts and shutouts.
With the Yankees being the winningest team in this century, it is not surprising that three of the top ten pitchers in “prime” winning percentage wore the New York pinstripes – Spud Chandler, Whitey Ford and Ron Guidry. However, even they had to take a back seat to the respective .724 and .718 winning percentages posted by Lefty Grove and Christy Mathewson.
Nolan Ryan truly dominates in strikeouts, averaging nearly 276 per season in his prime. His nearest rival, Tom Seaver, has a 238-whiff average, while Steve Carlton, No. 2 in career strikeouts behind Ryan, has to settle for ninth on the prime-time list.
In shutouts the two leaders, Walter Johnson and Grover Alexander, are separated by only one (78 to 77) over their best ten-year spans. Jim Palmer is the highest-ranking among recent pitchers and stands tied for sixth on the list with 50.
Pitchers from the pre-1920 “dead ball” era occupy all ten places in earned-run average. Walter Johnson easily tops the list with 1.59 as compared to 1.75 for runner-up Ed Walsh.
Interestingly, the ten-year “prime” of a player’s career, based on the ages of the players shown in the accompanying tables, appears to be from age 24 through 33, give or take a year or two. The midpoint of the player’s prime is approximately age 28 or 29. This, of course, can be a useful fact to both players and management at salary-negotiating time.
Terrence L. Huge has computer programs (written in BASIC) which quickly and accurately scan a player’s career to determine the prime performance in various statistical categories. These may be obtained by SABR members at no charge by writing Huge at: Cincinnati Technical College, 3520 Central Parkway, Cincinnati, OH 45223.
(Click images to enlarge)


