

Offensive Strategy and Efficiency in the United States and Dominican Republic
This article was written by Steven M. Day - Robert J. Reynolds
This article was published in Summer 2009 Baseball Research Journal
According to a well-known baseball saying in the Dominican Republic, “You don’t walk off the island.”1 It means that, for a ballplayer looking to advance to Major League Baseball, it is better to try to hit the ball than draw a walk, even at the possible expense of making an out. This may explain a common perception among baseball fans in the United States that players from the Dominican Republic are “hackers” who make too many outs and contribute little offensively.
Yet players from the Dominican Republic are highly prized in MLB. In the 2008 season, only the United States fielded more MLB players. Players born in the Dominican Republic represented almost 10 percent of the total. Dominicans are excluded from the amateur draft, and, while that offers MLB clubs a financial incentive that may contribute to the high rate at which Dominicans are recruited into MLB, that they are signed at all is an indication of their skill compared to that of the U.S. alternatives. If the performance of Dominican players were seriously sub-standard, it would make no sense to recruit them at all, no matter how inexpensive they were.
Is it true that ballplayers from the Dominican Republic have a different strategy at the plate from that of players born in the United States? If so, to what extent does this impact their offensive effectiveness? If these players employ ineffective strategies at the plate, why do major-league clubs recruit so heavily from the Dominican Republic?
We address these questions in a comparison of batting statistics for MLB players from the Dominican Republic and the United States. If Dominican players are systematically employing a different approach at the plate in comparison to U.S. players, the trend should be easy to demonstrate.
To quantify and describe the offensive strategy of the two groups, we examined the proportions of these plate-appearance events: walks (BB), sacrifice flies (SF), hit by pitch (HBP), and at-bats (AB). (We do not include sacrifice hits and catcher interference, as they are not included as a divisor when calculating OBP.) By measuring the rates among these events, we can infer the possibility of a systematic difference between the respective plate strategies employed by hitters from the two countries.
To characterize the efficiency of the respective plate strategies, we use on-base percentage (OBP) and introduce the statistic plate-appearance base average (PABA) as a plate-appearance analog to slugging percentage (SLG). PABA is calculated as the sum of the bases achieved in three categories—hitting (TB), BB, and HBP—divided by the total number of plate appearances: (TB + BB + HBP) / TPA. Just as OBP provides the success rate of getting on base per PA, PABA provides an average number of bases achieved by the batter per PA.
PABA is similar to bases per plate appearance and runs created (RC), though these latter include stolen bases, and advancing other players through sacrifices. Because of these additions, bases per plate appearance and RC do not provide an isolated measure of a player’s efficiency at the plate. As the objective of the current work is to examine proximal hitting outcomes, PABA is the measure of choice among these three.
Using these measures collectively allows us to answer three important questions that are at the heart of offensive strategy:
- With what frequency do the players attempt to hit and with what frequency do they walk?
- With what frequency are they successful in those hitting attempts?
- On average, how many bases do these players earn through their efforts at the plate?
METHODS
Hypotheses
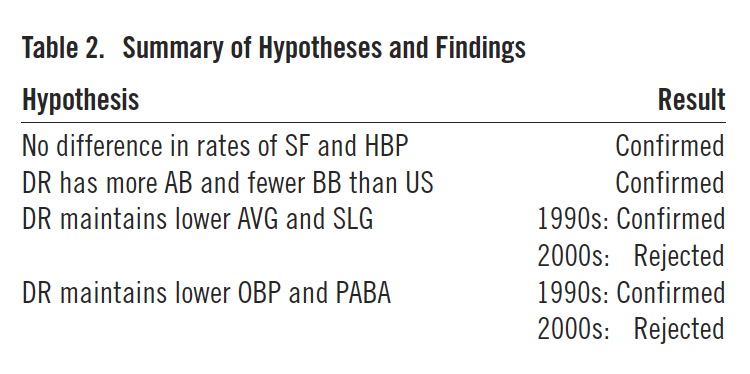
The general hypothesis of this study was that players from the Dominican Republic are more aggressive at the plate, and consequently less efficient, than players from the United States. Specifically we hypothesized that, in comparison to U.S. players, Dominican players display no differences in the rates of SF and HBP; spend more PA opportunities on AB and fewer on BB; maintain a lower AVG and SLG; and maintain a lower OBP and PABA.
Data
The data for the study were taken from the 2007 version of the Lahman Database. This database has complete seasonal player statistics through the 2006 season along with demographic information—the most important being, for our purposes, country of birth. More information about this database can be found on the website of the Baseball Archive (www.baseball1.com).2
Batting statistics were compiled for every player in MLB who played in the majors in any of the seasons from 1990 through 2006, had at least one plate appearance, and was identifiable as being born in either the Dominican Republic or the United States.
It is common practice in sabermetric research to exclude individual player-seasons that fail to reach a minimum threshold of playing time, usually measured in PA. This is to ensure that an individual player has had enough chances at the plate to reduce the variability surrounding his performance and to enable him to show his “true” ability. Since the analysis in the current work is not concerned with batting statistics for individuals, we have not chosen to impose such restrictions here. As the unit of analysis is the individual plate appearance, each plate appearance can be considered an independent trial; that is, the outcome of any single plate appearance is not dependent on the plate appearances that precede it. This means that the significance of plate appearances that come from players who total only 20 PA is no less valid than the significance of the first 20 PA from players who total 500 or more. This is the same approach used when calculating league-total or team-total batting statistics: Add up all the statistics for all players who made a plate appearance and calculate averages as usual.
After assembling the player-seasons, we pooled the data into groups by national origin, one for the United States and one for the Dominican Republic. The United States was chosen as the comparison group because, as baseball’s birthplace, it offers a sensible benchmark against which to compare the style of play of other nations. The large number of players from the United States also affords statistical estimates that are more precise.
Because most pitchers are notoriously poor hitters, all of the player-seasons from pitchers were excluded from the analyses.
Statistical analyses
To calculate the frequency of plate-appearance events, we divided the number of events by the total number of PA. In this way the various measures may be considered standardized rates of offensive events, allowing for direct comparisons between groups.
AVG, SLG, and OBP were calculated according to standard methods. As mentioned in the introduction, PABA was calculated as (TB + BB + HBP) / TPA.
Difference scores between groups were then calculated for all PA-event rates and offensive statistics, by subtracting the scores of the Dominican players from those of the U.S. players.
To ensure that the differences were not due to chance alone, statistical significance was tested at the 0.05 level using z-scores from the normal approximation to the binomial distribution.3 In this context statistical significance indicates that the differences— however small—are likely systematic and not the result of random variation in the data.
It should be remembered that the 1994 season was prematurely ended by a players’ strike, in August, resulting in the loss of approximately 25 percent of the regular-season games. For this reason, the statistics from 1994 are highly suspect. The 1995 season started late, resulting in a season of 144 games, about 1 percent fewer than the 162 games that is the norm in the period we study. Statistics for both seasons have been retained for the sake of continuity, but we stress that inferences should not be drawn on the basis of either season alone, and especially not on the 1994 season alone.
RESULTS
Sample characteristics
The sample contained 2,404,312 plate appearances from 8,569 player-seasons contributed by 1,706 unique players between 1990 and 2006.
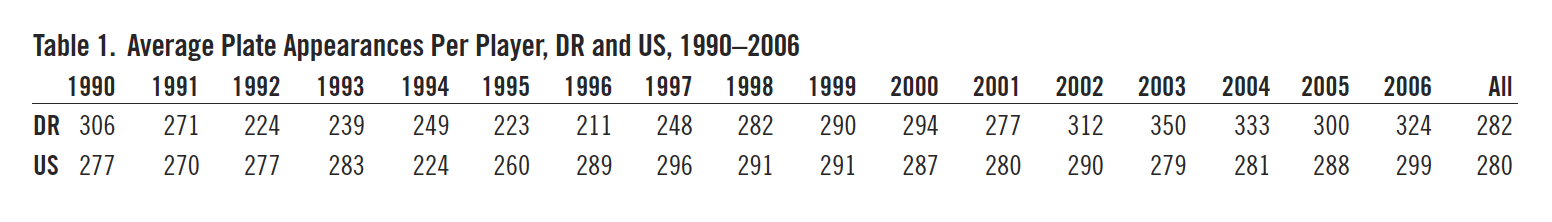
The data indicate that the amount of average playing time Dominicans receive (as measured by PA per player) has varied over time but has increased in the last few seasons. In general the average PA per player was higher for the United States in the 1990s, but since 2000 the Dominican Republic has seen more average playing time per player. Table 1 below summarizes this trend.
Table 1. Average Plate Appearances Per Player, DR and US, 1990–2006
Strategy at the plate
Figure 1 shows the difference, between U.S. and Dominican players, in the accrual rate of the four components of plate appearances (BB, SF, HBP, AB), and figure 2 shows the difference in batting statistics (OBP, SLG, AVG). Lines in the top half of the graphs represent differences in favor of players from the United States—U.S. players scored higher than Dominican players. Likewise, lines below the zero line (in the lower half of the graphs) represent the Dominican players outperforming the U.S. players.
Figure 1. Difference in PA Events, US and DR, 1990–2006
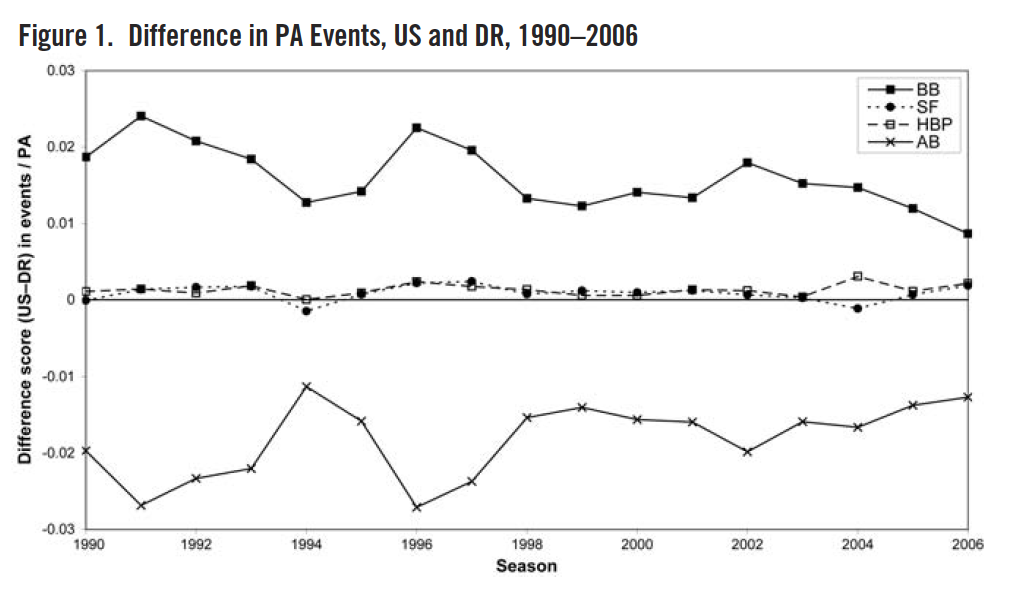
Looking first at SF and HBP (figure 1), we see that the differences were minuscule, never exceeding 3 events per 1,000 PA. Significance testing revealed that in most seasons these differences were statistically insignificant. In those seasons where the differences were significant, they were still not large enough to alter significance in the difference scores for AB and BB. We therefore conclude that the differences in SF and HBP are immaterial and that any differences in AB come at the expense of BB and vice versa.
The difference scores for BB and AB show that the Dominican players consistently walk less often and try to hit more often than do Americans. This difference ranged between 12 and 24 events per 1,000 PA through the 1990s but since 2002 has been on the decline. Despite this trend, the differences were statistically significant in every season at the level of p <0.001. So, although the Dominican players walk more often than they used to, they still walk significantly less often and try to hit significantly more often than do the U.S. players.
Figure 2. Difference in Batting Statistics, US and DR, 1990–2006
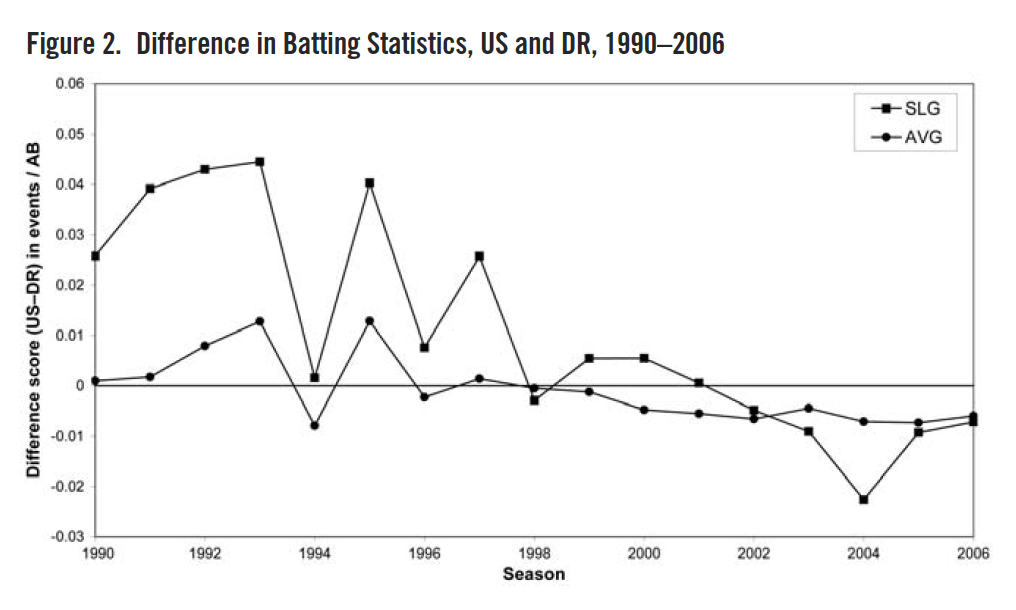
The difference scores in figure 2 show that the U.S. players hit for higher average than did the Dominican players from 1990 through 1995 (1994, the strike-shortened season, is disregarded). Then, from 1996 through 1999, the two groups of players were largely tied in AVG. From 2000 onward, the Dominican players consistently hit for higher average than did the U.S players. Interestingly, significance testing revealed that only in the most extreme seasons (1993, 1995, 2004, and 2005) were the differences significantly different from zero.
Looking at SLG in figure 2, we see that, in the early 1990s, U.S. players had a dramatically larger SLG (as many as 45 more bases per 1,000 AB in 1993). By 1999 the differences declined sharply, until 2002, when the Dominican players finally overtook the U.S players. However, from 1998 onward, only the 2003, 2004, and 2005 seasons were significantly different from zero.
Offensive efficiency
The actual scores (not differences) for OBP for both the Dominican and the U.S. players are displayed in figure 3. The OBPs for the two countries were highly significantly different (p <0.001 in most years) until the 2000 and 2001 seasons, when they show a short-lived convergence. In 2002–4 the differences again gained significance in favor of the U.S. players. In 2005–6 the difference in OBP declined once more, as the Dominican players improved their OBP faster than did the U.S. players. The difference in 2006 shrank to just 0.002, a mere 2 extra times on base per 1,000 PA.
Figure 3. On-Base Percentage (OBP), US and DR, 1990–2006
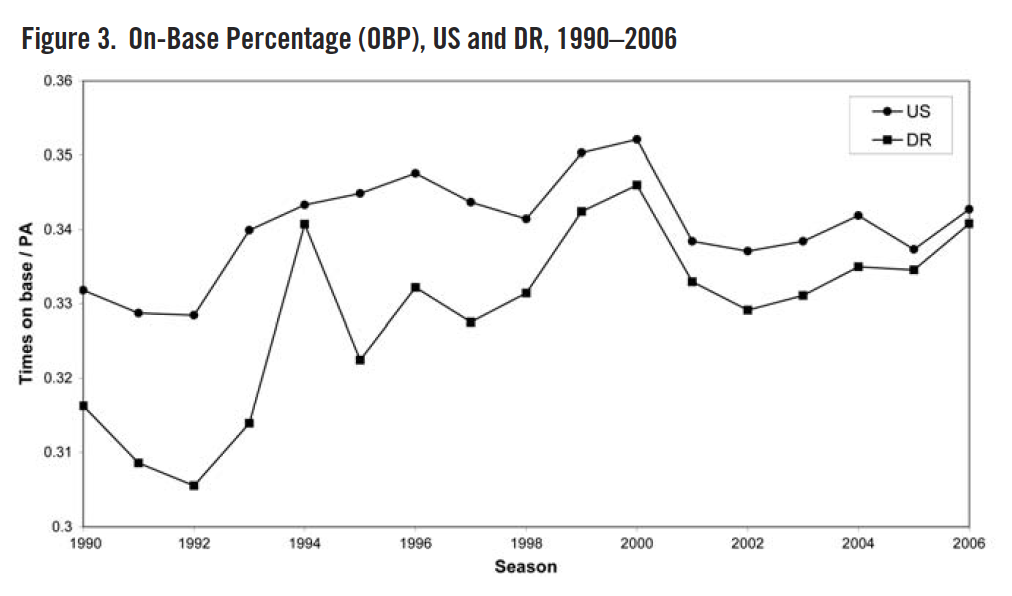
Overall the OBP for both groups improved over the study period, though the improvement of the Dominican players was greater, bringing them to parity with the U.S. players.
Figure 4. Plate-Appearance Base Average, US and DR, 1990–2006
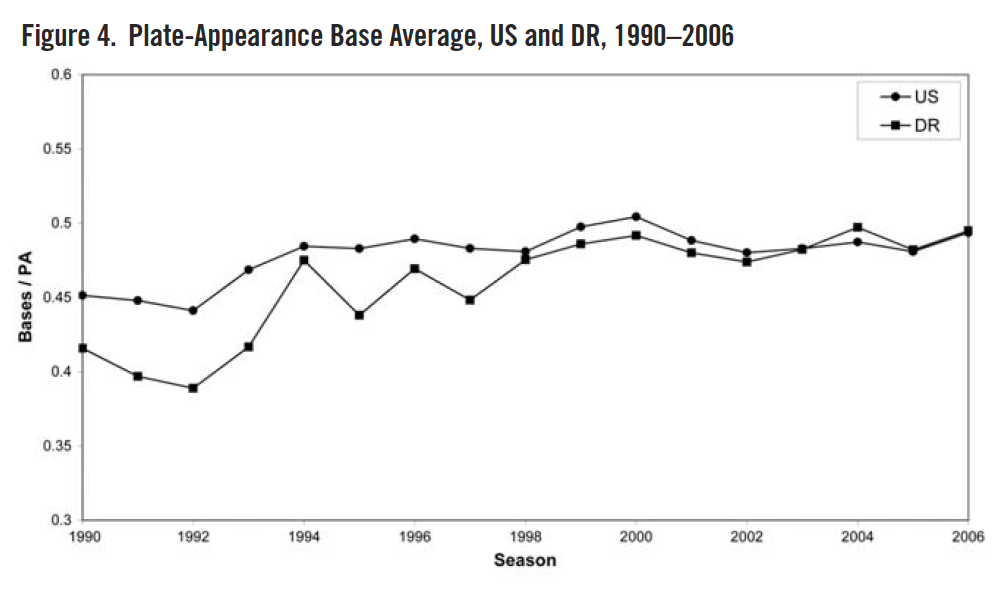
Figure 4 shows the scores for PABA for the two groups. Since hitting provides most of the bases in the numerator of PABA, its pattern is similar to that of SLG seen in figure 2. The U.S. players lead initially, but over time the Dominican players catch up, as the groups reach parity in the early years of the first decade of the twenty-first century. The differences began as highly significant in the early 1990s and continue to be so until 2001. In 2006, both groups achieved nearly 500 bases through action at the plate for every 1,000 plate appearances they made.
DISCUSSION
The data presented in figures 1 through 4 present an interesting picture when considered collectively. They reveal that, despite an initial handicap and an apparently inferior offensive strategy, the Dominican players have improved their hitting to the point that they have overtaken the U.S. players in AVG and SLG and are now at parity with the U.S. players in OBP and PABA. In other words, Dominicans walk less and try to hit more, but when they do try to hit they are more successful in terms of frequency and base production. Their hitting is so successful that they make up for the on-base opportunities and number of bases they would have achieved if they had walked more and tried less often to hit. This in turn allows Dominicans to get on base at the same rate and earn the same number of bases per plate appearance.
Table 2 summarizes the hypotheses of the study and the results found.
Table 2. Summary of Hypotheses and Findings
Limitations
One limitation of the study is the potential for misclassification. Players were selected as being born either in the United States or in the Dominican Republic. However, some may have moved to the other country at a very young age, meaning that their country of relevant baseball development would be misclassified in this study. It seems likely that such crossover is too rare to alter the results. In any event, thorough biographical detective work could eliminate misclassification were it a major concern.
Another potential limitation stems from the small size of the Dominican group. The statistics for this group can be more easily influenced by outliers in the performance data than can the statistics for the U.S. group. For example, the sudden shift in the SLG-difference score in favor of the Dominican Republic (figure 2) and the resulting spike in PABA (figure 4) seen in the 1998 season is due in large part to Dominican Sammy Sosa’s 66 home runs that year. In contrast, Mark McGwire’s 70 home runs in the same season had little effect on the U.S. group’s composite score. However, the trends are generally consistent before and after 1998, suggesting that the results are fairly robust to such unusual performances. Were every data point skewed by outliers, the difference scores year to year would be erratic, bouncing wildly up and down. Instead, the trends are clear and subject to a consistent amount of variation.
This study is also limited in the conclusions that can be drawn from it. Though the methods used here provide a clear picture of offensive strategy and offensive efficiency, it does not provide insight into the real-world impact that these achievements have on their teams’ performances. A more detailed analysis of the base-out and score situations could provide insight in this regard, but it is outside of the scope of the present work.
CONCLUSIONS
The results here indicate that, during the period 1990– 2006, Dominicans consistently preferred trying to hit over trying to walk. In the 1990s, comparisons between Dominican and U.S. players showed gaps in performance, but in recent years Dominicans have elevated their success rate at hitting (AVG) so as to bring their OBP up to match that of the U.S. players.
Furthermore, Dominicans have elevated the number of bases they accrue per hit (SLG) so that they achieve the same number of bases per plate appearance (PABA) as do players from the United States, demonstrating that their hitting-intensive approach to offense does pay off—at least in terms of bases achieved. Thus the characterization of Dominican players as under-performing “hackers” is largely no longer deserved.
Despite its limitations, this analysis provides a thorough and focused way of comparing different groups of players with respect to offensive style. Use of OBP and PABA provides a compact method to evaluate the total offensive batting efficiency of players. MLB clubs could use analyses such as these to search for fertile ground from which to draft new players, or to improve their own players’ batting strategies. In future research, this methodology could be applied to compare leagues, teams, or any two clearly defined and logically comparable groups.
ROBERT J. REYNOLDS is an epidemiologist in the department of symptom research at M. D. Anderson Cancer Center in Houston. His baseball-research interests include new methods of performance measurement and aggregate processes. In spite of recent trends he remains a steadfast fan of the San Francisco Giants.
STEVEN M. DAY, an epidemiologist and medical researcher with the Life Expectancy Project in San Francisco, publishes extensively in peer-reviewed medical journals. He is a fellow of the American Academy of Cerebral Palsy and Developmental Medicine and of the Royal Society of Medicine and a member of the Gerson Lehrman Group’s Council of Healthcare Advisors.
Notes
1. Michael Lewis, Moneyball: The Art of Winning an Unfair Game (New York: Norton, 2003).
2. Sean Lahman, Baseball Archive Database, 1871–2006, www.baseball1.com.2007.
3. Marcello Pagano and Kimberlee Gauvreau, Principles of Biostatistics, 2d ed. (Pacific Grove, Calif.: Duxbury, 2000).