

Pitching, Defense Just Slightly More Important to Team Wins Than Offense
This article was written by Brian Ault
This article was published in 1984 Baseball Research Journal
Baseball folklore abounds with pronouncements as to what areas of the game are most important to winning. These are put forth by venerable veterans and the greenest of rookies, but more commonly these “pearls” of diamond wisdom emanate from those sagacious ex-big leaguers, stars, and scrubs alike. The pronouncements include: “Pitching is 90% of the game (or some variant thereof) “…“ You have to be solid up the middle.” . . . Good pitching always stops good hitting.”…”All you need is a strong bullpen.”
Earl Weaver used to emphasize the home run (three-run variety) as his most important ingredient with the Baltimore Orioles. Sorry, Earl, it was more likely that your pitching and/or solid defense did the trick, regardless of the home runs. How so? Is there any way to empirically assess these tried and true maxims?
Well, yes, friends, there does exist a statistical technique (and you thought we had exhausted them all) which begins to give us an answer to the question: offense or defense? In the lexicon of the social scientist, it is known as “multiple regression analysis.” Let me try to explain, as simply as possible.
If you were asked to predict a given set of teams’ win totals for a season and you wanted to minimize your error, you probably would opt for the mean value (usually around 81 games) for each team, which would be your best statistical bet. However, multiple regression purports to yield better prediction with even smaller error variance. It states that if you know a set of variables – termed “independent variables” – beforehand, you can come up with better predictive quality in the variable in question, termed the “dependent variable.” This implies and assumes both a theoretical and statistical (linear, additive) causation pattern, from a set of independent variables to a dependent variable, in that order.
Given that there is a total amount of variance (or variation in the actual values) in the dependent variable (100%), multiple regression can tell us how much of that is explained by the set of independent variables utilized, in toto, as well as for each variable’s singular contribution. Also, a prediction equation for the dependent variable can be calculated.
The application to baseball and its statistics thus becomes extremely alluring (at least for those of a statistical bent). The dependent variable in question is Team Wins. The set of independent variables would encompass offensive and defensive performance statistics. Given 100% variance or variation in Team Win totals (across one or both leagues), how much can be explained by hitting, pitching or fielding?
How much can’t be? This is the logic and approach taken in my statistical assessment. (For a more thorough exposition of multiple regression, see: Applied Regression: An Introduction by Michael S. Lewis-Beck© 1980. Sage Productions, Inc.; Social Statistics by Hubert M. Blalock, Jr. © 1979. McGraw-Hill).
The title of my analysis is “Baseball Regression 1973-1983: Omitting 1981.” Why 1973-1983 and omitting 1981? Primarily because 1973 heralded the first year of the designated hitter in the American League, and with the omission of strike-shortened 1981 due to its being an aberration, what’s left is a nice ten-year period with which an analysis can be run and an evaluation made.
For this initial analysis, Team Earned-Run Average was chosen to capture the pitching factor (also defense), Team Fielding Average to proxy for defense, and four offensive variables which were readily available: Team Batting Average, Home Runs, Slugging Percentage and Runs Scored. These are my first choices and the potential for revision and greater explication lies in the minds of those who wish to further theoretically and statistically conceptualize.
Using the 1982 edition of The Baseball Encyclopedia and data supplied by the league and commissioner’s offices, and with the computer aid of SPSS (Statistical Package For the Social Sciences – Nie, Hull, Jenkins, Steinbrenner, Bent© 1975, McGraw-Hill), the results obtained were as follows:
REGRESSION FINDINGS*
1. Sample size (omitting 1981)
1973-1976: A.L. (12 teams)= 48 cases
1977-1983: A.L. (14 teams)= 84 cases
132 cases
plus
1973-1983: N.L. (12 teams)= 120 cases
total cases = 252
2. Total explained variance (symbolized in statistics as R2) for all cases (252) was roughly 87%. That is, 87% of the variance in Team Wins could be accounted for by Team Batting average, Home Runs, Slugging Percentage, Runs Scored, Earned-Run Average and Fielding Average. However, Team Batting Average, Slugging Percentage, and Home Runs were found to be not significant, statistically (t-test), meaning that their “impact” was not statistically reliable (could have as easily happened by chance) and their R2 contributions were minuscule, at best. The most useful picture from the output comes from breaking the analysis out by league as follows:
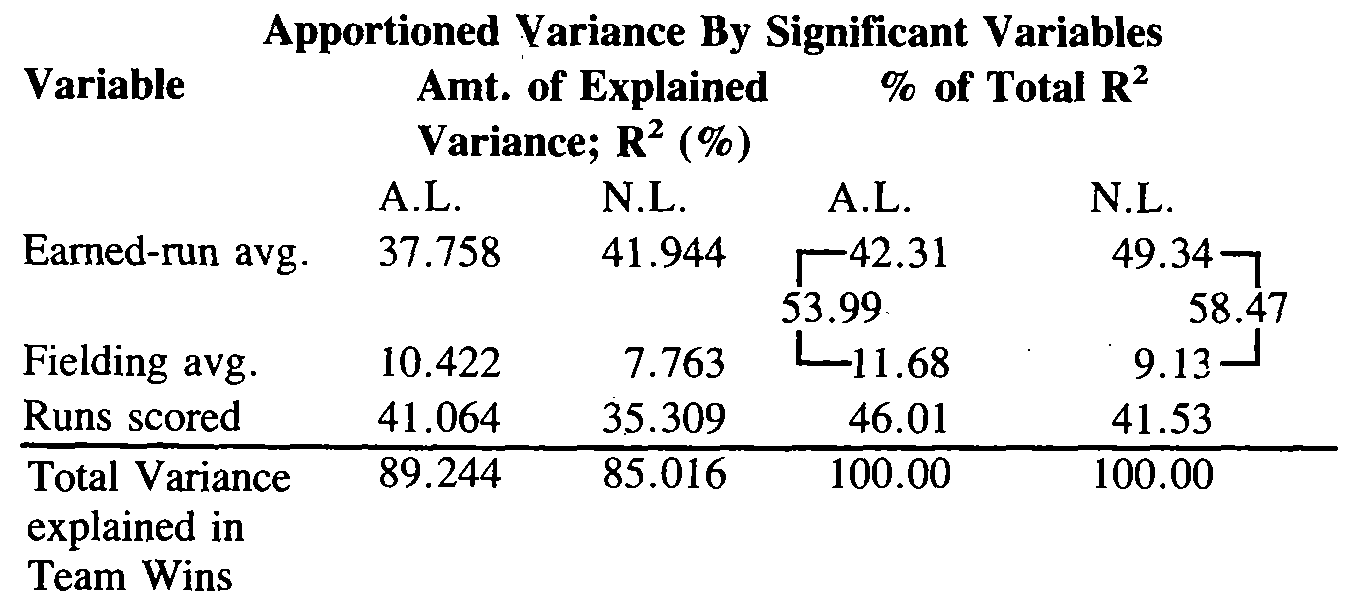
Once again, Team Batting, Home Runs, and Slugging Percentage were not significant (for either league), and the three variables listed are the only ones statistically salient within this analysis. For both leagues, defense, as represented by pitching (earned-run average) and fielding, is more important to Team Wins than the offensive statistic, runs scored, as follows: A.L.: 58%-42%; N.L.: 54%-46%. In the N.L., pitching turns out to be of highest explanatory value, solely, while in the A.L. it is runs scored, which intuitively makes sense, backing up the assertion that pitching is better in the N.L. while offense is the name of the game in the junior circuit. Runs scored, you might say, has to be highly related to Team Wins, given that you have to score more runs than the opponent to win. This is true although there are many teams that score heavily but still fail to win consistently. Is this a tautological cycle or not? Or does it show that it doesn’t matter how you score, just so you get those runs across the plate?
More ruminating needs to be done on other possible offensive statistics. Is the fielding average contribution greater in the A.L. because there is more hitting? Only speculation. The major caveat remains that there still is 11% left unexplained in Team Wins in the A.L. while the figure is 15% in the N.L. Perhaps if other offensive statistics were used, the balance would swing in the other direction. For the time being, though, the proof is in the numbers as they stand and the burden on the skeptic is to disprove.
PREDICTION EQUATIONS
One by-product of this regression analysis is the calculation of a prediction equation mathematically relating the independent variables to the dependent variable, Team Wins. While based on a specific ten years’ worth of history, it still can allow the fan to predict what his/her favorite team’s win total should be given the team’s current statistics as well as projecting what it needs to do to improve its current standings. The equation:
A.L.: Team Wins = -417.861 + 497.80 X Fielding
Avg.+.104xRuns Scored-15.721xERA
N.L.: Team Wins= -142.815+223.976xFielding
Avg. + .103 X Runs Scored- 17.5 19 x ERA
*It should be noted that the numbers multiplied by the performance variables are known as “slope coefficients” and these, as well as the explained variance figures, are generated by a method known as “OLS”, ordinary least squares. The SPSS computer package utilizes OLS principles in conjunction with matrix algebra to produce these results. A more detailed statistical analysis can be had upon request from the author.
Well, there you have it. An inveterate fan and social science student’s contribution to the mainstream of baseball arcana, grist for those upper-deck games between spectators known as “trivial pursuits.”
As stated before, much still can be done to close the gap between what I have explained (89%-A.L.; 85%-N.L.) and the perfect world of 100% explained variation. While seasoned watchers might allocate that 11 and 15 percent, respectively, to managerial acumen or team spirit or ballpark design, I would prefer to think that there are other variables with which to creep closer (Total DPs? Total Bases? Proportion of a team’s hitters above .300? A Bill James’ creation? Someone else’s?). I encourage any and all to participate with further suggestions. The only requisites are a fanatical love for baseball and a knowledge of its “numbers” as well as a compulsion to care about such things!