‘Recorded Games of Frustration’: Win Expectancy and the Boston Red Sox
This article was written by Michael Mitchell
This article was published in Spring 2013 Baseball Research Journal
 On October 26, 1986, the day after the Boston Red Sox lost Game Six of the World Series, Leigh Montville of the Boston Globe wrote: “Never have the Red Sox come this close and failed. Never in the Bucky Dent game or the Enos Slaughter game or the Jim Burton game or all the recorded games of frustration had the finish been this close to a championship. Never. Not since 1918. Never.”1 In the years since that article was published, baseball fans would undoubtedly add what could be called “the Aaron Boone game” and the last day of the 2011 season to that ignominious list of games in which the Red Sox snatched defeat from the jaws of victory.
Writing immediately after the 1986 loss, Montville asserts that the Red Sox had never been closer to the world title. With the help of Baseball-Reference.com’s detailed Win Probability charts, I aim to test the accuracy of the claim, adding the 2003 ALCS loss (“the Boone game”) and the last day of the 2011 season (“Game 162”) to the inventory of frustrating moments Montville provides.
While examining the Win Probability charts, I will also address another question: the culpability of Bill Buckner in the 1986 World Series loss, and the relative importance of the other signature moments in Montville’s list.
METHODOLOGY
Retrosheet has compiled and made freely available to the public every Major League Baseball box score from 1918 to the present. For every game considered in this study, the respective Baseball-Reference box score pages also contain a play-by-play chart and the calculated change in Win Probability resulting from each play. The probability is measured in terms of each team’s Win Expectancy (WE), or the likelihood of each team winning, expressed as a percentage.2
An individual play, therefore, has a Winning Team Win Probability Added (wWPA), which could also be considered the change in WE that results from the play. In order to measure how “close” the Red Sox were to winning the games that Montville listed, I have looked at the peak WE recorded for the Red Sox in those games to determine which game brought the Red Sox closest to a 100 percent WE. I have also assessed the wWPA for each of the infamous plays by which the games are known.
RESULTS
Moving game by game through Montville’s list in the order he arranged them, one would begin with the Bucky Dent game, which was the 1978 AL East division tiebreaker game of October 2, 1978.3 That afternoon, the Red Sox recorded an intra-game high WE of 85 percent in the top of the seventh inning. Dent’s threerun home run three batters later boosted the Yankees’ odds from a WE 18 percent to 64 percent, good for 46 percent wWPA, which is the second biggest wWPA on this list—bigger than the Buckner error that allowed Ray Knight to score in 1986.
Next on Montville’s list was the Enos Slaughter game, which was Game Seven of the 1946 World Series.4 The Red Sox were never as close to winning this game as they were in the Dent game: 67 percent was the highest WE recorded for the Red Sox that day. The Slaughter play—in the bottom of the eighth with two outs, Slaughter scored from first on a Harry Walker double—moved the Cardinals from a 55 percent WE to 87 percent WE, or 32 percent wWPA.
The Jim Burton game is a World Series Game Seven, too.5 The final game of the 1975 Reds-Red Sox Series saw Burton pitch for the Red Sox in the top of the ninth inning, giving up a two-out RBI single to Joe Morgan that moved the game from a 50 percent WE to an 84 percent WE for the Reds. Morgan’s hit added 34 percent to the winning team’s Win Probability. Earlier in the game, the Red Sox had a high probability of winning; in the bottom of the fifth inning, their WE reached 90 percent.
Looking next at the Boone game, the Red Sox reached a heretofore unseen level of proximity to a 100 percent WE.6 In the eighth inning of Game Seven of the 2003 ALCS, Nick Johnson hit a pop fly to the shortstop, pushing Boston’s WE to 94 percent. Boone’s walk-off homer in the 11th brought New York from a WE of 64 percent to 100 percent, or a 36 percent wWPA.
The other game I added to the original Montville list was Game 162 of the 2011 season.7 In the bottom of the ninth with two outs, Red Sox closer Jonathan Papelbon was pitching to the Orioles’ Nolan Reimold. Pinch runner Kyle Hudson was on second base when Reimold hit a groundrule double, tying the game at 3–3, moving the WE for the Orioles from 14 percent to 61 percent, or a wWPA of 47 percent. Of all the plays on the list, this was the one with the largest impact. The Orioles went on to win on a walkoff single that drove Reimold in from second. The Red Sox’ peak WE in Game 162 was 95 percent.
Finally, there’s the Bill Buckner game, which actually did bring the Red Sox closer to a 100 percent WE than any game on this list.8 Keith Hernandez hit a fly ball to center field with one out in the 10th inning. It was on this play, with the second out recorded and a 5–3 lead over the Mets, that the Red Sox recorded their intragame peak WE: 99 percent. They would see that WE fall to 81 percent by the time Mookie Wilson stepped to the plate to face pitcher Bob Stanley with two men on and two outs later that inning.
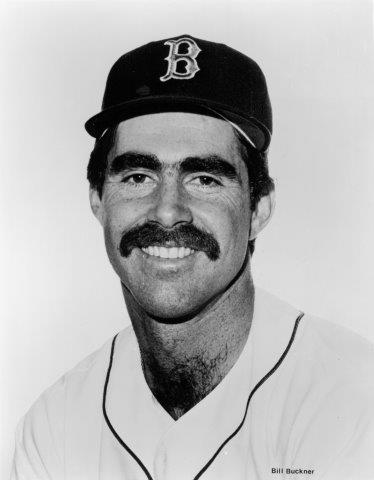
Another article in the Boston Globe on October 26, written by Jackie MacMullan, focused on the costliness of Bill Buckner’s error at first base. The article was called “Ball Bounced in a Bad Way,” and centered on the final play of the game.9 Indeed, much of the criticism resulting from the Boston’s failure to win the 1986 World Series would focus on the final play, in which Buckner let a ball get by. The fact is, however, that according to Baseball-Reference’s Win Probability Chart, the play with the biggest impact on the outcome of the game was not that infamous ground ball—it was Bob Stanley’s wild pitch to Mookie Wilson. With a count of 2–2, Stanley threw a wild pitch that allowed Kevin Mitchell to score from third and Ray Knight advance from first to second base. The Mets went from a WE of 19 percent before that wild pitch to 60 percent after, or a movement of 41 percent wWPA for the Mets. The error at first base later in the same at-bat, which brought the winning run across home plate, carried the Mets from a 60 percent WE to 100 percent, or 40 percent wWPA.
CONCLUSIONS
With an intragame high Win Expectancy of 99 percent, the 1986 World Series Game Six was the closest the Red Sox came to winning a World Series without securing a victory. Measured against the Montville list and the similarly close Aaron Boone game of 2003 and 2011’s Game 162, the 1986 Game Six wins out as the highest peak WE for Boston. Ordered from greatest to least in terms of Boston’s peak intragame WE, the games would be listed as follows: the Buckner game (99 percent WE), Game 162 (95), the Boone game (94), the Burton game (90), the Dent game (85), and the Slaughter game (67) (See table 1; chart 1).
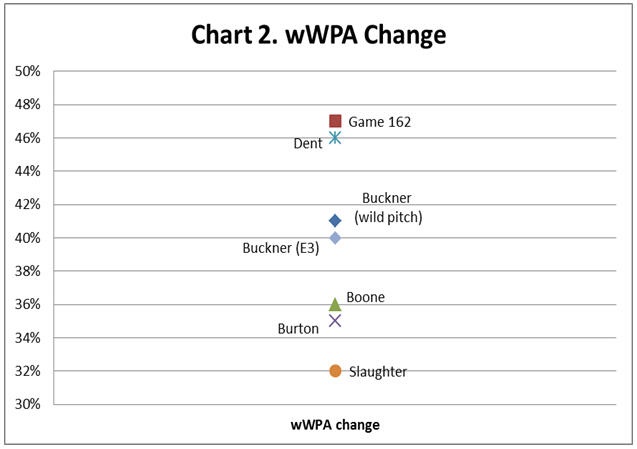
Interestingly, the Bob Stanley wild pitch to Mookie Wilson had a greater impact than the Bill Buckner error for which the game is typically remembered, if only by a single percent of wWPA. And a look at wWPA shows that the single biggest play in any of the six games was Nelson Reimold’s ground-rule double off Jonathan Papelbon, which added 47 percent to the Orioles’ WE. If the games were ordered in terms of the impact of their big moments, the list would be as follows: Game 162 (47 percent wWPA), the Dent game (46), the Buckner game (41 and 40), the Boone game (36), the Burton game (35), and the Slaughter game (32) (See table 2; chart 2).
At the time Montville was writing, the Bucky Dent home run was already a bigger play than either Stanley’s wild pitch or Buckner’s error, though he was correct in his assertion that Game Six of the 1986 World Series was the “closest” the Red Sox came, at least if measured by the Red Sox’s WE.
Two other factors are worth noting: the first is that of all the games on the list, the Buckner game is the only one that did not result in Boston’s immediate elimination; that loss merely forced a Game Seven, which the Mets also won. It is also worth mentioning that Game 162 alone did not end Boston’s season in 2011: only the combination of a loss by Boston and a win by Tampa Bay on the last day of the season would have prevented the Red Sox from making the postseason. So while Reimold’s ground-rule double caused a 47 percent swing in the WE of the Boston game, it was that outcome combined with Tampa Bay’s own unlikely win that secured Boston’s fate. How improbable was Tampa Bay’s win that day? The Yankees, their opponent, carried a WE of 99 percent or better from the bottom of the fifth inning through the first batter of the bottom of the eighth before the tide turned Tampa Bay’s way.10 The fact that New York was favored so late in the game only compounds how close the Red Sox came to the postseason in 2011.
Baseball fans will look back on these plays and attribute certain levels of significance to their outcomes. One’s age, one’s level of commitment to the team, and countless other factors will make a particular loss more painful or a given event more crushing. And in the immediate aftermath of the “Buckner game,” the attention became focused on the first baseman’s error and has been there ever since. Thanks to the availability of Win Expectancy from Baseball-Reference, one can find a measure by which to compare what Montville called “recorded games of frustration,” and appreciate that it was with keen insight that he wrote, “Never have the Red Sox come this close and failed” after Game Six of the 1986 World Series.11 Just don’t chalk the entire loss up to Bill Buckner’s error.
MICHAEL MITCHELL is a SABR member and librarian in the Minneapolis-St. Paul area. In good years and bad, he roots for the Minnesota Twins. Though he’s long been watching baseball, he is new to writing about the game and encourages readers to send any feedback to mitc0348@gmail.com.
PHOTO CREDIT
Bill Buckner, National Baseball Hall of Fame Library.
NOTES
1 Leigh Montville, “They Were Just One Pitch Away,” Boston Globe, October 26, 1986.
2 “Win Expectancy (WE) and Run Expectancy (RE) Stats,” Baseball-Reference, accessed October 20, 2012, www.baseball-reference.com/about/wpa.shtml.
3 “October 2, 1978 New York Yankees at Boston Red Sox Box Score and Play by Play,” Baseball-Reference, accessed October 20, 2012, www.baseball-reference.com/boxes/BOS/BOS197810020.shtml.
4 “October 15, 1946 World Series Game 7, Red Sox at Cardinals,” Baseball-Reference, accessed October 20, 2012, www.baseball-reference.com/boxes/SLN/SLN194610150.shtml.
5 “October 22, 1975 World Series Game 7, Reds at Red Sox,” Baseball-Reference, accessed October 20, 2012, www.baseball-reference.com/boxes/BOS/BOS197510220.shtml.
6. “October 16, 2003 American League Championship Series (ALCS) Game 7, Red Sox at Yankees,” Baseball-Reference, accessed October 20, 2012, www.baseball-reference.com/boxes/NYA/ NYA200310160.shtml.
7. “September 28, 2011 Boston Red Sox at Baltimore Orioles Box Score and Play by Play,” Baseball-Reference, accessed October 20, 2012, www.baseball-reference.com/boxes/BAL/BAL201109280.shtml.
8. “October 25, 1986 World Series Game 6, Red Sox at Mets,” Baseball-Reference, accessed October 20, 2012, www.baseball-reference.com/boxes/NYN/NYN198610250.shtml.
9. Jackie MacMullan, “Ball Bounced in a Bad Way,” Boston Globe, October 26, 1986.
10. “September 28, 2011 New York Yankees at Tampa Bay Rays Box Score and Play by Play,” Baseball-Reference, accessed October 20, 2012, www.baseball-reference.com/boxes/TBA/TBA201109280.shtml.
11. Montville, Globe.


