

Relative Team Strength in the World Series
This article was written by Alexander E. Cassuto - Franklin Lowenthal
This article was published in 2006 Baseball Research Journal
This essay examines some statistical features of the major league baseball World Series. We show that, based upon actual historical data, we cannot reject at the .05 level the hypothesis that the two World Series teams are evenly matched, but we could reject it comfortably at the .10 level. Yet we can also calculate the relative strengths of the teams that would best match the actual outcomes, and we find that those relative strengths are not equal. Including the home field advantage in the calculations indicates that the differential in relative strength between the competing teams can be explained by this advantage.
We present the relative team strengths that would maximize the probability of four-, five-, six-, and seven-game series. We find that a six- or seven-game series is most likely when the two teams are evenly matched, a four-game series is most likely when the probability of the stronger team winning is one, while the probability of a five-game series is maximized if one team has a relative strength of 0.789.
We also show that, on average, the expected number of World Series games will be between 4 and 5.81, depending upon the relative strengths of the teams and the home field advantage. Contracts that don’t consider the likelihood of less than seven-game series create windfall gains to MLB and marginal economic losses to broadcasters.
Relative team strength is a factor determining the number of games played in baseball’s World Series. This paper examines some statistical aspects of expected outcomes using the binomial probability distribution and data from the initial World Series in 1903 to the 2005 White Sox–Astros series. By extending the analysis we can also determine the revealed relative strength of World Series teams based upon the actual outcome of the 97 World Series played as best-of-seven series. The four World Series played as best of nine (1903, 1919–1921) were not included in the results, and games played to ties (1907, 1912, 1922) were not considered, although the actual World Series results were included.
Data and Analysis
The formula:
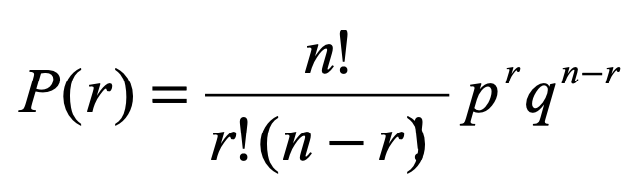
where r is the number of successes (in this case, four), n the number of trials (games played), and p the probability of one team winning a game (q=1-p), describes the probabilities of all possible outcomes of a World Series except that there are only a total of 70 possible outcomes, not 27= 128, as the last trial must be a success
Assuming each team has an equal probability of winning each World Series game (p=q), the probabilities of the duration series are calculated simply:
Table 1: Probabilities of World Series Duration
| Total games | Probability |
|---|---|
| 4 | 0.125 |
| 5 | 0.25 |
| 6 | 0.3125 |
| 7 | 0.3125 |
Examining the actual results from all the World Series that have been played we find that 19 series were decided in four games, 21 were decided in five games, 22 were decided in six games, and 35 went the full seven games.
The theoretical outcomes, based upon the probabilities in Table 1, are 12.125 for a four-game series, 24.25 for a five-game series, and 30.3125 for both six- and seven-game series. Using the null hypothesis that the World Series teams are evenly matched, the computed value of chi-square is routinely found to be 7.338. Using the chi-square D-test, at 0.05 permissible type one error and three degrees of freedom, we don’t reject this hypothesis since the table value is 7.81 (but we could comfortably reject the equally matched hypothesis at the 0.10 level, as the table value there is only 6.25).
An interesting aspect of this analysis emerges as we minimize the computed chi square in order to find the revealed relative strengths of the teams given the actual results. In this sense we are finding the expected probabilities that best match the actual outcome over all World Series played. We find that the probabilities that minimize chi-square at a value of 6.886 are approximately p=0.5138 and q=0.4862. Based on actual outcomes utilizing the chi-square, the two teams entering the series do not have the same probabilities of emerging victorious in terms of the revealed team strengths.
One of the most surprising aspects of the actual outcome data is that while it indicates that if the two teams are equally matched, six- and seven- game series are equally probable, there have been only 22 six-game series but 35 seven-game series. Under the assumption that the teams are evenly matched, we compute the probability that of the 57 series that lasted more than five games, 35 or more would last the full seven games to be only .0427. Here we used the normal distribution as an approximation to the binomial distribution. For a one-tail test we can reject the null hypothesis at the 95% confidence level. Clearly the probability of a series that is not decided in five games ending with the sixth game should increase if the teams are not evenly matched (i.e., if p is greater than .50). We offer a non-statistical explanation for this statistical anomaly. The team that is behind must play to win games at all costs; thus it may change its rotation to start its best pitcher, use its best reliever for more innings than usual, etc., while the team that is ahead will formulate its strategy so as to win one more game, not necessarily the sixth game.
Finally, we can use the theoretical outcomes to see what relative team strengths are most likely to bring about each possible outcome in terms of games played. In other words, for what value of p are the probabilities in Table 1 above maximized? Our results are summarized in Table 2 below. The derivation of these results is a simple exercise in differential calculus; the details are omitted.
Table 2: Results
| Series Games | Probability That Maximizes | Maximum Probability |
|---|---|---|
| 4 | p=1 or p=0 | 1.000 |
| 5 | p=.789 or p=.211 | 0.3333 |
| 6 | p = .50 | 0.3125 |
| 7 | p = .50 | 0.3125 |
Home Field Advantage
Home field advantage may play an important part in this analysis. Here we define home field advantage as the advantage gained by the team playing at home for the first game of the Series. There are at least two alternative definitions of home field advantage. One is that there is only home field advantage if there is a final deciding seventh game (ninth game in those World Series that were best five out of nine). There have been 35 such series with the home team winning the final deciding game 18 times and the visiting team winning 17 times. Clearly, this is not statistically significant. Another definition of home field advantage is that it exists in any series with an odd number of games. The advantage belongs to the team with more home games. There has been a total of 57 such World Series with the home team winning only 27 of them (less than half) while the visiting team has won 30 times.
Home Field Determination
The current mechanism awards home field advantage, and the commensurate higher probability of winning the World Series, to the league that wins the All-Star Game. The effect on all-star voting remains to be seen. Imagine fans from the National League voting for the strongest players in their league on their All-Star ballots, while voting for the weakest All-Stars on the American League ballot. All-Star managers have limited possibilities to correct fan voting of position players; their selection strength is in the choice of pitchers. It may well be the case that the league with the strongest individual players gains a long-run advantage in World Series outcomes through home field advantage. Many will argue that this is an untenable situation. After all, the American League has won the last nine All-Star games played to a conclusion, and won 14 of the first 18 games. Having a World Series home field advantage determined on the basis of All-Star game victories may leave one league out in the cold for many consecutive years. This does not seem equitable in view of the demonstrated advantages of home field advantage in World Series play.
Contracts and Outcomes
MLB has a long history of contractual relationships with the broadcast media. The first national broadcast of the World Series occurred in 1922 and no fees were paid for the rights. The first rights were given to the Ford Motor Company in 1934 for $100,000. The current contract calls for $2.5 billion payments by Fox to MLB for the rights to World Series, league and divisional champion- ships, regular season and All-Star games for six years, an average of $417 million per year.
Clearly, the rights include an estimate of the value of each of the components, since past contracts between MLB and broadcasters have often divided the four components listed above among more than one broadcaster. In fact, since 1976 at
least two networks have been broadcasting national baseball games. The World Series is the highlight of the season and carries with it the highest per game value in terms of advertising fees. Based upon past contracts, we estimate current fees for
the World Series broadcast rights to be approximately $115 million for a per game average of approximately $15 million. The average assumes that the value of all games is equal, an assumption that is dubious at best. Certainly the seventh game of a World Series played on a Sunday night in prime time is worth considerably more than any others.
Table 3 shows the relationship between the strength of the stronger team and the expected number of games to be played in the World Series. If the relative team strengths are 1 and 0, then the stronger team will sweep the series. If the balance of strength narrows somewhat to 0.75 and 0.25, an average of 5.163 games will be played in the World Series. If the teams are of equal relative strength, 0.5 and 0.5, we would expect the greatest number of games, an average of 5.81, until one team won four.
Table 3: The Effect of Team Strength on World Series Duration
| Expected # of Games |
Relative Strength of Strongest Team, including Home Advantage |
|---|---|
| 4 | 1.0 |
| 4.21 | 0.95 |
| 4.439 | 0.90 |
| 4.68 | 0.85 |
| 4.927 | 0.80 |
| 5.163 | 0.75 |
| 5.378 | 0.70 |
| 5.56 | 0.65 |
| 5.7 | 0.60 |
| 5.78 | 0.55 |
| 5.81 | 0.50 |
If the networks are estimating a value of $15 million per game and expect a seven-game World Series, the networks winning the bid would lose almost $20 million, on average, even if the teams were equally matched. A four-game sweep would cost the broadcaster $45 million unless some provision for lowered payments were to be included in the contract.
Conclusion
Using the binomial distribution and actual World Series outcomes, we have determined the revealed team strengths and the most likely relative strengths for each of the possible outcomes of a seven-game series. We have also shown that a typical World Series has an expected number of games (5.81). Since each game has economic value to the contractual broadcaster, contracts that do not consider the probability of less than seven-game series are likely to cause marginal economic losses to the networks and windfall gains to MLB.
One example of the effect of a short series on earnings was reported in CNNSI.com.In the 1998 World Series, the Yankees swept the Padres in four games. “Fox never had the benefit of a drama-building long series and ended up losing an estimated $15 million because of the sweep. The network needed a five-game series to break even.”2 Since the contract between Fox and MLB was substantially lower in 1998, the estimated figures cited for the value of a World Series game are in line with the increased value of the new contract.
ALEXANDER E. CASSUTO received his Ph.D. in Economics from UCLA in 1973. He is a professor at Cal State East Bay and the author of many journal articles and monographs.
FRANKLIN LOWENTHAL grew up in the shadow of Yankee Stadium in the era of DiMaggio and Mantle. He teaches at Cal State East Bay.
Notes
1. CNNSI.com. “Fox Lands Exclusive TV Rights to Postseason Baseball,” sportsillustrated.cnn.com/baseball/mlb/news/2000/09/26/postseason_coverage_ap/
2. CNNSI.com. “Fox Posts Lowest Rated Series Ever,” sportsillustrated.cnn.com/baseball/mlb/1998/postseason/news/1998/10/22/series_ratings/
3. The Sporting News. The Vault, www.sportingnews.com/archives/almanac/baseball/
4. Staudohar, Paul D. “The Symbiosis Between Baseball and Broadcasting,” in Alvin L. Hall. ed., The Cooperstown Symposium on Baseball and American Culture, 2001,(Jefferson, NC: McFarland, 2002).
5. “Summer 1997: 75 Years of National Baseball Broadcasts,” roadsidephotos.com/baseball/nationalbroadcast.htm
6. “Out of Control Yet?” www.ezboard.com