

Relief Pitching Strategy: Past, Present, and Future?
This article was written by Pete Palmer
This article was published in Spring 2018 Baseball Research Journal
 The outlook wasn’t brilliant for Our Hero. After a dozen years in the majors with some success, he was coming off a subpar year and had just been traded for three minor leaguers, who would remain so. Little did he know that along with his manager, he would change the way baseball was played. He would also pitch another dozen years, win an MVP and a Cy Young, and be elected to the Hall of Fame. This was Dennis Eckersley, traded in 1987 by the Cubs to the Oakland A’s and manager Tony La Russa.
Eckersley was one of only 12 pitchers who had at least five years of 20 starts and five of 40 relief appearances. With 12 of each, Eck leads the list. Second was Rick Honeycutt (10 and 9), who would join Oakland later in the year and work in the same bullpen with Eckersley for seven years. Looking at their success and that of others, maybe more pitchers would have been able to do the same if given the chance. The list includes Gerry Staley, Ron Kline, Moe Drabowsky, Turk Farrell, and Ron Reed from the old days, Greg Swindell, Tom Gordon, Darren Oliver, Jeff Fassero, and Jamey Wright more recently. Only four pitchers have more seasons than Eckersley—Nolan Ryan with 27, Tommy John with 26, and Charlie Hough and Jim Kaat with 25.
WIN PROBABILITIES
I developed a stat called a true save opportunity. That is when the pitcher comes in with his team ahead, but their win probability is below 50 percent because of the opponent base-out situation. There have been 2,673 such situations since 1971. From 1971 through 1980, the team save leader was brought in 36 percent of the time. This number has been plummeting ever since: 23 percent in 1981–90, only 10 percent in 1991–2000, and 4.7 percent for 2001–17. So when the game is really on the line, the closer is hardly ever called on. In the last 17 years, there have been 934 of these. Only 31 were in the ninth inning. Most came in the sixth (258), seventh (284), and eighth (214). The first five innings only had 147. It is very difficult for a closer to get a true save when he nearly always comes in with the bases empty. This is not meant to redefine the save, just a way to look at a subset of them.
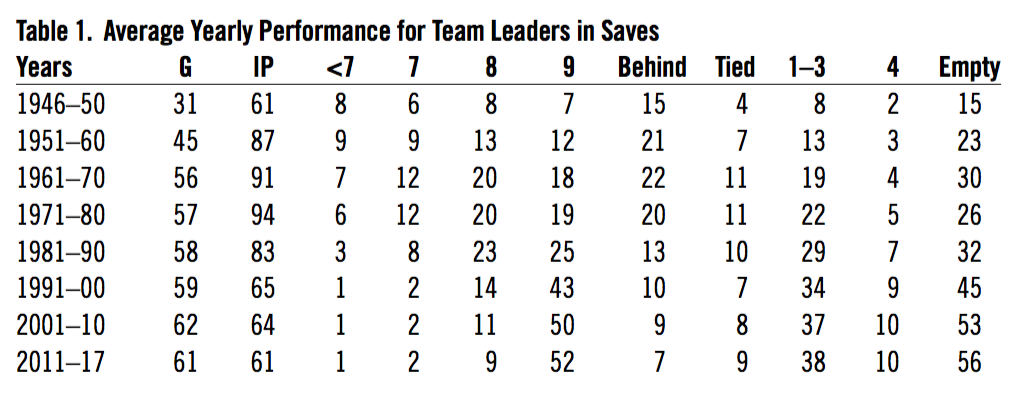
Table 1 below shows average yearly performance for the team leaders in saves, showing inning and score entering the game and how often the bases were empty.
Table 1. Average Yearly Performance for Team Leaders in Saves
(Click on any table image below to enlarge.)
As you can see, the change in closer use happened very quickly. By 1991 it was virtually complete. It used to be common for a relief pitcher to throw 100 innings. From 1971 through 1989, the number was equal to about one for every two teams. From 1991 to 2000 there were 30. After that only five. Scott Proctor was the last, in 2006.
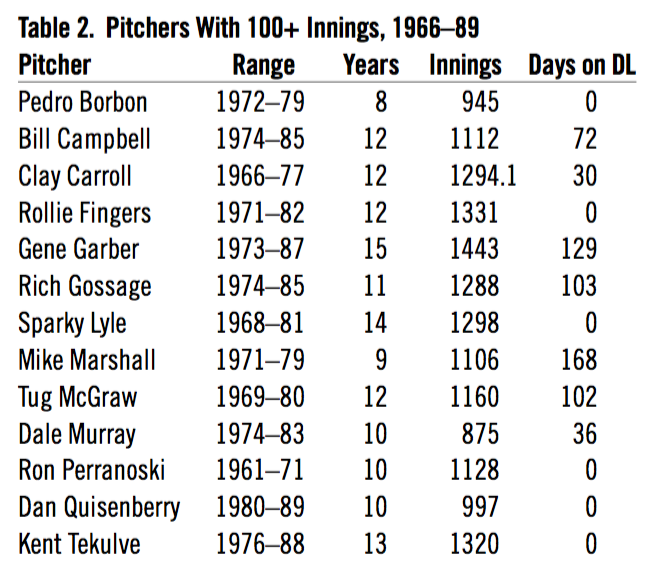
In the 1970s, several pitchers managed 100 or so innings a year without any problems, averaging about five days a year on the disabled list, as shown in Table 2.
Table 2. Pitchers With 100+ Innings, 1966–89
The fireman strategy of bringing in your best reliever when the game was on the line, often before the ninth inning—and not only when winning—would be changed. Now your best reliever would be brought in primarily to start the ninth inning with a lead of one to three runs, reducing his innings pitched by about a third.
But is it a good strategy? Dave Smith showed in his wonderful paper “The Myth of the Closer” a startling fact: The probability of a team winning the game with a lead going into the ninth inning has not changed in a hundred years! This fact certainly suggests that the strategy is not working. I looked at data from 1911 to the present, separated by top and bottom of the ninth (See Table 3).
Table 3. Probability of Winning with a Lead Entering the 9th Inning

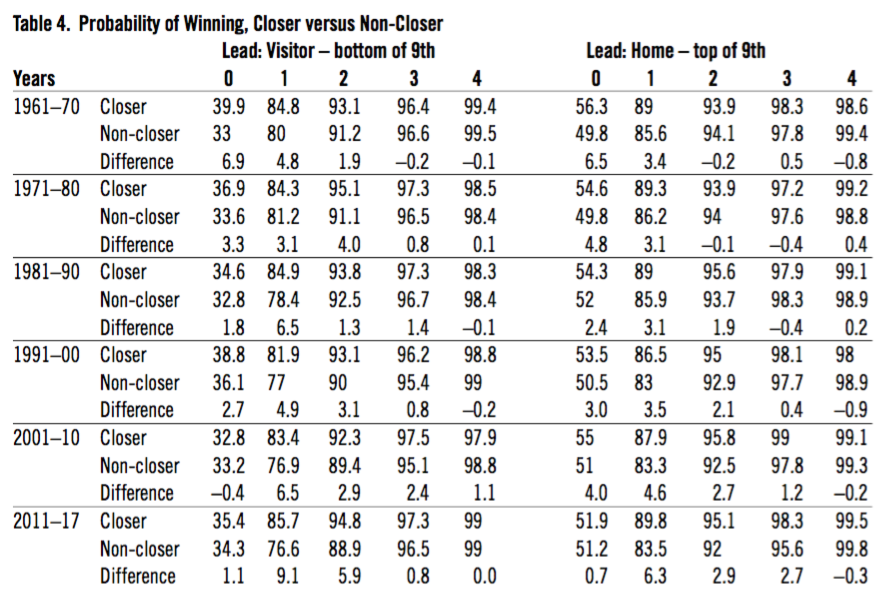
In Table 4, I split the data depending on whether the team leader in saves or someone else was pitching. The top line is for the closer, the second line for another pitcher, then the difference. With a one-run lead in the ninth, the visitor closer has about a 6 percent advantage over other pitchers, while the home closer has about a 4 percent advantage. With a two- or three-run lead, it is only about 2 percent. Each of these six situations happens about five times a year for a total of 30, meaning the closer might add about one win a year compared to other pitchers. The closer is in there about 70 percent of the time.
Table 4. Probability of Winning, Closer versus Non-Closer
TOO MANY PITCHERS
Another effect of the modern closer strategy is the sheer number of pitchers on a team. According to Cliff Blau’s excellent article found at ballstat.com, the 25-player limit has been in effect more or less since 1910. The number of pitchers, however, has grown. The data on the World Series rosters in the Elias Book of Baseball Records show a team carried about eight pitchers in the teens and nine through 1940, then leveled off at 10. Snapshots of rosters since then have shown that by 2000 teams were pushing 11 pitchers on average, in 2010 it was up to 12, and in 2017 it was almost 13. The percent of debut players who were pitchers was around 45 percent into the ’90s but has increased rapidly so that it’s now almost 60 percent. So you could make an argument that there are about three pitchers on every team who wouldn’t have been in the majors 20 years ago.
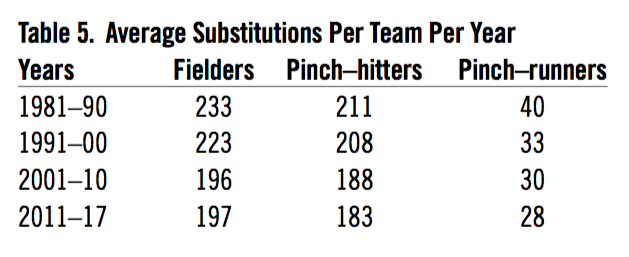
This increase in pitchers reduces the number of bench players by an equal amount. So in the ’90s, 10 pitchers on a team would mean seven subs in the NL and six in the AL. Carrying 13 pitchers reduces those numbers to four and three. This cuts down on the number of moves a manager can make during the game in terms of pinch-hitters, pinch-runners, defensive replacements at other positions, and platooning.
The data for substitutions over the past four decades show a reduction in all categories, as shown in Table 5. The value of these substitutions could be the subject of another paper. However, the data show the average number of subs per team per year. The pinch-hit number is a hybrid because the NL has about three times as many since NL teams pinch-hit often for the pitcher. Numbers are adjusted for various work stoppages.
Table 5. Average Substitutions Per Team Per Year
For platooning, thanks to Retrosheet box scores and event files, I tabulated the number of right-handed, left-handed, and switch-hitters vs. right- and left-handed starters by position for 1911 to the present. I measured the degree of platooning by taking the percentage of left-handed batters for all positions against right-handed pitchers minus the percentage of left-handed batters vs. left-handed pitchers. Switch-hitters were ignored. Pitchers were not included. The measure started out slowly at 3 percent in 1911 but was up to 6 percent by 1920 and 8 percent for 1921–45. The period 1958–90 saw the peak of about 20 percent, which has declined to 14 percent today. The top team mark was 46 percent by the 1972 and ’73 Tigers. The 1972 team platooned at six positions, with a 100 percent mark at second base (Dick McAuliffe and Tony Taylor), 90 percent at first base (Norm Cash and others), 70 percent in left field (Gates Brown and Willie Horton). Only Aurelio Rodriguez and Ed Brinkman escaped, batting right-handed in all games where they appeared as starters. George Stallings, manager of the 1914 Braves, often thought to be the father of platooning, had a high team mark for that era of 20 percent, but that figure has been surpassed many times since.
I identified a platooning situation if a left-handed batter had over 70 starts against right-handed pitching and a right-handed batter had over 30 starts against left-handed pitching. The first pair to meet this requirement was left-handed Dick Hoblitzell and right-handed Del Gainer at first base for the Red Sox in 1915–17. Strangely enough, the first NL pair was Casey Stengel and Jimmy Johnston, Dodgers right fielders in 1916. Casey remembered that well when he became Yankee manager in 1949. In 1981–90 there were eight pairs a year that met that criterion, while in 2011–17, there were only three.
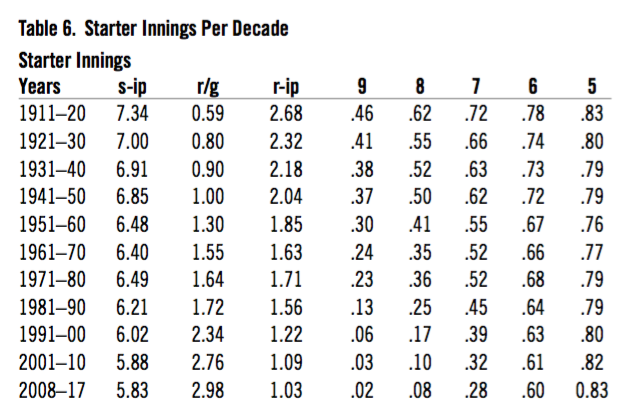
The number of pitchers per game has skyrocketed. The first nine-inning game with 15 or more pitchers was in 1993. There were two more in the 1990s and about one a year through 2014. There have been 21 in 2015–17. The number of innings pitched by the starter has only gone down by about one since the 1930s, but the number of relievers per game has more than tripled, while individual relievers’ innings per game have been cut in half. The number of starters going five or more innings really hasn’t changed, but longer outings have been reduced dramatically. See Table 6.
Table 6. Starter Innings Per Decade
LEFT/RIGHT FACTORS
Part of the current reliever strategy, besides saving the closer for the ninth inning, is to have a left- and right-handed set-up man to pitch the eighth, depending on who is coming to bat. Switching pitchers to get a platoon advantage is one of the reasons for the relief pitcher explosion. However, the platoon advantage is rather small and this strategy is probably overdone. A lefty batter’s average is about 20 points lower vs. a lefty pitcher. Righty batters hit about 12 points higher vs. lefty pitchers. For OPS, it is 85 and 53. So in order to break even, a lefty pitcher has to face 38 percent left-handed batters, not including switch-hitters. Switch-batters have an OPS about six points higher vs. right-handed pitchers, so they are considered the same against either and not included. Most lefty non-closer relief pitchers face between 36 and 50 percent left-handed batters (not counting switch-hitters), which results in an edge of -1 to 17 OPS points. Righty pitchers need to face 62 percent righty batters to break even. Ten points of OPS is about 1.5 percent, which means a change in runs of about 3 percent. This would amount to one run for a typical 60-game reliever, or .15 on his earned run average. Righty relievers usually face between 69 and 72 percent righty batters. That means they have a platoon advantage of 50 points on average, so their overall platoon advantage is higher than lefties.
“Leverage” is a term Tom Tango and I invented independently. It is the average percent change in win probability expected given the inning, score, and runners on base. The average value is around 3.6 percent. The lefty relievers above had a leverage value of 3.9 vs. left-handed batters and 3.3 vs. right-handed batters. This indicates the situations vs. left were slightly more crucial than those against right. Whatever advantage there is to switching pitchers because of handedness is greatly reduced by the fact that the new pitcher will end up facing quite a few opposite-side batters.
Going back to 1946, the batting splits were a little bit bigger, about 60 OPS points for righties and 110 for lefties, randomness and real differences between batters attach a plus or minus value to those figures of 50 points for righties and 60 for lefties. Of the 1,121 players since 1946 with 3,000 or more at-bats, you would expect three batters to be beyond three standard deviations of the average split. There were actually six (see Table 7).
Table 7. Batters Beyond Three Standard Deviations of the Average L/R Split
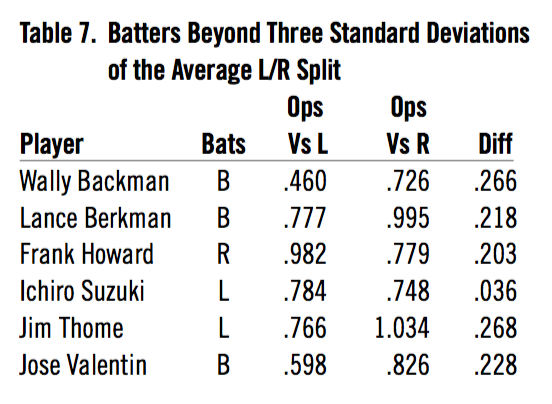
Backman just could not hit lefty pitchers batting right-handed. He actually tried batting lefty too late near the end of his career. Berkman, who was a lefty thrower, might have been better off not switching in the first place. Howard and Thome did much worse against same-side pitchers but they were still above average. They would be the two examples (in over 70 years) of a major advantage for a pitching change. Ichiro actually does better against lefties, which is rare. Valentin tried batting lefty against left-handers for a couple of years.
RELIEF USAGE
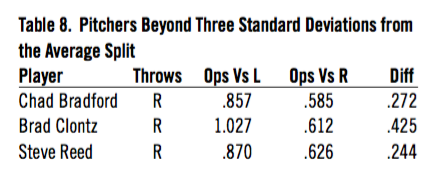
I found 180 pitchers since 1960 with at least 180 games, fewer than two innings per game, fewer than 25 percent finishes, and fewer than 25 percent saves for those finished. The split variation was 110 OPS points, plus or minus 60, for lefties and 60 OPS points, plus or minus 60, for righties. I found three beyond three standard deviations from the average split, where only one would be expected.
Table 8. Pitchers Beyond Three Standard Deviations from the Average Split
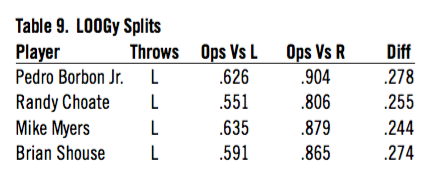
LOOGys (Lefty One-Out Guys) did not have enough appearances to generate a three-standard-deviation split but did generate a high difference. Randy Choate was the only pitcher to face over 60 percent lefties.
Table 9. LOOGy Splits
Closers seem to do pretty well when they pitch two days in a row. The table below shows earned-run average with zero to three days’ rest and ERA in the third of three consecutive games. The OPS figures are for the first and second inning in a game. Closers pitched a third inning about 30 percent of the time through 1990. In the next three decades, the chances of pitching a third inning (p3) after already pitching two fell to 10, then 5 and now 2 percent. Second-inning percentages (p2) also went down.
Table 10. ERA of Closers Relative to Days of Rest

A NEW STRATEGY
I developed a simulation between two identical teams, the only difference being the closer strategy. Rules for bringing in the closer for the first team, which mirror current practices, are:
- 60 percent in the ninth if ahead by 1 to 3 runs
- 30 percent in the ninth if ahead by 4 runs or tied in the top of the ninth
For the second:
- 60 percent of the time in the seventh or later if the leverage is 15 percent or higher
- 45 percent of the time in the eighth if tied or ahead by one run
- 30 percent of the time in the ninth if ahead by two runs
- 60 percent of the time if the ninth if tied or ahead by one run
Of course, a reliever can’t come in without warming up, so there is some guesswork involved in when to get him ready, which could result in the situation getting better or worse in the meantime.
This resulted in about 72 closer innings for the first team and 120 for the second team, a big increase. However, in 1971–80 there were 50 relievers who pitched that much or more, so it is not a huge amount. But the strategy also added three wins for the second team. In the past three years, only 13 players have been better than three wins a year over average using my linear-weight method described in Total Baseball and The ESPN Baseball Encyclopedia. They are Mike Trout and Joey Votto (7), Nolan Arenado and Clayton Kershaw (5), Jose Altuve, Jake Arrieta, Kris Bryant, John Donaldson, Paul Goldschmidt, Zack Greinke, Bryce Harper, Andrew Miller, Buster Posey, and Anthony Rizzo.
RELIEF METRICS
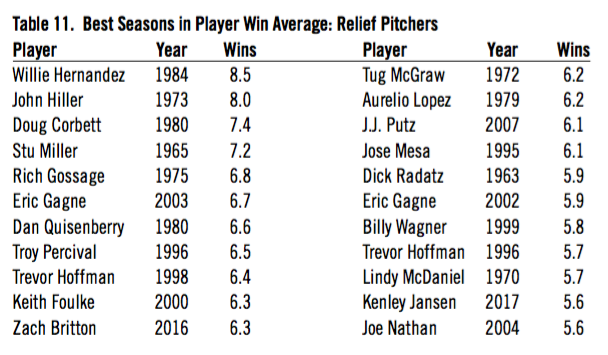
Player win average, invented by the Mills brothers in 1969, is a good way of measuring relief pitchers. You get charged with the change in team win probability before and after each event. Table 11 is a list of best seasons. Today’s closers don’t have much of a chance of getting an all-time ranking because they don’t pitch enough innings. Zach Britton and Kenley Jansen had fine years, but few innings.
Table 11. Best Seasons in Player Win Average: Relief Pitchers
The same method for lifetime leaders, in Table 12, shows Mariano Rivera in a class by himself.
Table 12. Lifetime Leaders in Player Win Average: Relief Pitchers

 The Hall of Fame currently has six relievers: Hoffman, Gossage, Wilhelm, Fingers, Eckersley, and Bruce Sutter, who appears a bit below this list at 14.5. He was elected in his 13th year of eligibility, with the invention of the split-fingered fastball being his major achievement. Smith had a 15-year run at the Hall, with a peak of about 50 percent of the vote. He was the career leader in saves when he retired, but with the new inflated totals, his star has diminished. He lost one third of his support in the final four years. Rivera, of course, is a shoo-in. Papelbon retired in 2016. Nathan did not play in 2017 and officially retired after the season. Both will probably suffer the fate of the others, who were all dropped their first year with less than 5 percent of the vote, except Wagner. He had a career ERA of 2.31, compared to Hoffman’s 2.87, but he did not play quite as long. He is getting support at the 10 percent level in three elections, so his chances are slim. Wagner‘s last year, 2010, was his best, but he decided to retire anyway.
Gossage made a strong case that you couldn’t compare relievers in his day with the current bunch because they hardly ever come in with runners on base or before the ninth inning, which of course was correct. He was able to convince some of the voters. His votes had maxed out at 44 percent after five years, but he made significant progress the next four years and went well over the limit to be elected in 2008. You can get a blown save by allowing a runner already on base when you enter the game to score, which of course is impossible if the bases are empty. The rules hadn’t changed, but the usage had. Table 13 is a chart for Gossage and Hoffman, showing the percent by inning entering, score, and bases empty.
Table 13. Gossage/Hoffman Comparison

You cannot compare save percentage for pitchers before 1990 to pitchers today. Most closers now are at around 90 percent, while before the ’90s it was 75 percent. The highest ranking pitcher in save percentage for those with 50 or more saves who pitched mostly before 1990 is Smith, who ranks 61st. However, he had 43 percent of his games in the later period. Mudcat Grant, at number 78, is next. Gossage ranks 190th out of 225 pitchers at 73 percent, but not only did he have to worry about allowing runners already on base to score, he finished games less frequently since he was often brought in early. Hoffman finished 83 percent of his games, Gossage only 71 percent, which might have reduced his saves by 100. Middle relievers have lousy save percentages, not because they blow a lot of saves, but because they seldom get a chance at a successful one, so you have to put closers in a different category from other relievers. In 2017, team save leaders had an 87save percentage, while the save percentage for all other relievers was only 44.
Most statistical measures of relief pitching are flawed. Saves are much too easy. Holds only count if you start out ahead. You don’t have to finish the inning to get an inherited runner saved. So if you enter with two runners on base, walk a guy and leave, you get two inherited runners prevented from scoring. Looking at the best relief games in 2017 (0.2 wins or more using player win averages, 552 games), there were 232 saves, 98 wins, 89 holds, 1 loss, and 132 with nothing. Most of the unrewarded games were long stints with the score tied. Chris Devenski of the Astros had the best. He came on in the eighth inning on April 5 in a tie game against the Mariners and pitched four scoreless innings, through the 11th, worth .57 wins. The Astros won the game in the 13th.
Another flawed stat that applies to relievers and starters is outs per balls in play (OPBIP). There are five things a pitcher can do to lower the batter in the hitting spectrum. If you turn a homer into an extra-base hit, your OPBIP goes up. If you turn an extra-base hit into a single, there is no effect. If you turn a single into an out, it goes down. If you turn an out into a strikeout, it goes up again. If you eliminate a walk, there is no effect again. We have good data on hard, medium, and easy batted balls back to 2003. Hard% is the percentage of hard-hit balls. A 17 percent increase in hard-hit balls led to a doubling of ERA in these data for starters from 2016, while OPBIP only went down 7 percent.
Table 14. OBPIP and Hard % Relative to ERA
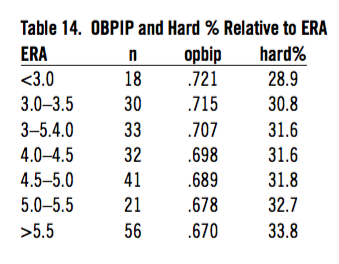
A hard-hit grounder is turned into an out only 48 percent of the time, a medium grounder 77 percent of the time. For fly balls, it’s 51 percent for hard, 92 for medium. So the idea that a pitcher has no control over outs for balls in play is wrong. What is right is that OPBIP is not a good measure of pitching skill.
Relievers get an unfair break on ERA since the starter gets charged with runners he leaves on base, even though the reliever is partly responsible. In 2017, starters had an era of 4.49 and relievers had 4.15. Transferring 400 earned runs from start to relief would make them both 4.36. Starters left 2,752 baserunners to the relievers, of which 921 scored, all charged to the starters. However, the relievers were responsible for over half the runs, which would give them 513 more, making their ERA slightly higher than that of the starters. The scoring probabilities vary a bit from year to year. For 2017 the percentages were 38, 60, and 85 from first, second, and third with none out; 25, 40, and 65 with one out; and 12, 22, and 26 with 2 outs. Garry Gillette and I wrote a paper on what we called quality reliefs in which we recommended fractional runs be awarded. The first pitcher would be charged with the scoring potential when he left and the reliever would get what actually happened minus what was charged to the starter. This meant the reliever could actually get negative runs allowed. If he came in with the bases loaded and none out and did not allow a run, the starter would be charged 1.83 runs and the reliever would get minus 1.83. A quality relief was when your innings pitched were double your runs allowed using the fractional method.
I have a little aside that applies to Hoyt Wilhelm, one of the early great relievers. I noticed years ago that he had a high number of unearned runs charged to him. My hypothesis was that he benefited from passed balls, which led to unearned runs. I always thought that the knuckler should be charged with a wild pitch most of the time, since it is really his fault. Thanks to Retrosheet, we now have play by play of every game back into the 1940s, so I was able to calculate the passed-ball rate for nine career knuckleball pitchers. The overall average for passed balls is two-tenths of one percent per plate appearance. Most knuckleballers are about six times that, but Wilhelm was 15 times higher. If you wanted to find out what team Hoyt was on, all you had to do was look at the team with the most passed balls. The nine pitchers as a unit average about 87 percent of runs earned, compared to the normal 91 percent. This resulted in a lowering of ERA by about .18. Wilhelm had only 82 percent of his runs earned, amounting to a double benefit. Wild pitch rates for knucklers were about 25 percent higher than average.
MAKING THE MAJORS
If you want to make the major leagues, being a left-handed pitcher is a big advantage. Although only 10 percent of the population is left-handed, 28 percent of pitchers are lefties. Thus your odds are three and a half times better if you are lefty. So what you do is line up two lefties to be your parents. Two lefties have about 26 percent lefty kids, so you have gained another factor of 2.6. Then arrange to be born on September 1. Greg Spira discovered years ago that more players were born in certain months than others. It turns out that there is a straight line relationship, with August being the highest, then around the calendar to July, which is the lowest. If you look at players born since 1960 in the USA, 572 were born in August and only 349 in July. I attributed that to being the oldest player on your Little League team. Little League used to determine players’ age as of July 31. It changed that date to April 30 in 2006 and now it is August 31, so you have to keep that in mind. This gives you another factor of 1.4, making the total 12.7 times more likely if you play your cards right.
CONCLUSIONS
So, what do we conclude from all this? Was the revolution started by Eckersley and LaRussa in 1988 an effective one? I believe the current relief strategy is not productive because the closer is used too little and at the wrong times. There are too many pitchers per team, limiting the moves a manager can make in other areas. There is too much emphasis on left-right matchups, which give only a small advantage. It seems that getting the closer a lot of easy saves is more important than winning games, so a statistic is actually driving strategy. The manager makes many decisions that can be disputed. If everybody handles his closer the same way, then that is one fewer decision to be made that can be second-guessed. Perhaps that is the reason we are where we are today. I wonder if anyone will try to buck the trend. I hope they do.
PETE PALMER is the co-author with John Thorn of “The Hidden Game of Baseball” and co-editor with Gary Gillette of “The Barnes and Noble ESPN Baseball Encyclopedia” (five editions). Pete worked as a consultant to Sports Information Center, the official statisticians for the American League 1976–87. Pete introduced on-base average as an official statistic for the American League in 1979 and invented on-base plus slugging (OPS), now universally used as a good measure of batting strength. Among his many accolades, he won the SABR Bob Davids Award in 1989 and was selected as a charter member of the Henry Chadwick Award.
Sources
Gillette, Gary. Pete Palmer. The ESPN Baseball Encyclopedia, Fifth Edition. New York: Sterling, 2008.
Blau, Cliff, “Roster Limits,” Original Baseball Research, http://cliffordblau.000webhostapp.com/rosters.htm
Mills, Eldon. Harlan Mills. “Player Win Averages.” Self-published pamphlet, 1970.
Milsom, Keith “What is the chance of having a left handed child?” Anything Left Handed. http://www.anythingleft-handed.co.uk/lefty-probability.html.
Posnanski, Joe. “Gossage states case against modern closers.” MLB.com. February 19, 2017. http://m.mlb.com/news/article/216442236/goose-gossage-states-case-vs-modern-closers/.
Smith, David W. “The Myth of the Closer.” Presentation at SABR 46, 2016. http://retrosheet.org/Research/SmithD/MythOfTheCloser.pdf.
Thorn, John. Pete Palmer. Michael Gershman. Total Baseball: The Official Encyclopedia of Major League Baseball. New York: Total Sports Publishing, 2001.