Strategic Pitch Location: The Role of Two-Pitch Sequences in Pitching Success
This article was written by John Z. Clay
This article was published in Spring 2023 Baseball Research Journal
On the surface, baseball does not appear overly complex. Not only is the sport easy enough for millions of children to understand and play in their Little League games, its charming simplicity is one of the many reasons it was adopted as “America’s Pastime.” However, as both the interest and capital involved in professional baseball have drastically in creased, so too have the measures taken by teams to ensure their victories. Since the dawn of sabermetrics, our vision of baseball has become both much clearer and cloudier: although analysis does reveal many in sights, one of them is that baseball is an intricate system that we have only begun to understand.
An important aspect of the game’s strategy is the pitch-by-pitch decision making taking place through out a plate appearance. The nature of this matchup between the pitcher-catcher duo and a batter is sequential. The pitcher acts and is met with a reaction by the batter, a process that iterates until the batter either fails or succeeds to reach base. There are two domains of behavior sequences to consider when analyzing the pitcher vs. batter matchup: the sequential behavior of the pitcher, and the sequential behavior of the batter. I refer to the former, the sequence of strategic decisions that a pitcher makes throughout an at-bat, as sequential pitch behavior. A pitcher’s sequential pitch behavior can be divided into several subfactors, each concerned with one of the variables over which the pitcher has control. For example, a pitcher may vary the type of pitch thrown (e.g., fastball vs. breaking pitch), the velocity at which it is thrown, or the in tended target area of the strike zone. In this paper, I will exclusively discuss location sequence behavior— how pitchers use strategic decisions about locations within the strike zone to retire batters.
Any behavior is closely linked to previous behaviors, and to fully understand an action it may be important to consider the influence of the previous action(s). A pitcher’s sequential pitch behavior is heavily influenced by their history, and a key factor in deter mining future pitching behavior is the success of previous behaviors within a certain time period such as a single game or a series of previous at-bats against a particular batter. The more success a previous behavior brought a pitcher within a time period, the more likely he will be to use it in certain future situations. This is known in psychology as conditioning. Due to individual differences in both brain functioning and pitching strategies, it is difficult to determine the correct number of occurrences of previous behaviors (a.k.a. the length of the behavior sequence) to consider when quantifying the influences that led to the cur rent behavior. In this paper I will discuss two-pitch sequences, particularly two-pitch location sequence behavior—a behavior sequence containing the strike zone location that a pitch was thrown in, and the location that the following pitch was thrown in.
In the sections below, pitchers will be grouped together according to similarities in their two-pitch location sequence behavior to analyze how these behavior sequences are related to pitching success. The philosophy behind my approach is not unique—grouping players based on the similarities they show in relevant behaviors has been successfully implemented by the titans of sabermetrics. For example, Bill James used his Similarity Scores to define the difference be tween the careers of two players, a method he described in depth in the 1994 book Politics of Glory.1 Similarly, Nate Silver’s PECOTA projection system works on the assumption that players who show similar behavior patterns will, on average, have a comparable amount of success.2 Within this well-explored research philosophy, my approach is unique due to the use of machine learning techniques to analyze specific pitch-by-pitch behavior.
RESEARCH OVERVIEW
The present paper is concerned with the strategic decision-making process that takes place between a pitcher and a batter as they face off throughout an at-bat. I analyze two-pitch sequences of the strike zone locations that pitchers target to investigate how location sequence behavior across a full season relates to performance metrics (batting average against, slugging percentage, etc.).
I present a statistical model to quantify the two-pitch location sequence behavior of pitchers, and subsequently partition them by the similarities they show in their sequential behaviors. Once pitchers are grouped, I test for differences across a range of performance metrics. All topics are discussed in further depth in the following sections.
I am unaware of any other study that does an analysis similar to what is described below. A recent study by Arnav Prasad, presented at the MIT Sloan sports analytics conference, conducted a novel analysis of pitch sequencing using directed graph embeddings to quantify pitcher patterns, after which they group pitcher based on these patterns.3 However, the author did not associate the pitcher groups with performance metrics as the present study does.
METHOD
Pitchers
Pitch-by-pitch data were collected for every pitcher in the American League who threw more than 1,450 pitches in the 2019 MLB season. The pitch count cutoff was set around the edge of less-often-used starting rotation pitchers and often-used bullpen pitchers. Eighty-seven pitchers were included in the analysis (pitch count range=1,466-5,228, M = 2,588.71, SD = 863.14). This was a convenience sample. All data were acquired through Baseball Savant’s Statcast database on MLB.com.4
Data Analysis
Data analysis took the following path: First, each pitcher was defined by a transition matrix derived from their two-pitch location sequence behaviors with a discrete time Markov chain (DTMC). Second, pitchers were partitioned according to similarities in these behaviors using three different cluster analysis algorithms. Lastly, Analyses of Variance (ANOVAs) were conducted to test for differences in various performance metrics be tween the pitcher groups created by the cluster analysis. (The method described here is similar to that of Rahman et al., 2018.5)
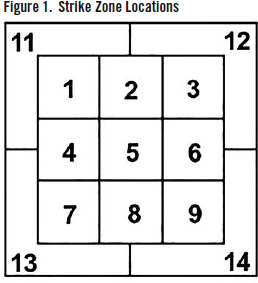
Markov chains quantify behavioral sequences by accounting for the probability that one state transitions to another state. DTMC’s rely on the assumption that the transition to the next state is solely dependent on the previous state—this is otherwise known as the Markov property. The states in a Markov chain are context dependent. In the current study, the states that pitchers are transitioning between are the strike zone location that the previous pitch was thrown in, and the location of the following pitch. Strike zone locations were coded by the Statcast database at Baseball Savant online. See Figure 1 for a visualization. (Please note that the Statcast database does not include a tenth zone for undisclosed reasons.)
Pitcher two-pitch location sequence behavior was then defined by a transition matrix containing the probability for each possible state-to-state transition: i.e., the probability of transitioning from location one back to location one, location one to location two, and so on through to location 14 to location 13, and lastly location 14 to location 14. The probability that a pitcher transitioned from location one to location two was equal to the number of times he followed a pitch in location one with a pitch in location two divided by the total number of times he threw a pitch in location one. I added a delimiting state of begin at-bat so that the Markov chain would not attribute the first pitch of an at-bat to the last pitch of the previous at-bat. With 13 strike zone location states and one delimiting state, pitcher behavior was defined across their prob abilities for all 196 possible state-to-state transitions in a 14 x 14 transition matrix.
After pitchers were defined by their two-pitch location sequence behaviors, they were partitioned with an extended cluster analysis approach. Pitchers were clustered through three different cluster analysis algorithms—k-means, hierarchical, and spectral—after which the variation of information method was used to determine the single best clustering. I will avoid dis cussing cluster analysis in much depth. (Please see Kettenring’s 2006 work for a general overview of the approach.6 For an example of cluster analysis in baseball research, see Dvorocsik, Sarris, and Camp’s paper in the spring 2020 issue of the Baseball Research Journal.7)
Traditional k-means clustering employs the use of an elbow plot to determine the number of groups [k] that best fits the data. However, hierarchical and spectral algorithms use other methods. In this method, I use the elbow plot to suggest a range of clusterings from each of the three algorithms. The elbow plot suggested a k range of three to seven, creating fifteen different solutions for grouping pitchers. To determine the best solution, the variation of information technique was used to compare each possible pairing of clusterings and choose the most efficient algorithm/grouping.8
RESULTS
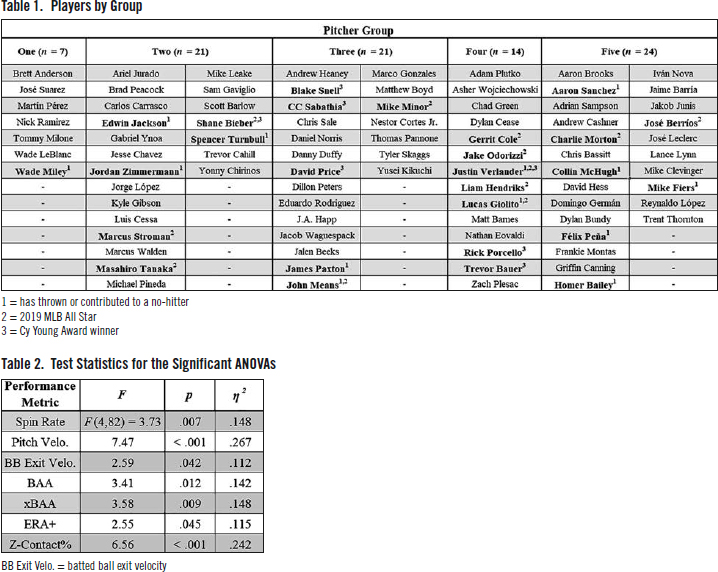
Pitchers were first defined by the 14 x 14 transition matrix containing the probabilities they showed for each possible state transition, after which they were partitioned according to their similarities in the 196 transition variables. Subsequent analyses suggested that the most efficient algorithm was k-means clustering with five groups. See Table 1 for the members of each of the five created pitcher groups.
A series of one-way between-subjects ANOVAs were conducted to test for differences in performance metrics between the created pitcher groups. A total of nineteen ANOVAs were performed. To be economic, I will report the specific statistics for only the significant tests. The ANOVAs each met the assumptions for homogeneity of variance, and post hoc comparison p values were adjusted using the Bonferroni correction to control for false positives.
There were no significant differences found be tween the five pitcher groups for the following performance metrics: Isolated Power (ISO), Batting Average on Balls In Play (BABIP), Slugging Percentage (SLG), Weighted On-base Average (wOBA), Expected Weighted On-base Average (xwOBA), Walks and Hits Per Inning Pitched (WHIP), O-Swing%, O-Contact%, Z-Swing%, hits, total pitches, and at-bats.
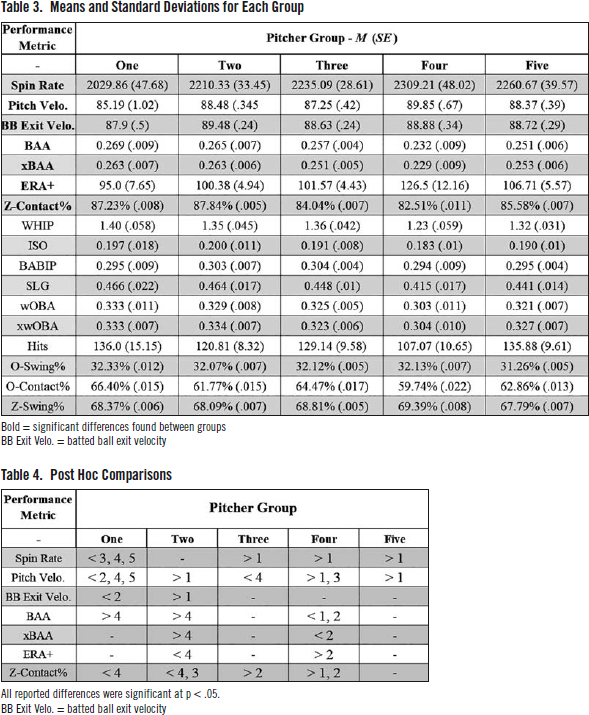
Significant differences were found between pitcher groups in seven performance metrics: spin rate, pitch velocity, batted ball exit velocity, surrendered batting average against (BAA), expected batting average against (xBAA), adjusted earned run average [ERA + ], and Z-Contact%. For all significant test statistics, see Table 2. For the means and standard deviations of each group in each performance metric, see Table 3. See the following paragraphs for the post hoc comparisons, and Table 4 for a visualization.
Tukey’s post hoc analysis found that the average spin rate of Group One was significantly lower than: Group Three, p = .04, Four, p =.003, and Five, p = 0.012. Group One also showed significantly lower batted ball exit velocity than Group Two, p=.037. Please refer to Table 3 for the means of each group.
Pitcher Group One had significantly lower average pitch velocity than groups: Two, p = .003, Four, p <.001, and Five, p =.004. Additionally, Group Four showed significantly higher average pitch velocity than Group Three, p = .003.
Group Four exhibited significantly lower average BAA compared to Groups One, p=.048, and Two, p = .011. Group Four also showed significantly lower xBAA than Group Two, p = 005. Additionally, Group Four had significantly higher ERA+ than pitcher Group Two, p = .044.
Lastly, Group Four showed the lowest overall Z-Contact% and significantly lower average Z-Contact% than Groups One (p = .029) and Two (p<.001). Additionally, Group Three showed significantly lower Z-Contact% than Group Two (p=.004).
DISCUSSION
Pitchers were defined by their two-pitch location sequence behaviors and subsequently grouped together according to their similarities. Upon their grouping, a range of ANOVAs were performed to test for differences in performance metrics. Significant differences were found in six of the ANOVAs, and post hoc comparisons found that many of the significant effects included pitcher Groups One or Four. It must be highlighted that testing for significance is a methodology that was devised for non-baseball phenomena, and differences in baseball metrics that do not reach significance may still be highly relevant to the game. In this paper I use significance to highlight the metrics in which the groups showed the largest differences, and to set an informal cut-off for which differences to explore in further depth below.
Many of the performance metrics did not show significant differences between groups. This was expected, as pitchers were classified on a granular level. Given the complexity of baseball strategy, it is unlikely that these low level behaviors would be a major contributor to most metrics of success. Additionally, many of the metrics in which differences were tested for are dependent on several other metrics. For example, the calculation for expected weighted on-base average (xwOBA) is especially intricate. As the complexity of performance metrics increases, granular behaviors such as the ones studied presently are likely to have their effects diluted, hindering any significance that may have been revealed in a less complex metric.
Tests of differences between total pitches and at-bats were included to ensure that no group differed significantly in use. Significant differences were not found between the groups for either variable, suggesting the effects that were found were not a result of pitch level sample size differences.
The ANOVAs did reveal significant differences be tween pitcher groups in six performance metrics: spin rate, pitch velocity, batted ball exit velocity, BAA, xBAA, and ERA+. Each test offers insight into how two-pitch location sequence behaviors may be related to pitching success. Differences in spin rate and pitch velocity suggest that pitching mechanics are related to how pitchers transition between strike zone locations. Additionally, significant differences in average batted ball exit velocity may suggest that certain location sequence behavior patterns (i.e., the ones shown by Group Two) are less effective than other patterns in limiting batter contact.
BAA, xBAA, ERA +, and batted ball exit velocity are each important performance metrics. The significant differences found between groups in these metrics suggests that two-pitch location sequence behavior may be directly related to metrics indicative of high performance. It must be noted that pitching behavior was not manipulated, and this model and accompanying analyses cannot be used to make direct causal claims. However, the differences found suggest that successful pitchers on average display different two-pitch location sequence behaviors than pitchers with lower performance. It may be that players who engage in some sequence behavior patterns are also engaging in other actions that are responsible for their success.
It should be noted that pitch location sequence behavior is likely related to the pitch types and movements that pitchers use. Many pitchers favor a specific pitch when the count is favorable for recording an out. For example, pitchers who rely on fastballs are likely to pitch in the higher third of the zone in two strike counts to strike batters out, while pitchers with a re fined sinker may utilize the bottom third of the zone more often.
I will now focus on Groups One and Four in more depth.
Pitcher Group One
Group One performed poorly in relation to the other groups (Tables 1-4). Out of sixty-eight career seasons, members of Group One have appeared in two All-Star Games (2.9%), have thrown one career no-hitter (Wade Miley, 2021), and have received zero Cy Young Awards. They showed significantly lower spin rate in relation to three other groups, lower pitch velocity than three other groups, and a higher batting average against than Group Four. Further analysis showed that of the five groups, Group One showed the lowest probability to use 65 out of the 196 (33.16%) possible state transitions. This suggests that there were many two-pitch location sequence behaviors that the pitchers in Group One very rarely used, likely leaving their pitching patterns more predictable than the other groups.
Pitcher Group Four
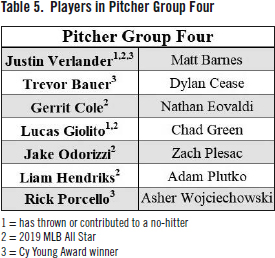
Opposite to Group One was Group Four, who showed very high performance compared to the rest of the sample (see Table 5). These pitchers have been elected to 21 All-Star Games out of 124 cumulative career seasons (16.9%). Additionally, 5 out of the 11 pitchers from the 2019 MLB All-Star Game included in this sample belonged to this group. Group Four boasts three Cy Young Awards (Justin Verlander, 2011 and 2019; Rick Porcello, 2016), two future Cy Young Awards (Trevor Bauer, 2020; Justin Verlander, 2022), and two future Reliever of the Year Awards (Liam Hendriks, 2020 and 2021). This group has also thrown four career no-hitters, including two of the previous three at the time of this writing (Justin Verlander, September 1, 2019; Lucas Giolito, August 25, 2020). Group Four has also been well compensated for their success. In 2019, Gerrit Cole signed the largest contract for a pitcher in MLB history ($324 million), and his previous team mate Justin Verlander’s 2023-4 contract is currently tied (Max Scherzer) for the highest average annual value (AAV) in MLB history at $43.3 million.
The significant differences found through the ANOVAs, along with the distribution of accolades would suggest that the two-pitch location sequence behaviors that pitchers were grouped by are related to pitching success, and perhaps played a role in how pitchers were able to achieve their success. However, the number of transition probabilities offers some challenges when drawing conclusions on how the groups acted differently from each other. With 196 variables to consider, a comprehensive review would be arduous to write, and even more painful to read. This clustering method offers many options for gathering insights, and I will discuss three here: I will address two specific insights that may be drawn, and then end with a case study.
First, Group Four showed the highest probability for 61 out of the 196 (31.12%) possible state transitions, the highest of the groups. After Group Four, Group One showed the highest probability for the second highest number of transitions (41/196; 20.91%). This suggests that pitchers in Group Four varied their two-pitch location sequence behaviors more than the other groups, which may have made their behavior less predictable to the batter. Similar trends arise when considering how often each group used each two-pitch sequence. Group One showed a higher probability to transition from lo cation five to the end of the at-bat (43.15%) than any other group’s probability of making any two-pitch sequence. The highest two-pitch sequence probability for the other groups were as follows: Group Two (41.43%), Group Three (38.52%), Group Four (36.20%), and Group Five (37.56%). Thus, Group Four’s highest prob ability for a single transition (i.e., zone location 1 to location 5) was the lowest out of the groups (by a slight margin). In other words, Group Four showed a more equal distribution of two-pitch transitions, and did not rely heavily on any specific sequences.
A closer look at the strike zone locations that pitcher groups most often ended their at-bats with offers additional insight into how Group Four was different from the others. Of the 13 possible transitions of strike zone location that could end an at-bat, Group Four placed last (out of the five groups) in ten, second to last in one, and first in the other two. Not only were they much more likely to end their at-bats by attacking strike zone locations seven and 13 when compared to the other groups, they were much less likely to end their at-bats in the other locations. Considered in light of the previous findings, these results suggest that while the pitchers in Group Four vary their two-pitch location sequence behavior more than the other groups, they show a higher tendency to focus on a small number of locations towards the end of an at-bat.
CASE STUDY
Justin Verlander’s Third Career No-Hitter
All results presented thus far were concerned with data over a full year. I will end with a brief case study of how this model may be used to analyze smaller sections of data: a single game. On September 1, 2019, in Toronto, Ontario, Canada, Justin Verlander threw his third career no-hitter. Upon analyzing his two-pitch location sequence behaviors, three trends are immediately apparent. Verlander threw 120 pitches that day, and with 28 added begin at-bat transition variables he showed 148 state transitions. Verlander’s 148 two-pitch sequences were distributed across 83 unique transitions. Notably, 52 out of the 83 (62.65%) two-pitch sequences were only used once, and no sequence was used more than five times. Verlander did very well to avoid pitching predictably, which likely contributed to the Blue Jays’ struggles that night.
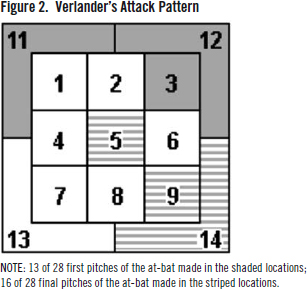
However, despite this tactical variance, there were certain situations in which Verlander opted to continue previous behavior trends. Out of the 28 batters faced, the first pitch to 13 of them (46.42%) were in strike zone locations three (four first pitches; three to right handed batters and one to left handed batters), 11 (four first pitches; two to both RHB and LHB), or 12 (five first pitches; two to RHB and three to LHB). Addition ally, 16 of the 28 (57.14%) plate appearances ended with pitches in locations five (five PA endings; three to RHB and two to LHB), nine (six PA endings; one to RHB and five to LHB), or 14 (five PA endings; four to RHB and one to LHB). See Figure 2 for a visualization-shaded locations were often attacked by Verlander to begin at-bats, while striped locations ac counted for over half of the recorded outs.
During his no-hitter on September 1, 2019, Justin Verlander showed situational variance-during certain stages of an at-bat he was tactically unpredictable, using many different unique state transitions through out the game. However, during other stages of the game he remained resolute and continued the behaviors he had success with earlier, e.g., towards the beginning and end of at-bats. These findings continue the trends found in the yearly data-the pitchers in the most successful group showed high variance in their two-pitch location sequence behaviors in some situations, but constrained their behavior in others.
Limitations and Future Directions
The present study had several limitations. First, I am not as much working in the realm of Big Data as I am in quasi-Big Data. Baseball offers a vast wealth of data to pull from, and only analyzing one variable (lo cation) for one year (2019) does not offer as much insight as could be gleaned from a larger data set. Thus, it cannot be assumed that the pitching behaviors observed here are representative of behaviors dis played by pitchers in other years. Additionally, the year from which the data were collected may be slightly confounding. The 2019 MLB season was marred by a “juiced ball” controversy in which a vocal portion of players and fans believed that the league-issued base balls were doctored to increase the frequency of home runs. Regardless of whether the baseballs had been tampered with, the belief that they were likely had some influence on pitching behaviors.
The relatively large number of ANOVAs that were conducted increased the risk of encountering both Type I and Type II errors, though the Bonferonni correction was used for pairwise comparisons. More data and follow-up tests are required to test the robustness of the revealed effects.
Lastly, Markov models are drastically simplified abstractions of complex pitching behaviors, as they only consider the transition between two states. Future studies should consider employing more robust methods, such as neural networks or graph network analysis. However, due to the exploratory nature of the present study I opted to use a DTMC for its tractability and ease of explanation.
CONCLUSIONS
The present study presented a model for grouping pitchers by their pitch-by-pitch behavior, and results suggested that certain recorded behaviors may con tribute to pitching success. Pitchers in the most successful group showed situational variance, in which they pitched stochastically in some situations and more predictably in others. Trends were revealed at both year-level data and through a single game case study.
JOHN Z. CLAY is research assistant at the University of Texas at Austin. He is a member of the System Integration and Design Informatics Laboratory, where he conducts research on human creativity, mindfulness, engineering systems thinking and generative design. Mr. Clay has a passion for baseball analytics and encourages interested parties to contact him via email at john.za.clay@gmail.com.
Notes
1. Bill James, The Politics of Glory: How Baseball’s Hall of Fame Really Works (Macmillan, 1994), 86-106.
2. Nate Silver, The Signal and the Noise: Why So Many Predictions Fail— But Some Don’t (Penguin, 2012), 74-107. For a description of the approach PECOTA takes see chapter three.
3. Arnav Prasad, “Decoding MLB Pitch Sequencing Strategies via Directed Graph Embeddings,” 15th Annual MIT SLOAN Sports Analytics Conference, 2021.
4. https://baseballsavant.mlb.com.
5. Molla H. Rahman, Michael Gashler, Charles Xie, and Zhenghui Sha, “Automatic clustering of sequential design behaviors,” International Design Engineering Technical Conferences and Computers and Information in Engineering Conference, Vol. 51739, American Society of Mechanical Engineers, 2018.
6. Jon R. Kettenring, “The practice of cluster analysis,” Journal of Classification 23, no. 1 (2006) 3-30.
7. Gregory Dvorocsik, Eno Sarris, and Joseph Camp, “Using Clustering to Find Pitch Subtypes and Effective Pairings,” Baseball Research Journal, Spring 2020.
8. Marina Meilâ, “Comparing clusterings—an information based distance,” Journal of Multivariate Analysis 98, no. 5 (2007): 873-95.


