

Using Clustering to Find Pitch Subtypes and Effective Pairings
This article was written by Joseph Camp - Eno Sarris - Gregory Dvorocsik
This article was published in Spring 2020 Baseball Research Journal
Introduction
 Using Statcast data, it is now possible to compare individual pitches across baseball based on characteristics like movement, velocity, and spin rate that become obvious and meaningful even in a single outing. Various research has used those physical characteristics to define optimal pitches.
However, to be effective even an elite pitch must be mixed with less optimal ones, especially for starting pitchers. Therefore, it is imperative to study the interactions between pitches to fully understand the best shape a particular pitch should have and whether pairing a pitch with others improves or decreases effectiveness. Here, we define pairing as when both pitches are present in a pitcher’s arsenal.
This work has potential impact on pitch design, player development, and scouting. For the former, teams could focus efforts on teaching young pitchers new subtypes that have specific shapes according to the characteristics of the best pitches already thrown by that pitcher. For the latter, with very little in-game data, teams could seek to add pitchers that already possess effective pairings or avoid pitchers with ineffective pairings.
- Video: Watch a replay of Gregory, Eno, and Joe’s presentation at the 2020 SABR Analytics Conference (YouTube)
- Audio: Download the MP3 file to listen to this presentation
Background
Pitch design has advanced to the point that tinkering in a lab with high-speed, high-resolution cameras is commonplace to potentially modify the ideal shape of a given pitch. These systems capture the way in which a pitch leaves the fingers, having potential impact on the spin axis, spin rate, velocity, and resulting horizontal and vertical movement. With such fine precision, the traditional classes of pitches might be called into question since sub-classes of pitch types could be forming based on a number of minor alterations to the grip, release point, and other pitching mechanics. We could potentially rely on existing works that have studied the following:
(i) classifying pitches in an unsupervised manner pre- and post-Statcast1
(ii) the characteristics of an effective changeup2
(iii) the optimal distribution of pitches3
(iv) a survey of publicly available data and existing methods to evaluate pitch types and performance4.
However, these works have not evaluated how one pitch type or subtype can affect another when a pitcher throws multiple pitches. We seek to understand whether a particular pitch—with its physical characteristics of spin rate, velocity, and break—can have better or worse outcomes when a second pitch of different physical characteristics is paired with it.
In this paper, we use clustering within each of the most common pitch classifications as determined by Statcast to find subtypes of pitches and evaluate their performance when paired with all other subtypes to determine if performance can increase or decrease by these pairings. Looking at the 9 most common MLB pitch types for left-handed and right-handed pitchers across all pitches thrown in the 2016 and 2017 seasons, we find the total number of subtypes that result to be 30 for both types of pitchers. (Levels of subtypes differed between left-handers and right-hander.) We consider four performance metrics:
- swinging strike percentage (whiff rate)
- exit velocity (how hard the ball was hit)
- percentage of time the launch angle is below 0 percent (ground ball rate)
- percentage of time the launch angle is above 40 percent (pop-up rate).
We created a reference for each of these subtypes by studying the average performance of each of these 30 pitch subtypes for each handedness. We found that even within the same Statcast pitch types, there are sizable differences in effectiveness for these four performance metrics across pitch subtypes.
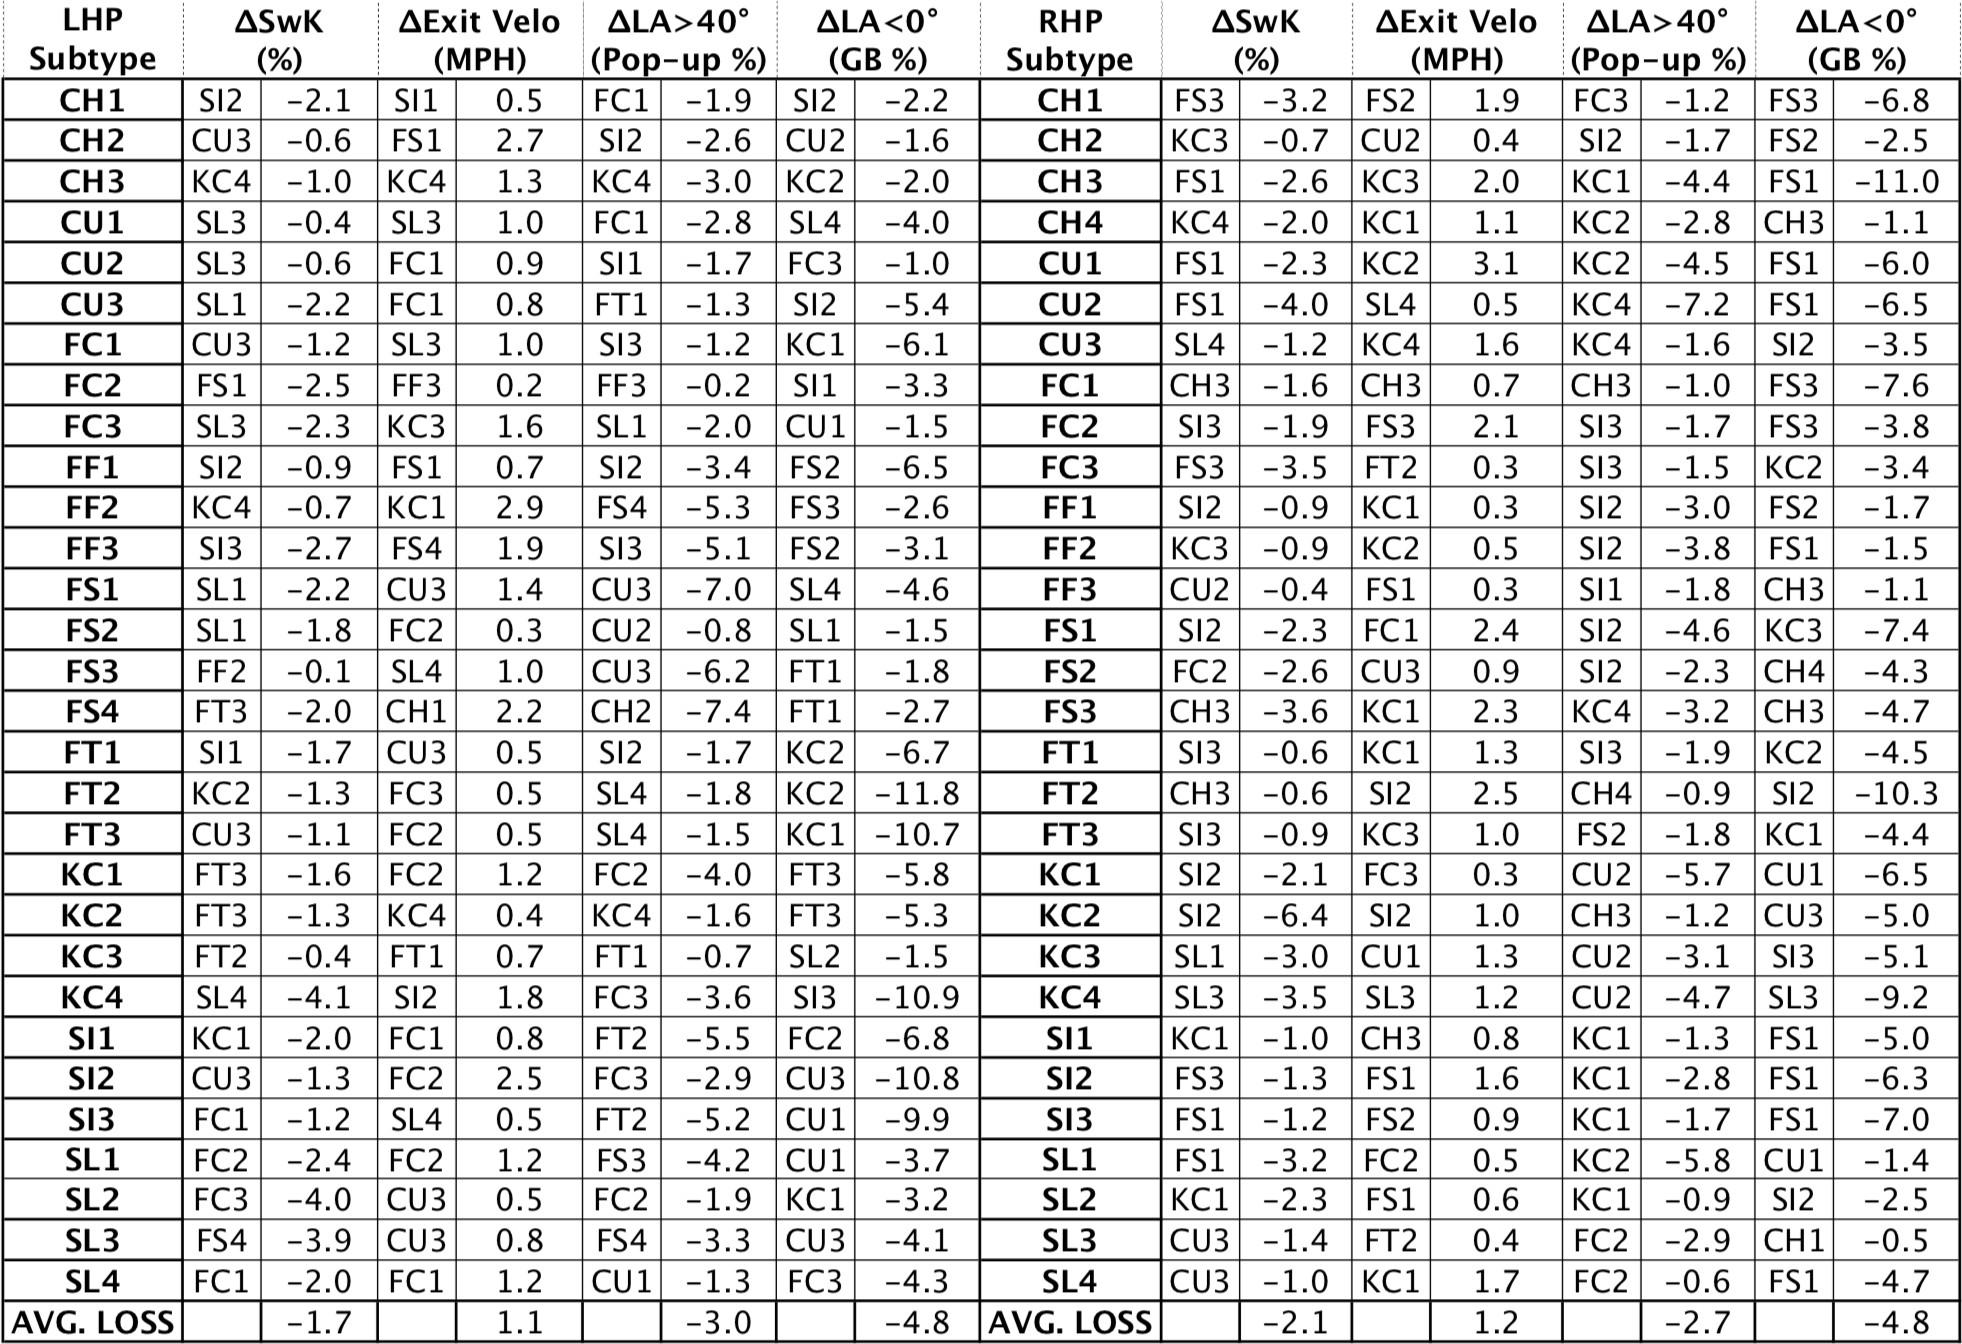
Then, we compared this reference performance against the performance of that same reference subtype for all occurrences where a pitcher throws that second subtype and created lists ordered according to the change in each performance metric. Hence, we found the highest and lowest performing subtype pair for whiff, pop-up, and ground ball rates and exit velocity, calling these the best and worst subtype pairings for each reference subtype and performance metric. For example, looking at CH1 of LHP in the top left corner of Table 2 and Table 3, the highest positive difference in swinging strike rate for CH1 was when FC3 was paired with it, and the greatest negative difference in swinging strike rate for CH1 was when SI2 was paired with it. After repeating this for all reference subtypes and all possible subtype pairs across all performance metrics, we found that each of these best and worst pairing subtypes are typically distinct across these performance metrics for a given reference subtype. When we consider the average gains across each of these metrics, we see an improvement of 1.6 percent swinging strike percentage, 3.8 percent pop-up rate, 4.2 percent ground ball rate, and a reduction of 1.2 MPH on exit velocity. Conversely, by performing the same process for finding the worst pairing subtypes, we see reductions in the swinging strike rate by 1.9, pop-up rate by 2.9, ground ball rate by 4.8, and increase the exit velocity by 1.2 MPH.
Pitch Subtype Classification Using Statcast-Driven K-Means Clustering
In order to immediately broadcast pitch type across various platforms from in-stadium scoreboards to the MLB AtBat application, Major League Baseball classifies each pitch based on Statcast metrics. While we cannot know the exact algorithms used to perform the classification, based on per pitch data from 2016 and 2017, we know there are 9 predominant pitch types for both right-handed and left-handed pitchers:
- four-seam fastball (FF),
- two-seam fastball (FT)
- cutter (FC)
- splitter (FS)
- sinker (SI)
- curveball (CU)
- knuckle curve (KC)
- slider (SL), and
- changeup (CH).
Since these classifications are broad in nature, there are differences in horizontal and vertical movement, velocity, and spin rate, even within the same class of pitch. Movement of pitches is relative to a gyroball, which is a ball spinning in a spiral shape (like a football). A gyroball-shaped pitch is considered the theoretical zero/zero from which other pitches are defined. Unlike a perfect gyroball, almost all pitches exhibit some form of magnus effect—the forces that deflect the ball in a particular direction based on the velocity, spin, and spin axis. To understand the degree to which these four physical characteristics differ within each class, we use clustering within a four-dimensional space as represented by these four physical parameters:
- Horizontal Movement: From the catcher’s viewpoint and with respect to the movement of a gyroball, a negative value would move toward a right-handed hitter, whereas a positive value would move toward a left-handed hitter.
- Vertical Movement: From the catcher’s viewpoint and as compared to the movement of a gyroball, a negative value would move downward, whereas a positive value would rise.
- Velocity: The miles per hour that a pitch travels as measured out of the pitcher’s
- Spin Rate: The revolutions per minute along the spin axis of a particular pitch.
We use K-means clustering to form the clusters, meaning we partition n observations into the k clusters where there exist an n of the number of pitches thrown in 2016 and 2017 from a particular handedness from a particular MLB pitch classification. The k is determined via the elbow method where with each of the increasing k values, we evaluate the aggregate Within-Cluster-Sum-of-Squares (WCSS) error between all the data points and the k cluster centroids. In particular, over all k for a given MLB pitch type, when the WCSS value begins to flatten, an elbow is created in the curve, signaling the reduction of error by increasing the number of clusters has lessened significantly and forming the appropriate number of clusters. To ensure that each physical trait does not dominate, we scale the smallest and largest value of each field to be in the same range of –1 to +1. Since the elbow method is known to suffer from some ambiguity in terms of the precise location of the bend, we have favored a lower number of clusters to avoid multiple versions of the same subtype.5 In other words, we use the inflection point where the slope first begins to flatten.
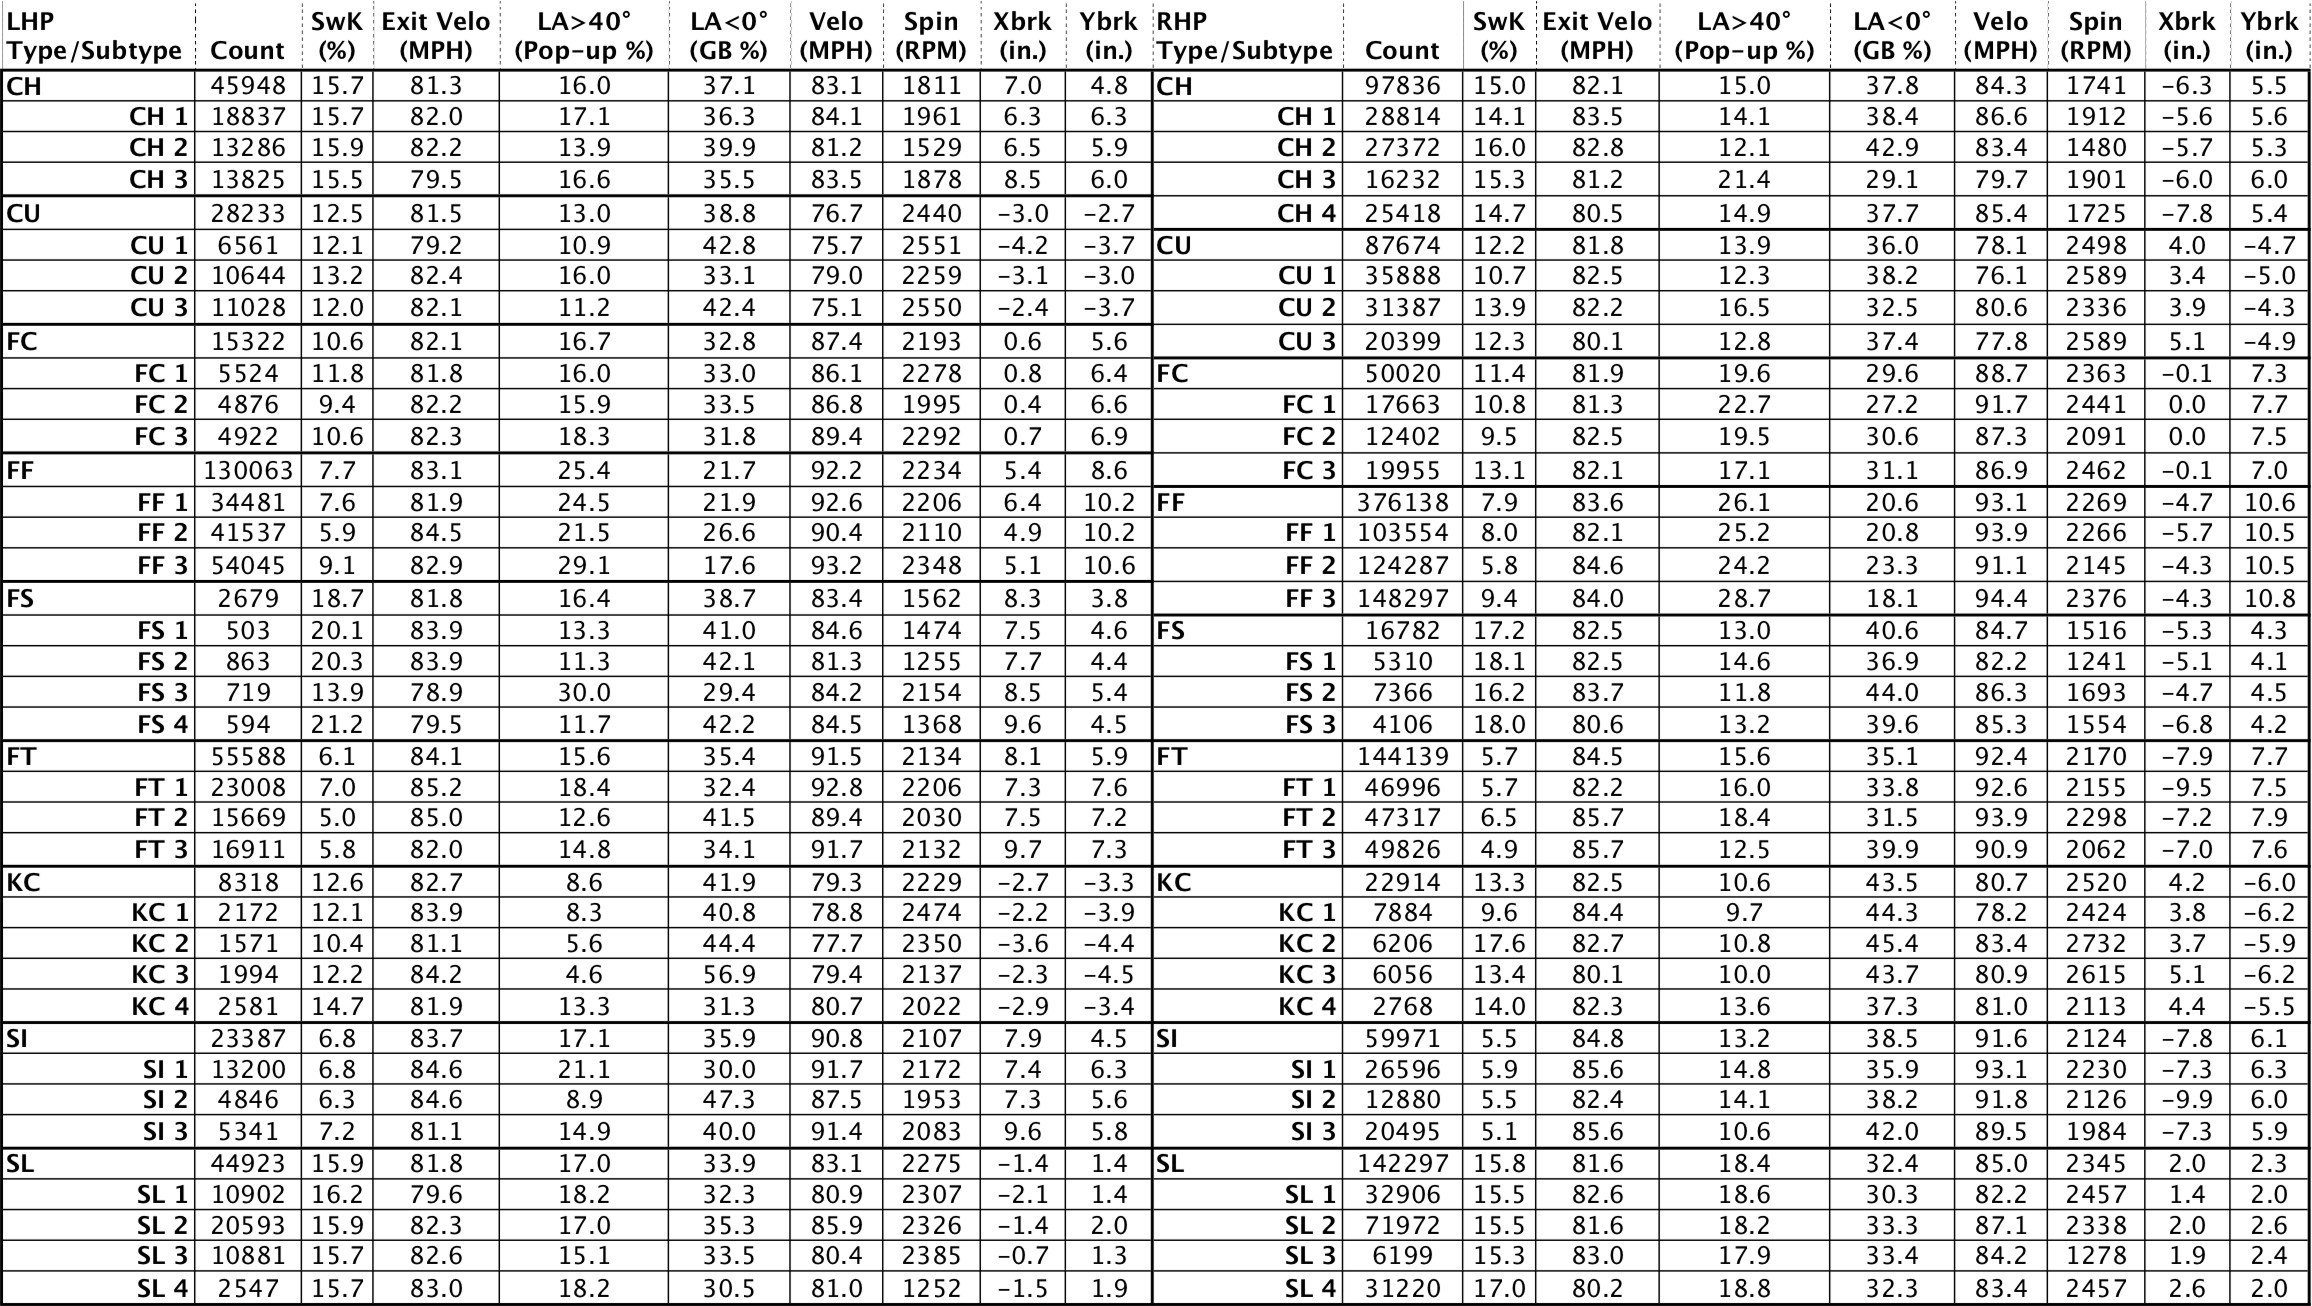
Table 1: LHP and RHP type/subtype performance metrics and physical characteristics
 (Click image to enlarge)
Interestingly, while each number of pitch subtypes is not the same per MLB Statcast pitch type, the total number of pitch subtypes ends up being 30 for both right-handed pitchers (RHP) and left-handed pitchers (LHP). We now consider varying levels of performance across the types and subtypes for each pitch. Since pitches could be successful in different manners, we choose different performance metrics evaluated when each pitch type or subtype is thrown:
- swinging strike percentage, meaning the percentage of all pitches thrown of that kind that generate swings and misses,
- average exit velocity, meaning the MPH off the bat when contact is made with that kind of pitch, and
- extreme launch angles, which we define as the angle off the bat for all batted balls off of that kind of pitch that are either less than 0 degrees (ground ball) or greater than 40 degrees (pop fly).
We first consider the aggregate performance of all pitches thrown in each subtype regardless of what other types of pitches are combined to form a pitch arsenal. Table 1 captures all 9 of the predominant pitch types for left-handed pitchers and right-handed pitchers on the left and right side of the table, respectively. Below each of the 9 types are the subtypes as defined by the aforementioned k-means clustering and elbow method. For the type and subtypes, we have presented the count of the total number of times each pitch has been thrown over the two seasons, the performance metrics, and the four physical dimensions over which we based the clustering.
 The performance of some subtypes can be vastly different, even for the same type of pitch. For example, RHP KC1 has a swinging strike percentage of only 9.6 percent as compared to an average of 13.3 and as high as 17.6 for KC2. The key distinction between KC1 and KC2 subtypes is that the lower-performing KC1 is 5.2 MPH slower but has a similar pitch shape in terms of horizontal and vertical break. To give a feel for another performance metric, we turn to the situation where the launch angle is above 40 degrees, producing a routine fly ball. For LHP, a high-spin splitter (FS3) produces a fly ball at a 30 percent rate versus 11.3 percent for a low-spin splitter (FS2). This relationship is flipped for changeups, where there is an advantage to reduced spin for increasing the ground ball rate (launch angle below 0 degrees). This can be seen in the low-spin version of the changeup (CH2 for both) versus a changeup with a higher spin (CH3 for both) with the RHP version increasing the ground ball rate by 13.8 percent.
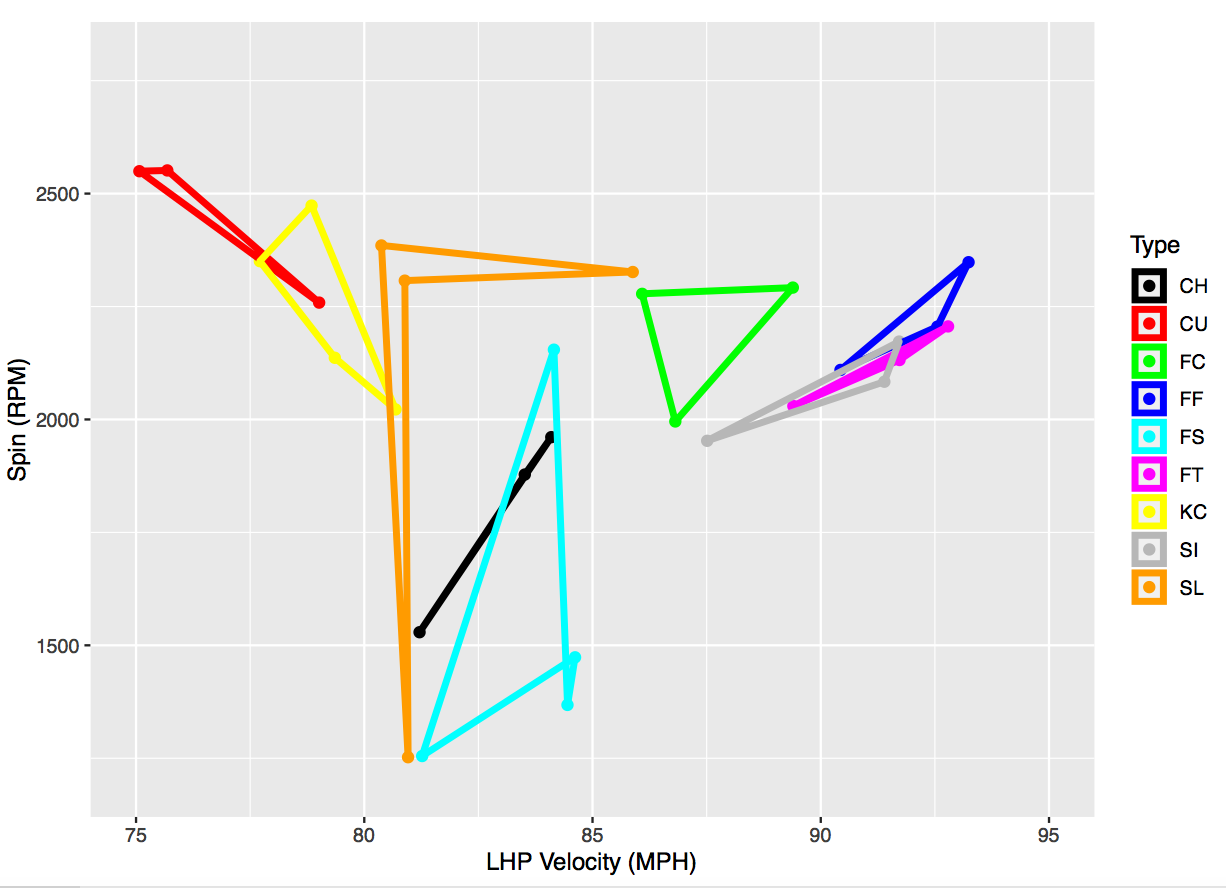
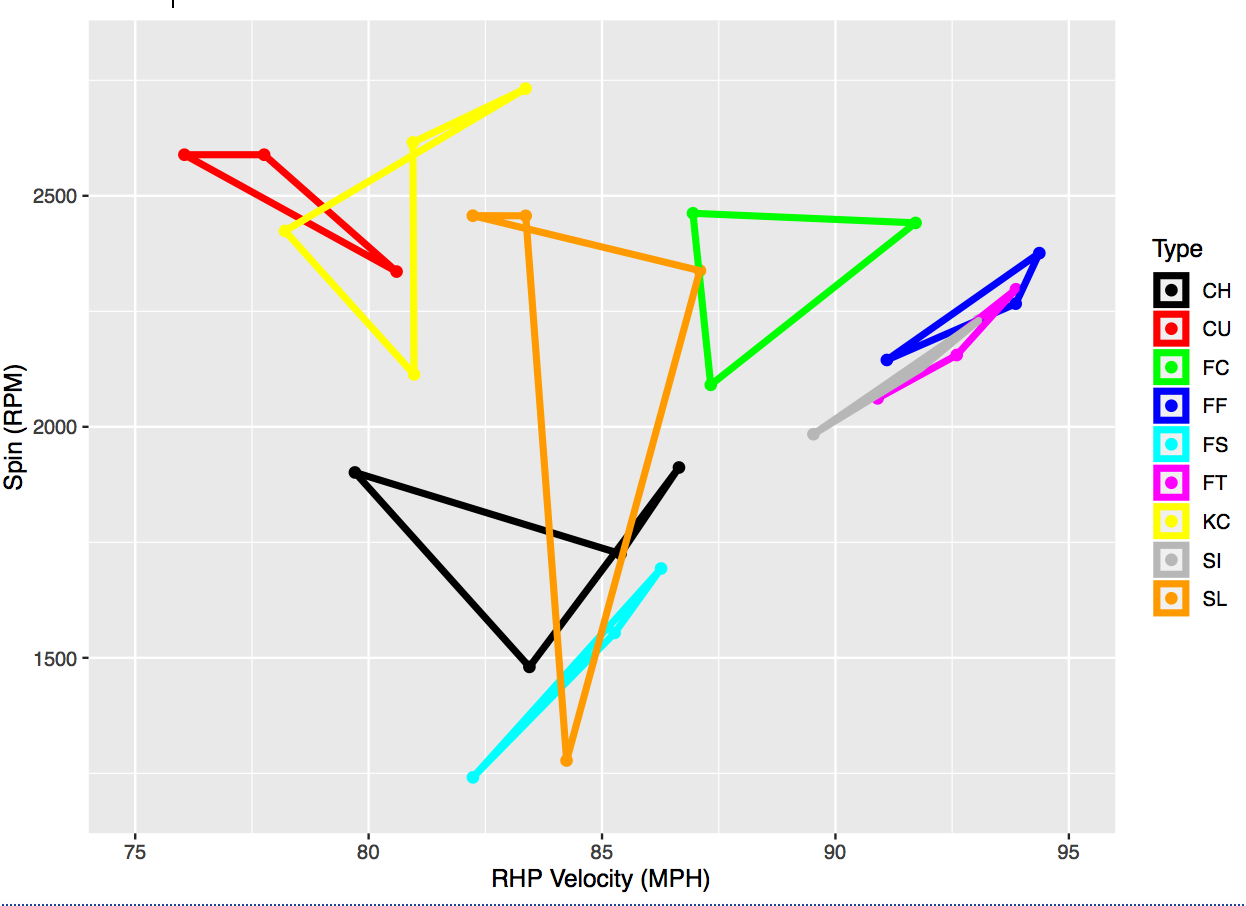
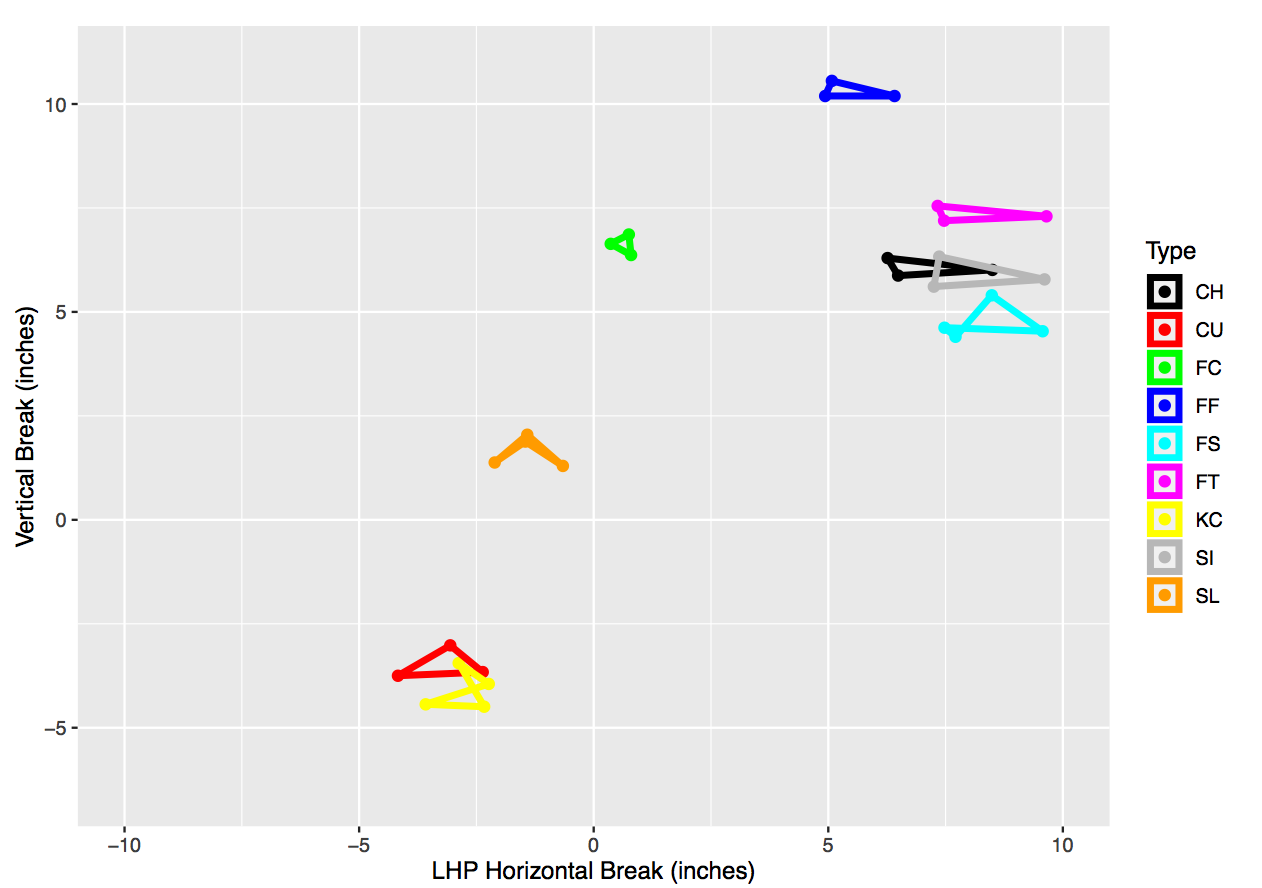
We can more easily see the physical characteristics of spin in revolutions per minute (RPM) and the horizontal and vertical break in inches in Fig. 1, where we have separated the spin and velocity into one graph and horizontal-vertical break into another graph. We observe that there is more horizontal-break diversity in subtype characteristics than vertical-break diversity. For example, while subtypes rarely span more than 1 or 2 vertical inches, they can have over 6 inches of difference in horizontal movement (e.g., RHP FT). There is far greater distinction in the spin and velocity of subtypes, as observed in Fig. 1. For example, the cluster centers for sliders can vary by more than 1200 RPMs and over 7 MPH for changeups.
When we focus on the shape of the spin-velocity figures by types, we can observe the two places that LHP and RHP had most dissimilar subtype clustering. First, LHP had a high-spin splitter that was not present in the RHP figure. Second, RHP had a changeup that had a relatively higher spin rate for the lower velocity of the pitch. Lastly, while we observe the same number of knuckle curves for both pitcher types, the shape is far more distinct for RHP, where there is a high-spin, high-speed version that is not present with LHP.
Figure 1: Four physical dimensions for pitch subtype clustering separated into spin-velocity (top) and horizontal-vertical break (bottom) for left-handed (left) and right-handed (right) pitchers
 |
 |
 |
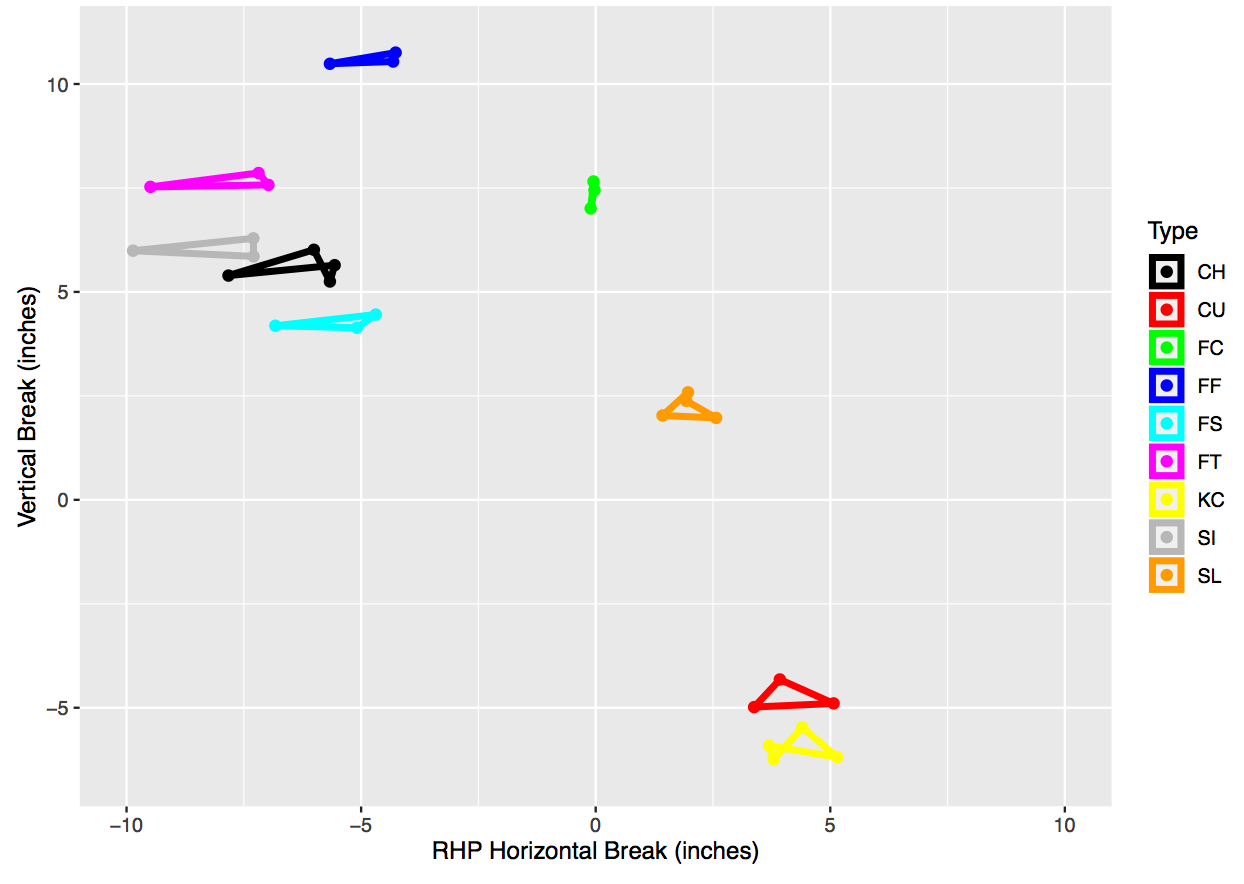 |
We can more easily see the physical characteristics of spin in revolutions per minute (RPM) and the horizontal and vertical break in inches in Figure 1, where we have separated the spin and velocity into one graph and horizontal-vertical break into another graph. We observe that there is more horizontal-break diversity in subtype characteristics than vertical-break diversity. For example, while subtypes rarely span more than 1 or 2 vertical inches, they can have over 6 inches of difference in horizontal movement (e.g., RHP FT). There is far greater distinction in the spin and velocity of subtypes, as observed in Figure 1. For example, the cluster centers for sliders can vary by more than 1200 RPMs and over 7 MPH for changeups.
When we focus on the shape of the spin-velocity figures by types, we can observe the two places that LHP and RHP had most dissimilar subtype clustering. First, LHP had a high-spin splitter that was not present in the RHP figure. Second, RHP had a changeup that had a relatively higher spin rate for the lower velocity of the pitch. Lastly, while we observe the same number of knuckle curves for both pitcher types, the shape is far more distinct for RHP, where there is a high-spin, high-speed version that is not present with LHP.
Evaluating the Effectiveness of Pitch Subtype Pairings
Our goal in this section is to quantify the effect of a single pitch subtype when the pitcher pairs that subtype with another subtype. In other words, when a pitcher has both subtypes in his arsenal, we say that the two subtypes have a pairing. To do so, we consider any time these reference subtypes are paired with each of the other subtypes, meaning the pitcher throws both subtypes. We evaluate all combinations of pitch pairings according to the same four performance metrics, as introduced in Section 2. In other words, we compare the aggregate performance of a pitch subtype (shown in Table 1) against the performance of that same pitch when paired with each of the 29 other subtypes to determine the most extreme gains and losses in performance. To do so, we create ordered lists for each of the performance metrics for each reference subtype when paired with all other subtypes, using a cutoff of at least 100 pitches thrown. Almost all of our subtypes have a sample of at least 200 thrown, where most of our pitch type statistics should be considered statistically “stable.”6 We left a few smaller-sample pitch types (four in total) in the study in order to improve the breadth of pitch types included. Then, we identify the best subtype pair (Table 2) and worst subtype pair (Table 3) and show the difference (Δ) in performance from the reference of all occurrences of that subtype being thrown, presented in Table 1.
First, we generally observe the difference in physical characteristics that have extreme gains along each of the performance metrics. Across both RHP and LHP changes in the vertical movement between the reference subtype and paired subtype led to improvements in popup percentage but at the cost of reductions in ground ball percentage. For improvements in exit velocity for both LHP and RHP, a large difference in horizontal break between the reference and paired subtype is very beneficial.We observe that for increases in swinging strike percentage changes in velocity from the reference subtype and the paired subtype is a primary driver for RHP. For LHP, we found that changes in vertical break between the reference subtype and the paired subtype also played a significant role in swinging strike improvements.
We now discuss some noteworthy observations from Table 2 and Table 3, going from top to bottom. We find that there is an interesting trend for the best changeup pairings based on different performance metrics. We find that the greatest swinging strike rate happens when there is a high level of distinction in at least one physical factor from the reference of a changeup, but distinct by handedness: LHP experience the best swinging strike pairings with subtypes that have the greatest horizontal separation from the changeup, whereas the greatest change in velocity is the key for RHP. Conversely, the biggest changes in exit velocity occur for both handedness when pitches are of similar break to changeups, inducing weak contact. What is striking with the poor pairings for changeups, especially for RHP, the FS that is most similar in break and velocity to the reference changeup subtype (see CH1 and FS3 and CH3 and FS1 in Table 1) dramatically reduces the swinging strike and ground ball rate outcomes of the changeup.
Sinkers (especially SI3) pair fairly universally well with curveballs, especially across performance metrics for LHP but even RHP. However, a lower-spin splitter (FS1) is the best match for all RHP curveball types for pop-up percentage and the more downward knuckle curve dramatically helps the CU to induce more ground balls. In fact, SI can pair both well and poorly with FS and driven by the velocity separation, since they have very similar movement and can have large spin differences with poor pairings.
For cutters (FC) and splitters (FS), we see a compelling opposite trend. Namely, cutters play up (Table 2) when they are paired with pitches with more positive horizontal break and play down (Table 3) with pitches with more negative horizontal break. Conversely, RHP splitters play up when they are paired with pitches with more negative horizontal break and play down when paired with pitches with more positive horizontal break. LHP cutters play up with pitches with more negative horizontal break, such as sinkers for swinging strike rate and exit velocity. When SL2 or SL3 is paired with the cutter, the differing horizontal and vertical break induces more ground balls. When SL1 or SL4 is matched with the curveball (SL1 and CU2 and SL4 and CU1) both losses occur of swinging strike rate going down and stronger contact being induced. The poor pairings seemingly result from differing vertical break between the pitch subtypes.
Table 2: Best subtype pairings in terms of gain in each of the four performance metrics for the reference subtype for LHP (left) and RHP (right)
 (Click image to enlarge)
Both fastball (FF and FT) subtypes seem to be the least affected by the pairings in terms of swinging strike differences (1.6 Δ). Notice though that high-spin FF pairs better with low-spin KC (and better velocity separation) versus low-spin FF with high spin KC. Also, notice that the highest speed, highest spin class of FT pairs best with SI and worst with the slowest changeups. With lefties, SI2 or SI3 is paired well with FF2 or FF3 with respect to swinging strike rate. Four-seam fastballs pair poorly with splitters with regards to failing to induce ground balls (significant spin difference and vertical break change).
For RHP, knuckle curves can have very positive pairings with FS (similar velocity but very different vertical and horizontal movement) and FC (similar horizontal movement but substantial speed difference and vertical action). However, from Table 3, we find that KC pairs poorly with SI (dissimilar speed and dissimilar movement in both directions) and SL (similar speed and most similar movement other than CU) for RHP. Unlike for RHP, the KC and SL2 or KC and SL3 is a positive pairing (very different vertical movement) for swinging strike rate for LHP. For LHP, KC and FT has a negative pairing (very different horizontal and vertical movement and very different velocity) and plays down for swinging strike rate and ground ball rate.
Table 3: Worst subtype pairings in terms of loss in each of the four performance metrics for the reference subtype for LHP (left) and RHP (right)
 (Click image to enlarge)
For RHP, slider subtypes have various KC subtypes that pair well for increasing swinging strike rate and increasing ground and fly balls, whereas SI2 and SI3 reduce exit velocity. For LHP, sliders when paired with cutters, especially FC2 or FC3, seemed to reduce swinging strike rate and induce harder contact.
To accentuate the value of this pitch pairing research there are a couple of examples of one pitch in isolation having different performance than when paired with others. One example of a mediocre pitch having profound pairing impact is RHP SI2, which has only a 5.5 percent swinging strike rate and a decent ground ball rate (38.2). However, there are 17 instances where SI2 helps another subtype to have improved performance. For example, SI2 greatly helps slider with reducing hard contact. Conversely, RHP FS1 with low speed and low spin is somewhat of a black hole of pitch pairing, having 16 instances where it worsens the performance of a subtype. RHP, slider subtypes have various KC subtypes that pair well for increasing swinging strike rate and increasing ground and fly balls, whereas SI2 and SI3 reduce exit velocity. For LHP, sliders when paired with cutters, especially FC2 or FC3, seemed to reduce swinging strike rate and induce harder contact.
Extremes in Pairing Frequency and Pitcher Performance Level
In this section, we exemplify these pairings with five examples: Aaron Nola, Corey Kluber, Jeff Samardzija, Aaron Bummer, and Sean Newcomb.
Aaron Nola throws two types of curve balls (CU1 and CU3). Both of these types of curveballs have the greatest increase in swinging strike percentage when they are paired with the type of sinker that Nola throws, SI3. In other words, the optimal pairing for CU1 and CU3 are both SI3 for RHP, with the latter curve ball having the greatest increase. When we compare the physical characteristics, CU3 is faster with greater horizontal break. Therefore, Nola could potentially work with a pitching coach to increase the horizontal movement on his curve even further to generate even more swinging strikes.
Corey Kluber is a particularly good example of a positive pairing with CU2 and SI2. Despite blow-average velocity on the sinker, Kluber has had great success with those two pitches. In particular, since Kluber’s sinker is of the SI2 variety, it helped his curve ball play up from a pitch subtype average swinging strike rate of 13.9% to a remarkable 26.2% swinging strike rate.
Jeff Samardzija also throws multiple breaking pitches, but many of them have bad outcomes. For example, CU2 and KC4 do not pair well for balls in play, KC4 and SL3 do not pair well for swinging strikes, and CU1 and FS1 do not pair well for whiffs or grounders. However, there is a silver lining here. In the last three springs, Samardzija has been working on a new breaking pitch, SL3, which has an excellent pairing with KC1 for RHP. He could work on his knuckle curve having more depth, which is the distinguishing feature of the KC1 and could take his SL3 to the next level, adding 2.9% of swinging strikes and 3.9% of pop-up rate.
Aaron Bummer and his short sample of one season with above-average results might well represent how minor league or amateur pitch tracking systems might pay great dividends. A good pitch pairing is the SI3 with the FF1 for LHP, which allows greater swinging strikes. He throws the four-seamer high in the zone following his sinker to get batters to swing under it. The pairing certainly contributed to the White Sox extending him for five-years and $16M even with his limited MLB success. With FF1 in his arsenal, his SI3 swinging strike rate was 9.0%, 1.8% more than the average SI3.
Sean Newcomb is another left-handed pitcher with a fairly short track record but has some interesting pairings that could produce high levels of performance in the future. Specifically, Newcomb pairs a CU1 and FF3 (a pairing that is not shown in Table 2, but very positive nonetheless) that generates a very high rate of ground balls. Since he had FF3 in his arsenal, his CU1 had a 56.0% ground ball rate, 13.2% above the average CU1. Despite his iffy command, it looks like Newcomb may return to the rotation this year, and that fly ball suppression may be part of the reason why.
Conclusion
In this paper, we used k-means clustering and the elbow method to classify pitch subtypes from previously-labeled MLB Statcast pitch types. In doing so, we understood the degree to which subtypes differ across a type and evaluated the effectiveness of pairing subtypes. Between the best and worst pairing of subtypes, we found that there is an average change of 3.5 percent swinging strike rate, a 2.4 MPH exit velocity, 3.3 percent pop-up rate, and 4.5 percent ground ball rate. Lastly, based on frequency of the best and worst pairings, we showed examples of pitchers and discussed their level of performance. We hope that this work leads to intuition on where to focus efforts with pitcher scouting, pitch design, and development.
GREGORY DVOROCSIK is a junior at Wake Forest University majoring in mathematical business. He has worked with the school’s baseball analytics department creating scouting reports and other deliverables for the coaching staff to improve game preparation and player development. He is seeking an analytics internship or apprenticeship with a MLB team this summer.
ENO SARRIS is a staff writer for The Athletic, where he specializes in pitching analytics. He takes the best public analytics findings to the players in the clubhouse to get their reactions. He has also been a contributor to FanGraphs, ESPN, MLB.com, Fox Sports, SB Nation, The Hardball Times, and others.
JOE CAMP is an Associate Professor in Electrical and Computer Engineering (ECE) at Southern Methodist University (SMU). While his research efforts focus on wireless systems and drone communications, his hobby is baseball analytics and has collaborated with the Texas Rangers in recent years to give a SABR 101 talk to fans before games.
Notes
1 M. Marchi, “Pitch classification revisited.” https://tht.fangraphs.com/pitch-classification-revisited/, July 2010, and, E. Moore, “An unsupervised approach for pitch classification,” in Proc. of Sabermetrics, Scout- ing, and the Science of Baseball (Saberseminar), 2019.
2 H. Pavlidis, “What makes a changeup good?” https://www.baseballprospectus.com/news/article/ 21675/what-makes-a-good-changeup-an-investigation-part-three/, Aug. 2013.
3 G. Healey and S. Zhao, “Finding the optimal pitch distribution,” in Proc. of Sabermetrics, Scouting, and the Science of Baseball (Saberseminar), 2019.
4 C. Sievert and B. M. Mills, “Using publicly available baseball data to measure and evaluate pitching performance,” pp. 39–66, New York, New York, USA: Chapman and Hall/CRC, 2017.
5 T. Sarkar, “Clustering metrics better than the elbow-method,” https://towardsdatascience.com/clustering-metrics-better-than-the-elbow-method-6926e1f723a6, Sep. 2019.
6 J. Pemstein, “A long-needed update on reliability,” https://blogs.fangraphs.com/a-long-needed-update-on-reliability/, Sep. 2016.