

Take Me Out to the (Minor League) Ballpark
This article was written by Will Christensen
This article was published in The National Pastime: Major Research on the Minor Leagues (2022)
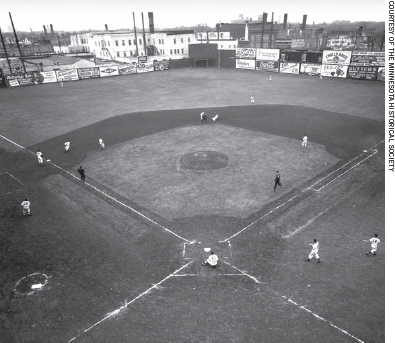
A game at Minneapolis’ Nicollet Park in 1954, the most hitter-friendly park of its era. (Courtesy of the Minnesota Historical Society)
Contrary to what you might read elsewhere, Forbes Field was not the first modern ballpark made of steel and concrete. That honor belongs to a minor-league stadium that now, like so many historic baseball sites, is a parking lot.1 Neil Park in my hometown of Columbus, Ohio, was by no means the first—or only—significant minor-league ballpark to have thrived, only to meet an ignominious fate at the hands of those who didn’t fully appreciate what they had.
You might be familiar with the names of some of them: Nicollet Park, Rickwood Field, Seals Stadium, Wrigley Field, Gilmore Field, Engel Field, Offermann Stadium, Sulphur Dell. Whole books have been written about some of these places, and a few have even appeared in a movie or two that you might have seen, such as the Rockpile in Buffalo (The Natural), Bush Stadium in Indianapolis (Eight Men Out), and the old Durham Athletic Park (Bull Durham, of course).
Lots of stories and memories exist of these stadiums, but with a few notable exceptions, we don’t have a concrete idea of how these parks played. Sure, most people who know anything about minor- league baseball know that Nicollet Park and Sulphur Dell, with their short right-field fences, were great homer havens, but what about Seals Stadium in San Francisco? Was it a hitters park? A pitchers park? I believe it was a tough park for home runs and a bit of a hitters park otherwise, but we don’t really know because of a dearth of information on park effects for minor-league stadiums. Unless you’re willing to go through box scores and assemble them yourself, home-road splits for minor-league ballparks before 2005 don’t exist in the public eye.
A quick-and-dirty way to assess park effects is to take the total of team runs scored and allowed and divide that by the league average. It works better for assessing individual players than it does ballparks, but for the most part, this method shows which parks helped batters and which helped pitchers.
I developed another quick-and-dirty subjective assessment along those lines for ballparks, assigning or subtracting points on the following system:
Add 1 point if
- A team led its league in home runs.
- A team led its league in runs scored.
- A team led its league in runs allowed.
- A team led its league in home runs allowed.
- A team’s lineup included the league leader in home runs.
Add 2 points if
- A team led its league in run context, which is runs scored + runs allowed.
Add 1.5 points if
- A team led its league in home run context, or home runs + home runs allowed.
Subtract the same amount if
- A team finished last in its league in those respective categories.
Team homers, runs, and runs allowed are mostly available across the board after 1918. Because homers allowed weren’t tracked at all until the 1950s and not universally until the 1970s, I split minor-league parks into two groups, with the dividing line being 1963. The ballparks that were in use for more of their seasons before that year were put in Group A, the rest in Group B.
By this method, Table 1 shows the 10 most hitter-friendly ballparks in minor-league history.
Table 1: The Ten Most Hitter-Friendly Ballparks in the Minor Leagues
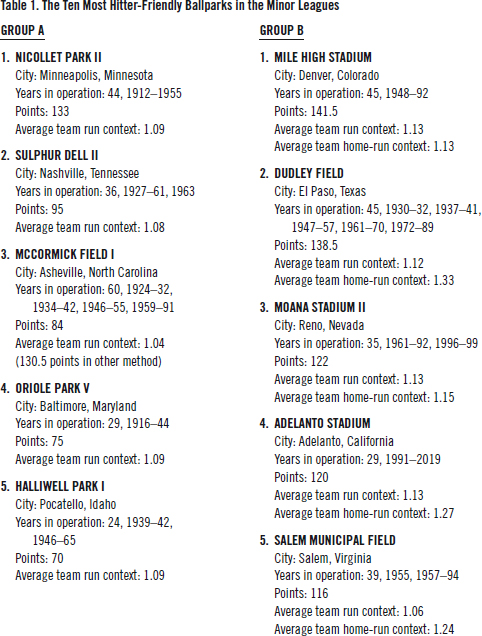
You can’t compare the point totals in Group A with those in Group B because more data are included in Group B, of course. That said, I’d bet that if a vote were taken among experts as to which minor-league ballpark was the best hitters park of all time, Nicollet Park would be at the top of the heap. Its legendary 279-foot right-field wall helped dozens if not hundreds of hitters. It seems hard to believe that when it opened, Nicollet was actually a canyon compared with the Millers’ previous park, Athletic Park, which helped Perry Werden hit an incredible 43 and 45 homers in 1894 and 1895. (Werden dropped to 18 the first year he played half his games in Nicollet.)
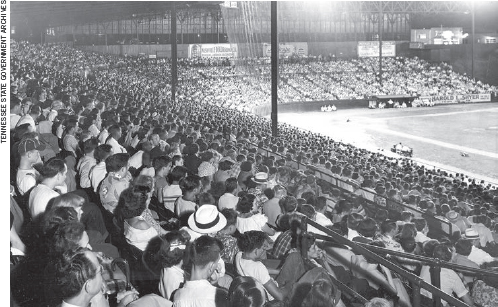
Sulphur Dell, shown here in the 1950s, was known as a hitter haven. (Tennessee State Government Archives)
One more note: Obviously, my ratings are based on totals. One could argue that a better way to evaluate ballparks is by points per season. I wouldn’t disagree, but completing the research necessary for such a thorough evaluation is beyond my bandwidth. That said, if one wanted to perform the research, I’d go double or nothing that with the possible exception of a ballpark that was used for just a single year, he or she would find that the two ballparks at the top of that list are Bonneville Park/Derks Field and Hughes Stadium.
Bonneville Park, later renamed Derks Field, was home to the Salt Lake City Bees from 1915 to 1946. It operated only 19 seasons during that time, but it racked up 61 points, or an average of 3.21 per season. That’s the highest of any ballpark that I evaluated that was open for at least 10 seasons (that didn’t include full home runs data). Almost all of that was accumulated when Bonneville Park was the hitters paradise of the Pacific Coast League from 1915 to 1925. Back then, the Bees led the PCL in run context every season—11 for 11. The Bees led every season in runs allowed (estimated) and in runs scored in eight out of 11. Of course, the reason for this was that Salt Lake City is about 4,000 feet farther above sea level than any of the other PCL cities at the time.
That said, the best hitters park of any minor-league stadium that lasted more than a year (that we can evaluate properly) has to be Hughes Stadium in Sacramento. Hughes Stadium is a track and football stadium at Sacramento City College, and in 1974 it was called into service as a baseball stadium for the Sacramento Solons, returning after a 14-year absence. Shoehorning a baseball diamond into the space resulted in a farce, with a left- field fence that was 235 feet from home plate.
The Solons used Hughes Stadium for three years before the team moved to San Jose (a culture shock to be sure for the hitters), and during those three years, the Solons led the PCL in every possible hitters category that my method uses except runs in 1976, when the Solons finished as runners-up by 24 (and a Solon player did not lead the league that year in homers). That’s 24 points out of a possible 26 in three seasons, or an 8.00 average.
As you might imagine, the home-run numbers are ridiculous. In 1974, the Solons hit a minor-league record 305 home runs. (The previous mark was 271 by the 1947 Las Vegas Stars.) They allowed what also has to be a minor-league record 301 home runs. That’s 606 home runs in 144 games that the Solons played. The league hit 1,107 homers for the whole season, so, yes, more than half were hit during Solons games alone!
That year, the Solons had a run context that was 22 percent better than the league average. That’s impressive, but it isn’t a record. The home-run context was—are you ready for this?—118 percent better than the league average. If that isn’t a record, it should be.
So Hughes Stadium is the greatest hitters park in minor-league history, unless it’s Bonneville Park, unless… as noted above, Nicollett Park went from being a decent hitters park relative to the league (based on incomplete data) to a launching pad after World War I. From 1919 to when Nicollet closed after 1955, the Millers racked up 125 points in 37 years, or an average of 3.38 per season. During that time, the Millers led the AA in homers 27 times, runs 21 times and run context 25 times. And that’s without any help from altitude.
On the flip side of the coin, parks that were pitcher- friendly tend to be less well-known. That isn’t surprising when you consider that most fans prefer offense, so they’re more likely to remember ballparks where runs were plentiful.
Here are the five best pitchers parks in minor- league history, according to my method:
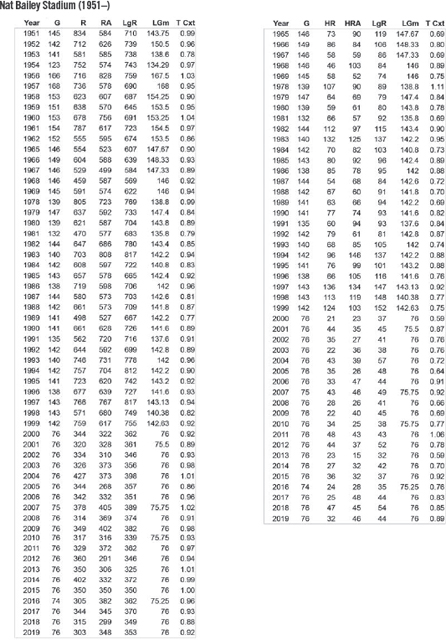
1. NAT BAILEY STADIUM
- City: Vancouver, B.C., Canada
- Years in operation: 58, 1951-54, 1956-62, 1965-69, 1978-2019
- Points: minus-116.5
- Average team run context: 0.92
- Average team home-run context: 0.80
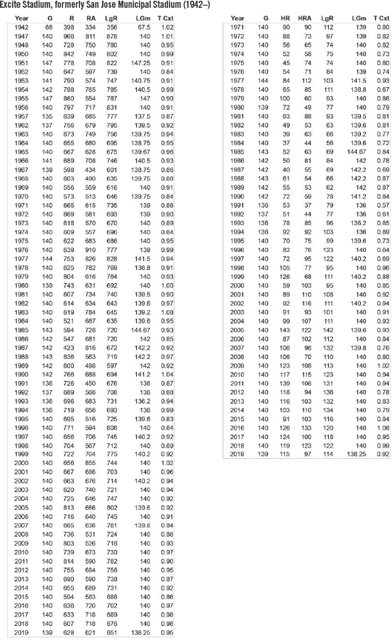
2. SAN JOSE MUNICIPAL STADIUM / EXCITE PARK
- City: San Jose, California
- Years in operation: 69, 1942, 1947-58, 1962-present
- Points: minus-111
- Average team run context: 0.93
- Average team home-run context: 0.83
3. PARQUE CENTENARIO 27 DE FEBRERO
- City: Villahermosa, Tabasco, Mexico
- Years in operation: 51, 1964-70, 1975, 1977-present
- Points: minus-109
- Average team run context: 0.88
- Average team home-run context: 0.72
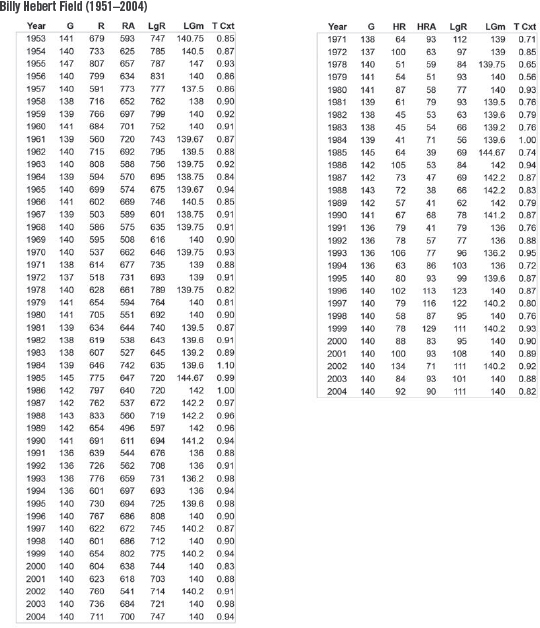
4. BILLY HEBERT FIELD
- City: Stockton, California
- Years in operation: 47, 1953-72, 1978-2004
- Points: minus-99
- Average team run context: 0.91
- Average team home-run context: 0.83
5. DUNN FIELD
- City: Elmira, New York
- Years in operation: 65, 1939-55, 1957-2005
- Points: minus-93.5
- Average team run context: 0.97
- Average team home-run context: 0.86
Yes, that’s correct: Every one of the five best pitchers parks are old parks that survived. Three of the top five were in use in 2017, and all of the top five saw action as recently as 2004. I have no explanation for that other than perhaps older ballparks, when all other things are equal, play more as pitchers parks relative to new parks, perhaps because of shorter, closer fences in newer parks built to promote action.
One thing that you’ll note about pitchers parks is that you don’t see atmospheric anomalies, or ballparks from places where the ball didn’t travel well relative to the league, as you did with hitters parks, such as Bonneville Park in the PCL. In other words, you can’t find a situation where all of the parks are, say, above 3,000 feet in elevation except for one that’s 50 feet, so the negative totals generally aren’t as high as are the positive totals.
That said, I have no doubt that had Stockton and San Jose not been in the same league at mostly the same time, either one of those parks (and perhaps both) likely not only would be atop the list of pitchers paradises but might also have accumulated more points than any of the hitters havens.
For what it’s worth, I believe that the pitchers’ best friend with respect to preventing the home run relative to the league was Damaschke Field in Oneonta, New York. Used between 1939 and 2009, Damaschke just missed being included among the top five pitchers parks by a half-point. Of its -86 points accumulated in 43 seasons, 66 were the result of home run categories. Oneonta teams led their respective leagues (primarily the New York-Penn League) in fewest home runs eight times, fewest home runs allowed 23, and lowest home- run context 22 (the latter two in 34 seasons). The dimensions were nothing special, 335 feet to the corners and 401 to center, but the ball might as well have been made of pewter as far as how it traveled.
A final note: Some parks are hitters parks or pitchers parks only because of the league that they’re in at the time. In other words, they’re extraordinary compared with the rest of one league, but they might be absolutely ordinary when they’re in a different league, with different teams, parks, and locales.
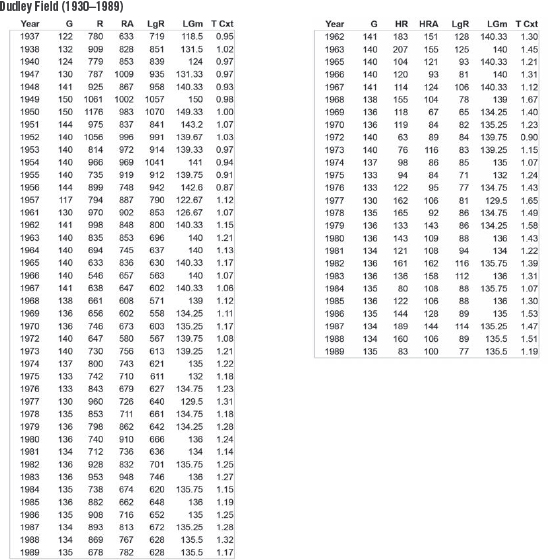
Take the Dudley Dome, for example. It played as slightly pitcher-friendly until El Paso joined the Texas League. Instantly, the Dome became a launching pad. Conversely, Dunn Field was a desert when Elmira was in the Eastern League. As soon as it moved to the NYPL, it became primarily a hitters park, then reverted to a pitchers paradise after Elmira teams went independent.
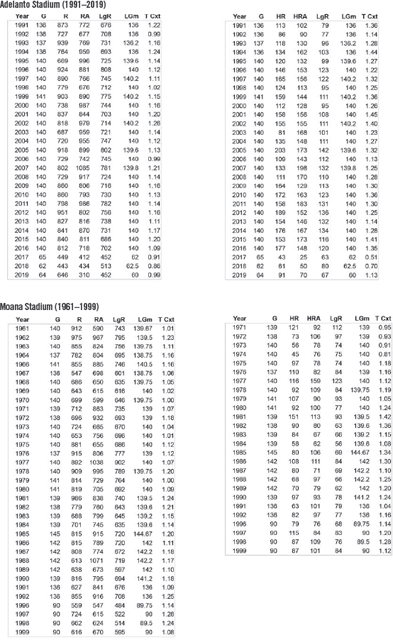
As time goes on, it will be interesting to see what happens to Adelanto Stadium. Based on points per season, a case exists that it’s the greatest hitters park in minor-league history. It racked up 120 points in only 26 seasons in the California League. However, when the High Desert Mavericks closed shop in 2016 and the High Desert Yardbirds opened in the independent Pecos League in 2017, Adelanto Stadium played like a pitchers park in the pinball PecL.
It turns out that ballpark factors, like player performance, can be relative.
To complete the story, Neil Park closed in 1932 when the renamed Redbirds moved to Redbird Stadium. According to my analysis, Neil Park was dead neutral.
WILL CHRISTENSEN is a professional journalist, avid researcher, and minor-league baseball nut. He has been a member of SABR since 1986 and finally is paying back all the benefits he’s received over the years by copyediting bios for the SABR BioProject.
Notes
1. Philip Lowry, et. al., Green Cathedrals (Fifth Edition). Page 104 of the recent SABR edition states that “in 1905, [Neil Park II] was the only steel-and-concrete stadium used for a major league game until Forbes Field opened in 1909.”
APPENDIX
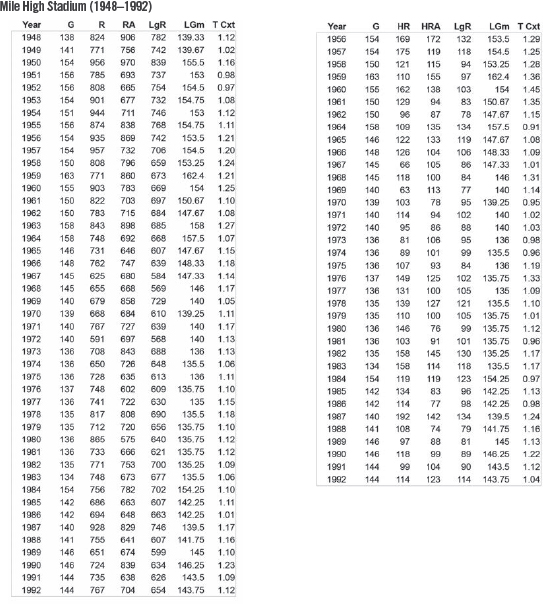
Presented here are the fully compiled numbers for some of the ballparks discussed in the article. Two tables are included for each park, one for runs, and one for home runs. The home run table for each park contains only the seasons for which home run totals were published.
For each season, the following stats are included:
G: Team games (entire season, not just at the park)
R: Team runs
RA: Team runs allowed
LgR: League average runs per team
LGm: League average games played per team
HR: Team home runs
HRA: Team home runs allowed
T Cxt: Team context. This is the runs context for the team for the season, or the percentage of runs scored in games played by played by the team compared with the league average, calculated as:
(team runs + team runs allowed divided by 2 * league average) * (team games / league average games).
For example, in 1953, the Stockton Ports scored 679 runs and allowed 593 in 141 games. The average California League that season scored and allowed 747 runs (rounded) in 140.75 games, so the context formula is:
((679 + 593) / (2 * 747)) * (141 / 140.75) = (1,272 / 1,494) * (141 / 140.75) = 0.85
In 1953, Ports games had an average of 15 percent fewer runs than the league average.
(Click image to enlarge)
(Click image to enlarge)
(Click image to enlarge)
(Click image to enlarge)
(Click image to enlarge)
(Click image to enlarge)