

Testing an RPI Ranking System for Canadian University Baseball
This article was written by Mitchell Thompson - George S. Rigakos
This article was published in Fall 2019 Baseball Research Journal
University baseball in Canada currently lacks a true national tournament. Since 1994, Canadian university (and college) teams have competed in a limited national championship either under the umbrella of the defunct Canadian Intercollegiate Baseball Association (CIBA1) or from 2013–19, the more recently defunct Canadian Collegiate Baseball Association (CCBA). CIBA and CCBA membership vacillated from a high of 30 teams in 2011 to about ten teams in 2019.2 The recognition of baseball by Ontario University Athletics (OUA) and the Ontario Colleges Athletic Association (OCAA) in the last decade has helped establish baseball as a bona fide intercollegiate sport in Canada. Indeed, many current OUA member teams were part of the Ontario conference of the CIBA and participated in a national championship. But OUA and OCAA recognition has resulted in the fracturing of collegiate baseball into (1) two-year college and four-year university leagues on the one hand, and (2) recognized and non-recognized associations on the other.
Not surprisingly, geography is also an important determinant for the organization of university baseball, resulting in three regional groupings: the Canadian Collegiate Baseball Association (CCBA) operating from the Atlantic to Ottawa, the Ontario University Athletics (OUA) baseball group in Ontario, and the Canadian Colleges Baseball Conference (CCBC) in the west which lumps together colleges and universities in order to form a viable league.3
Finally, the monetary reality for university baseball is that while teams are often organized and compete at a varsity level, the vast majority are only partially-financing “competitive clubs” because U Sports and its provincial members (e.g. the OUA) do not recognize baseball as G1 (varsity) sport.4 In Canada, this distinction is particularly important. In the absence of either official university association recognition or NSO backing — in this case Baseball Canada — U sports, Canada’s university sport governing body, will neither recognize nor organize a national championship for university baseball.5
The Problem
Given these geographic, financial and bureaucratic impediments, university baseball in Canada has historically been siloed into three groupings offering their own championships: the OUA’s provincial championship, the CCBC’s conference championship in the west, and the CCBA’s “national” championship encompassing teams from Ottawa, Quebec, and the Atlantic. While the CCBA has been the closest thing to a bona fide “Canadian University World Series” it still has not been able to solve the problem of a truly national and inclusive tournament.6
The formation of two coach-driven conferences in the OUA (West and East) was deemed necessary for the 2019 season in order to make room for new arrivals Carleton and Ottawa. This makes it difficult for all teams to play each other the same number of times given the short 16-game Fall conference schedule. As a result, seeding for the open provincial tournament on the basis of teams’ win-loss records is an inherently flawed endeavor.
Of course, in the CCBA, the Northern and Atlantic conferences never played each other in the regular season and held their own playoff eliminations to determine seeds for their joint national championship. It is unclear how this will function in the future with the departure of Carleton and Ottawa.
Between initial submission and final revision of this paper, the CCBA announced it would cease operations in July 2019. Three Quebec teams (Concordia, Montreal, and McGill) have been, at least temporarily, orphaned and unaffiliated in the 2019 season. The remaining Atlantic conference teams have formed as the new Atlantic Collegiate Baseball Association (ACBA).7 This realignment has, for now, severed any connection between the Atlantic clubs and their former competition in central Canada.
These developments only exacerbate a longstanding problem. Even if former Atlantic Conference CCBA (now ACBA), Quebec, OUA, and CCBC university conference teams somehow found a way to work together to create a national championship of university baseball — a unified Canadian University World Series (CUWS) — how would eligible teams be seeded when inter-conference play is rare or absent and no agreed upon playoff format or elimination system currently exists or is ever likely to be implemented?
A Potential Solution
The purpose of this article is to explore the feasibility of an RPI ranking system for Canadian university baseball.8 In the absence of playoff eliminations, and where inter-conference play is sparse, an RPI-based ranking system has, for example, proven useful — albeit controversial — in the US college basketball context.9
The Rating Percentage Index (RPI) is the most commonly used method for ranking a large number of teams that play a relatively small schedule. Most famously adopted in the NCAA, RPI is used to rank teams nationally when most teams never have an opportunity to play one another. The premise of the RPI is that since most teams do not play each other, it would be unfair to rank teams based on wins and losses as in the NFL, NBA, and MLB, or based on a points system as in the NHL. Instead, RPI uses the strength of a team’s schedule in order to judge the quality of their play.
RPI is a mathematical calculation of a team’s strength of schedule. It is the sum of three components: Winning Percentage (WP), Opponent’s Winning Percentage (OWP), and Opponent’s Opponent’s Winning percentage (OOWP), each of which is weighted differently. The Formula for RPI is as follows:
RPI = (0.25 * WP) + (0.5 * OWP) + (0.25 * OOWP)
A team’s WP is the percentage of games that a team wins, expressed — in a form similar to batting average — as a decimal to three digits. This is calculated by dividing the total team wins by total games played. WP accounts for 25% of the RPI calculation. The following is an example of a WP calculation:
- Team A: 4-0
- Team B: 1-3
- Team C: 1-3
- Team A WP = Number of Wins / Number of Games Played = 4 / 4 = 1.00
- Team B WP = Number of Wins / Number of Games Played = 1 / 4 = 0.25
- Team C WP = Number of Wins / Number of Games Played = 1 / 4 = 0.25
And so, we add 25% of each total to each team’s respective RPI. That is, 0.25 for Team A and 0.0625 for Teams B and C.
A team’s OWP considers the winning percentage of teams faced. The calculation is a bit longer than that of WP. It averages the winning percentages of teams faced for every game not including the outcomes of games including the team whose OWP is being calculated. OWP accounts for 50% of the RPI Calculation. Using the same example for the WP Calculation:
- Team A: 4-0
- Team B: 1-3
- Team C: 1-3
Team A goes 2-0 against Team B. Team A goes 2-0 against team C. Team B goes 1-1 against Team C. To calculate Team A’s OWP, we must first find the WP of teams B and C excluding games involving Team A:
- Team B WP: 0.500
- Team C WP: 0.500
Now we may calculate Team A’s OWP:
= Team B WP (0.500) * 2 (games played between Teams A and B)
+ Team C WP (0.500) * 2 (games played between teams A and C) / Games Played by team A
= (1.000 + 1.000) / 4
= 0.500
Thus, Team A’s OWP is 0.500 and 0.250 is added to their RPI. This process can be replicated to find Team B (OWP of 0.500, 0.250 added to RPI) and Team C’s (OWP of 0.500, 0.250 added to RPI) OWP.
A team’s OOWP considers the OWP of teams faced similar to how OWP considers the WP of teams faced. The calculation is similar in length of the OWP calculation, however, at this point in the RPI process the work has already been done and we must only average out the OWP’s of the opponents. OOWP accounts for 25% of the RPI Calculation.
Expanding on the previous example in order to Calculate OOWP:
- Team A: 4-0
- Team B: 1-3
- Team C: 1-3
- Team A OWP: 0.500
- Team B OWP: 0.500
- Team C OWP: 0.500
- Team A OOWP = Team B OWP (0.500) * 2 (games played between teams A and B) + Team C OWP (0.500) * 2 (games played between teams A and C) / Games Played = (1.000 + 1.000) / 4 = 0.500
- Team B OOWP = Team A OWP (0.500) * 2 (games played between teams B and A) + Team C OWP (0.500) * 2 (games played between teams B and C) / Games Played = (1.000 + 1.000) / 4 = 0.500
- Team C OOWP = Team A OWP (0.500) * 2 (games played between teams C and A) + Team B OWP (0.500) * 2 (games played between teams C and B) / Games Played = (1.000 + 1.000) / 4 = 0.500
Thus, each team’s OOWP is 25% of 0.500, and so 0.125 is added to their RPI.
In this example, the OWP and OOWP for each team would all have worked out to be the same, this will not be the case in every scenario, of course, but the point here is to demonstrate how to calculate these numbers. The separating factor for the teams in this particular example of RPI rankings would, of course, be their winning percentages (WP) given that all other factors were equalized. The RPI rankings for the example used would look like this:
- Team A RPI = (0.25 * WP) + (0.5 * OWP) + (0.25 * OOWP) = (0.25 * 1.0) + (0.5 * 0.5) + (0.25 * 0.5) = 0.25 + 0.25 + 0.125 = 0.625
- Team B RPI = (0.25 * WP) + (0.5 * OWP) + (0.25 * OOWP) = (0.25 * 0.25) + (0.5 * 0.5) + (0.25 * 0.5) = 0.0625 + 0.25 + 0.125 = 0.4375
- Team C RPI = (0.25 * WP) + (0.5 * OWP) + (0.25 * OOWP) = (0.25 * 0.25) + (0.5 * 0.5) + (0.25 * 0.5) = 0.0625 + 0.25 + 0.125 = 0.4375
Method
In order for our RPI calculations to be useful we make certain assumptions. First, there must be some inter-conference competition to link teams in the standings. This is the only epistemic basis for ranking teams across Canada from 1 to 20. As a result of this presumption, CCBC teams are excluded from our analysis because while not all teams need to play one another, some teams must cross over. The CCBC, more importantly, plays in the Spring-Summer while the remainder of teams play in the Fall. This does not, however, preclude their participation in a CUWS.10
Second, we have used post-facto results culled from CCBA competition at national championships in 2016, 2017, and 2018. Normally, the RPI would be used to determine if teams qualified for such a tournament in the first place but, as we have noted, we needed the data for our model.
Third, regardless of overall ranking, a Canadian University World Series would likely adhere to some regional representation. Under the CCBA, seeds were awarded on the basis of finishes by Northern and Atlantic playoffs providing for an equal representation from both conferences. In U Sports competition, all national championships also proceed from regional playoff eliminations. In the following section, we follow these same assumptions for interpolating seeds for hypothetical 2016, 2017, and 2018 CUWS.
In the Tables below we rank all participating teams in the OUA and CCBA from 2016 to 2018 by season. We use all available data culled from GameChanger, Pointstreak, and OUA Presto results. We also include all available inter-conference, pre-season, and playoff scores.
Results
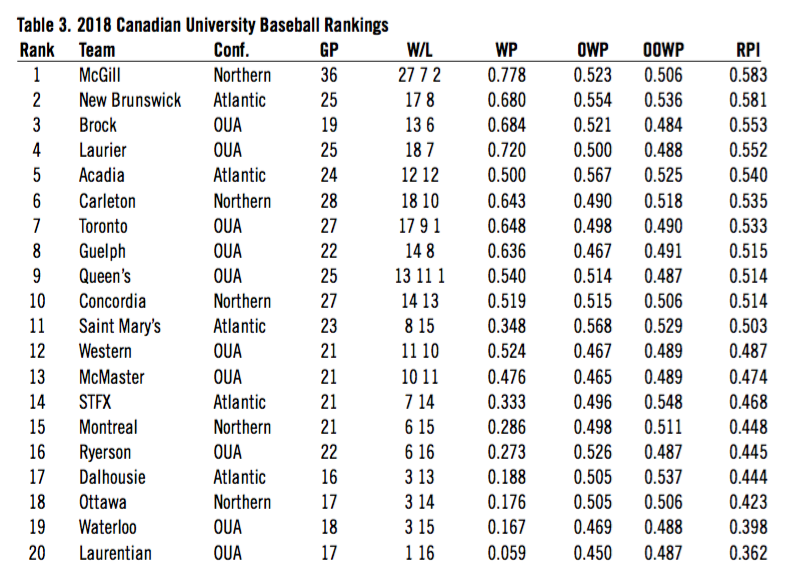
Applying the RPI calculation to our dataset by season we arrive at the following rankings for 2016, 2017, and 2018.
Table 1
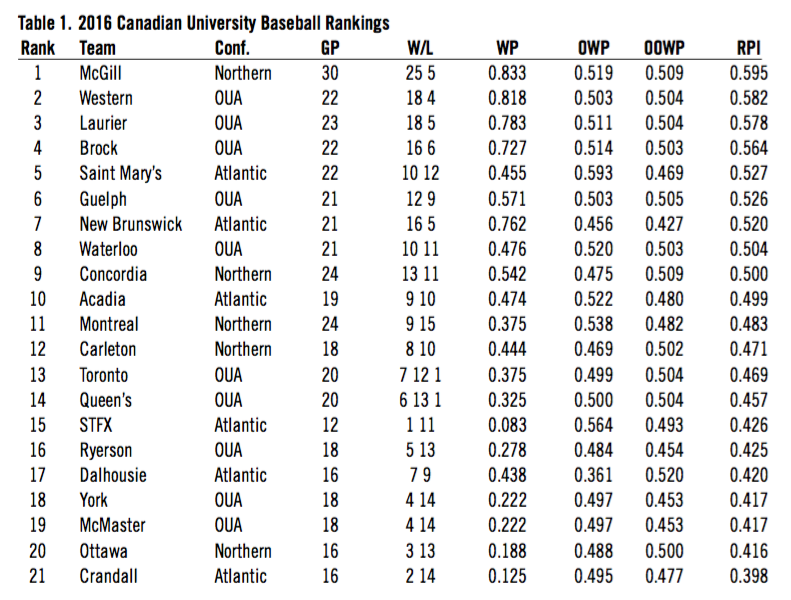
Table 2
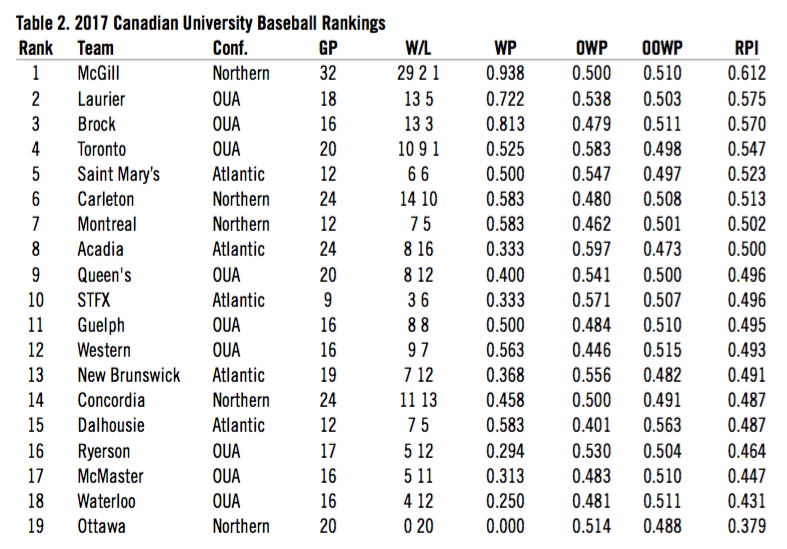
Table 3
(Click images to enlarge)
The results at the top end of the spectrum are not surprising. Teams that had excellent win-loss records and success in play-offs also placed very high in the overall rankings. McGill won three CCBA championships in this period and had the best overall win-loss record. They had won 30 consecutive league games until Carleton beat them in 2018.11 Not surprisingly, McGill ranked first in RPI in each season. The 2016 OUA champs, Western, ranked second in that year while perennially strong programs such as Laurier (2018 OUA champs) and Brock also ranked in the top five each season. Other notables include 2018 CCBA finalist New Brunswick and 2017 OUA champs University of Toronto who also finished in the top five in the years they made championship appearances.
There are some surprises from 6th to 10th however. Contrary to the common assumption that the Atlantic conference, which is made up of smaller schools, is not as strong as the Northern conference or the OUA, Atlantic teams Acadia or Saint Mary’s ranked above CCBA Northern teams like Concordia and Carleton in RPI. This can be better understood by paying closer attention to the way RPI is calculated in our discussion on limitations. Other RPI calculations, for example, have taken into account conference strength. We do not do so in this analysis.
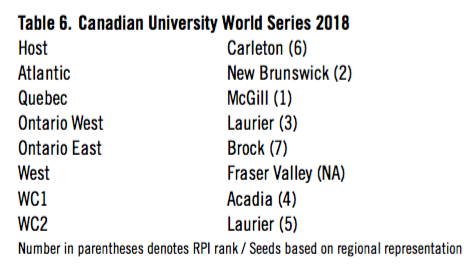
By way of illustration, we also seeded eight teams in a series of hypothetical Canadian University World Series for each of the 2016, 2017, and 2018 based on RPI and regional/conference representation. We selected the highest RPI ranked team by region. As was the practice in the CCBA, one spot is reserved for the host team. We simply reproduced those same hosts in our model. As the more isolated CCBC (West) did not play inter-conference games, included two-year colleges in its schedule, and was excluded from our calculations, we seeded the highest finishing four-year university team at the CCBC championship tournament as the western representative. Finally, as was the practice in the CCBA national championship, we made room for wild card entries. In our case, after regional seeds were determined, we took the next two highest RPI ranked teams that had not already been seeded.
Table 4
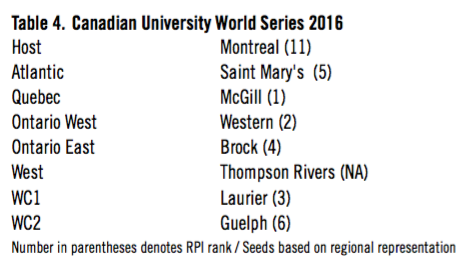
Table 5
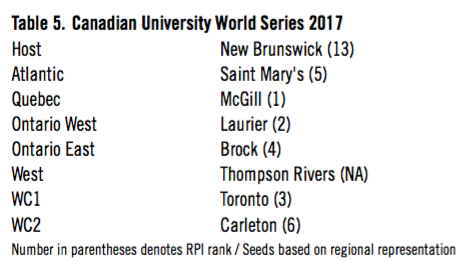
Table 6
(Click images to enlarge)
Once again, given overall win-loss records, playoff success, and standings, the teams represented in these make-believe national championships of university baseball are not controversial representatives. Each of these teams had very strong records with a history of success in their respective conferences.
Despite determining seeds based on conferences/regions and including host teams, most of the teams in each of the three successive hypothetical World Series we seeded had very high RPI rankings. If we eliminate the Western seed (CCBC), for which we have no RPI score, and the host team, for which placement is automatic, of the remaining qualifying teams, 6 of 6 (or 100%) in each of 2016, 2017 and 2018 were ranked in the top eight for RPI. Thus, despite regional seeding considerations, the CUWS consisted of the top teams in the country.
Of course, these hypothetical seeds are partially a post-facto mockup. Any agreed upon process that accepted a unified Canadian University World Series would set its own parameters around qualifications, regional representations, and even the number of teams included. We have simply adopted the closest approximation of existing practices in our model. In the process, however, the RPI seems to largely confirm the strength of baseball programs across the country as demonstrated in actual playoff and championship results over the last three seasons.
Limitations
As effective and convenient as RPI is for comparing teams, it also has one foundational flaw: no ranking system can compare how two teams would stack up against one another quite like having those teams play head-to-head. There is no way to fix this. Unless, of course, the University of New Brunswick in the Atlantic flies to St. Catharines in Central Canada to play Brock in a weekend double header, or Queen’s University in Eastern Ontario wants to travel to Wolfville, Nova Scotia to play Acadia. As we mentioned, this is highly improbable as it involves significant interprovincial and trans-Canada travel. Moreover, for win-loss records to be the basis of rankings, the schedule would have to be balanced and complete so one could properly seed teams based on head-to-head competition. In the absence of such a schedule, we have the RPI.
Yet, what many analysts particularly dislike about the RPI formula is that so much weight is placed on the question: “How good are the teams you play?” There are three accompanying limitations associated with this weighting that affects the rankings we have presented in this paper: (1) conference strength, (2) the use of post-facto results, and (3) the importance given to pre-season games. We deal with each of these below.
1. Conference strength
As mentioned, seventy-five per cent of the RPI calculation has nothing to do with the team itself and everything to do with how the teams it played performed, and how the teams that those teams played performed. A key problem with the formula is that a team can be rewarded more “RPI points” after losing to a great team than after defeating a bad team. This is because, as mentioned, 75% of the calculation is all about the rest of the league, and not the team in question.
From 2016 to 2018, OUA teams played CCBA Northern Conference teams 26 times in pre-season or inter-league competition. The vast majority of these games involved five-time CCBA champion McGill and, to a lesser degree, perennial runner-up Carleton: teams that posted high win percentages in league play. Not surprisingly, the CCBA Northern teams had a win percentage of .654 (16-8-2) against OUA competition over that three-year period.
Due to the limited amount of inter-conference competition, teams in the Atlantic were statistically firewalled from being beaten by their Northern conference opponents except in the CCBA national tournament. Moreover, the Atlantic conference typically had a less skewed differential in win percentage between teams resulting in higher OWP and OOWP compared to the Northern conference and OUA. Finally, Atlantic teams repeatedly benefited from taking turns losing, yes losing, to undefeated non-conference CCBA affiliate team Holland College that was included in results and standings but ineligible for playoff competition because of its 2-year college status. This causes significant problems for making sense of the final rankings.
By way of example, Saint Mary’s ranked higher in RPI than every Northern conference team except McGill in 2016 and 2017. Acadia did the same in 2018. Yet from 2016-2018 Acadia and Saint Mary’s were a combined 1-11 (.083) vs. Northern conference teams at the CCBA national championship, and were outscored 126-18.12 Despite these asymmetrical head-to-head results, Saint Mary’s (6-6) still outranked Carleton (14-10) Montreal (7-5), and Concordia (11-13) in RPI in 2017.
Conference asymmetry is a common issue faced by US ranking analysts who have built models to correct for Strength of Schedule (SOS) in RPI calculations.13 The RPIs are calculated here without SOS correction, though there is evidence to support the need for such corrections in future ranking systems. This is especially true considering the CCBC, like the Atlantic conference, does not play any inter-conference games with other Canadian university teams and includes non-university teams in its schedule.
2. Post-facto results
In this analysis we have used results that include CCBA nationals competition to allow for some inter-conference reliability (between Northern and Atlantic conferences of the CCBA) and to lend credibility to the notion that ranking Canadian university baseball teams from 1 to 20 is possible.
Of course, while we required these results to allow for a more robust statistical dataset, the results are based on games that should have ostensibly only taken place after RPI results were considered in deciding the teams receiving seeds to the championship. RPI scores in the future could not make use of these results except if calculations straddled two seasons as a rolling average or, more preferably, if teams intentionally played select inter-conference games as has already been happening in the OUA for 2019.
3. Pre-season games
Inter-conference games between OUA and CCBA Northern teams have been inconsequential on standings, rank, or seeding. Unlike their relevance in US college competition they have no bearing on how Canadian university baseball teams place, and in the absence of a unified national championship they are treated as exhibition games with little more than pride in the balance.
As a result, these games are often considered warm-ups for the season, when coaches test position players and pitchers, do not field their top lineups, and sometimes allow games to end in a tie. Given this reality, one could argue their use in our analysis is a dubious choice but, once again, without the inclusion of these results there would be no theoretical basis to rank OUA teams alongside CCBA teams.
Of course, if RPI was applied to these games and these results mattered for ranking seeds for a CUWS, this would surely change the nature of competition in these contests.
Conclusions
We have demonstrated the feasibility of using an RPI system for ranking Canadian university baseball teams across the country. No secondary ranking system can replace head-to-head play and qualifying playoffs, but in a short Fall season with limited inter-conference play the RPI could be useful for the future development of Canadian university baseball.
The RPI, as we have calculated it in this analysis, has limitations. It does not take into account conference strength, especially when inter-conference play is limited. It over-states the importance of pre-season and exhibition games and uses post-facto playoff results. All of these issues are correctable in future calculations of RPI, especially if there is a coordinated effort to make the results more reliable through planned inter-conference scheduling, as has been long-established in the NCAA.14
Despite its limitation, RPI is a relatively effective ranking system. While some organizations, such as NCAA basketball are using newer metrics,15 other programs such as state high school football associations are adopting the RPI.16 Indeed, there are just as many critics of these newer metrics as the RPI.17 Eight years ago, sabermetrics experts considered a potential ranking index (the PING) for NCAA baseball before regionals, super-regionals, and an accepted national qualification path to Omaha and the College World Series was established through head-to-head competition.18
Comparing a team’s strength of schedule through RPI is the best available, independent method for comparing teams that cannot play one another. Future formulas could take into account conference strength and control for non-conference results. In the end, the RPI offers a tested and objective method for ranking Canadian university baseball teams toward ascertaining their qualification for a potential Canadian University World Series.
GEORGE S. RIGAKOS is Professor of the Political Economy of Policing at Carleton University, where he also manages the university’s baseball program.
MITCHELL THOMPSON is a second year statistics student majoring in mathematics at Carleton University.
Notes
1 Canadian Collegiate Baseball Association. 2019. “History.” BaseballReference.com Accessed June 11, 2019. https://www.baseball-reference.com/bullpen/Canadian_Collegiate_Baseball_Association
2 Canadian Collegiate Baseball Association. 2019. “History.” Accessed July 25, 2019. http://ccba-abcc.pointstreaksites.com/view/ccba-abcc/about/history
3 The University of Windsor, across the river from Detroit, participate in the US-based National Club Baseball Association (NCBA) but were granted entry to the OUA provincial tournament from 2017. Similarly, the University of British Columbia (UBC), based in Vancouver, also plays across the border in the National Athletic Intercollegiate Association (NAIA) and does not compete against Canadian baseball teams. As neither team plays against Canadian university opposition they are omitted from this analysis.
4 U Sports is Canada’s national governing body for university sport, equivalent to the NCAA, and formerly named Canadian Intercollegiate Sport (CIS).
5 National Sport Organizations (NSOs) in Canada are legislatively recognized bodies for the management of amateur sport in the country. There are currently 58 NSOs in Canada — Baseball Canada oversees amateur baseball.
6 George Rigakos, “A beginner’s guide to Canadian university baseball.” Canadian Baseball Network. (December 16) Reposted. Accessed June 11, 2019. https://www.curavensbaseball.com/a-beginners-guide-to-university-baseball-in-canada/
7 The demise of the CCBA and the appearance of the ACBA were announced through social media on Facebook July 25, 2019. https://www.facebook.com/CanadianUniversityBaseball/photos/a.2070884913221857/2258906037753076/?type=3&theater and the takeover of the former CCBA account by ACBA on Instagram: https://www.instagram.com/atlanticcba/
8 “How to Calculate RPI and What it Means to Handicappers.” madduxsports.com. Accessed February 3, 2019. http://www.madduxsports.com/library/cbb/how-to-calculate-rpi-and-what-it-means-to-handicappers.html
9 Alex Kirshner, “Yes, USC should have made it to the NCAA tournament.” SBNation. (March 11) Accessed July 9, 2019. https://www.sbnation.com/college-basketball/2018/3/11/17104676/usc-snub-ncaa-tournament-march-madness-2018
10 In 2018, the University of Calgary applied for membership in the CCBA and was accepted but ultimately could not participate as no other western team agreed to play them in a qualifier — a condition set out by the CCBA. The principle author of this paper is also the former President of the CCBA who received the application and membership cheque from the University of Calgary. A provisional agreement was worked out where if at least four members of the CCBC also joined the CCBA the top finisher in the preceding year would be invited to the CUWS. While these conditions were never satisfied, such staggered seedings are not alien to Canadian baseball. The same principle is applied during Baseball Canada’s Sr. men’s championship and in much international baseball competition. For university baseball, of course, the limitations are obvious. Depending on turn-over senior student-athletes graduate and freshmen arrive, the complexion and competitiveness of the team will also change.
11 CU Ravens Baseball. 2018. “McGill’s historic winning streak snapped by Carleton at 30 games.” (September 10). Reposted from CCBA. Accessed July 8, 2019. https://www.curavensbaseball.com/mcgills-historic-winning-streak-snapped-by-carleton-at-30-games/
12 Their only win came in 2016 when Saint Mary’s upset McGill in round-robin play 3-2.
13 James, Crepea, “Pac-12 weighing 20 game basketball schedule, massively raising non-conference standards.” Oregon Live. (May 1) Accessed July 8, 2019. https://www.oregonlive.com/collegebasketball/2019/05/pac-12-weighing-20-game-basketball-schedule-massively-raising-non-conference-standards.html
14 Of course, it cannot go unstated that some teams will attempt to manipulate their inter-conference schedule to best boost their RPI. See: Jesse Newell, “How KU basketball won the scheduling game… again.” The Kansas City Star, June 29, 2018. Accessed September 12, 2019. https://www.kansascity.com/sports/college/big-12/university-of-kansas/article214096929.html
15 Marc Tracy, “R.I.P. to the R.P.I.: Selection committee breaks out new math,” New York Times, March 15, 2019, Accessed July 8, 2019. https://www.nytimes.com/2019/03/15/sports/ncaa-bracket-selection-sunday-net-rating.html
16 C. Carnahan, “Football RIP ranking system clears final hurdle for 2019.” Orlando Sentinel,January 28, 2019. Accessed June 1, 2019. https://www.orlandosentinel.com/sports/highschool/os-sp-hs-fhsaa-football-0129-story.html
17 Neil Greenberg, “The NCAA’s lousy new metric is going to make March Madness even crazier,” Washington Post, December 18, 2018. Accessed July 8, 2019. https://www.washingtonpost.com/sports/2018/12/18/ncaas-lousy-new-metric-is-going-make-march-madness-even-crazier/?noredirect=on&utm_term=.8a5887a2f735
18 Philip Yates, “The PING ratings: A method for ranking NCAA baseball teams,” SABR Baseball Research Journal, Fall 2011. Accessed July 9, 2019. https://sabr.org/research/ping-ratings-model-rating-ncaa-baseball-teams