
The 20/30 Game Winner: An Endangered/Extinct Species
This article was written by John Daniels - Steve Kuehl
This article was published in Fall 2013 Baseball Research Journal
INTRODUCTION
This paper has two parts. Part I: The Demise of the 20-Game Winner is a statistical analysis on the history of 20-game winners and possible factors contributing to their decline. Part II: A Tale of Two Pitchers is a qualitative analysis comparing two historic pitching seasons—Denny McLain’s 31 wins in 1968 and Justin Verlander’s 24 wins in 2011—in an attempt to better understand pitching success from two different baseball periods.
PART I (THE DEMISE OF THE 20-GAME WINNER)
In the so-called modern baseball era (1901–2012), becoming a 20-game winner was regarded as a threshold to All-Star status. Consistent winners of 20 or more games were regarded as staff aces, were usually paid more, and often won postseason pitching awards. Like hitting .300, winning 20 games was the plateau that separated the good from the elite.
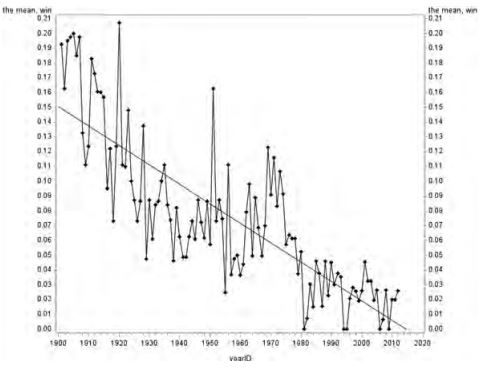
Twenty or more wins have been reached 814 times from 1901 through 2012. Considering only the top five pitchers in terms of Games Started (GS) for each staff, 20 wins for this defined group of regular starters has occurred 6.86 percent of the time (814 of 11,867). As shown in Figure 1, the number of 20-game winners divided by the number of qualifying starting pitchers (top five starters for each team), has been in steady decline.
Figure 1: Percentage of 20-game winners for #1 through #5 Starters (1901–2012)
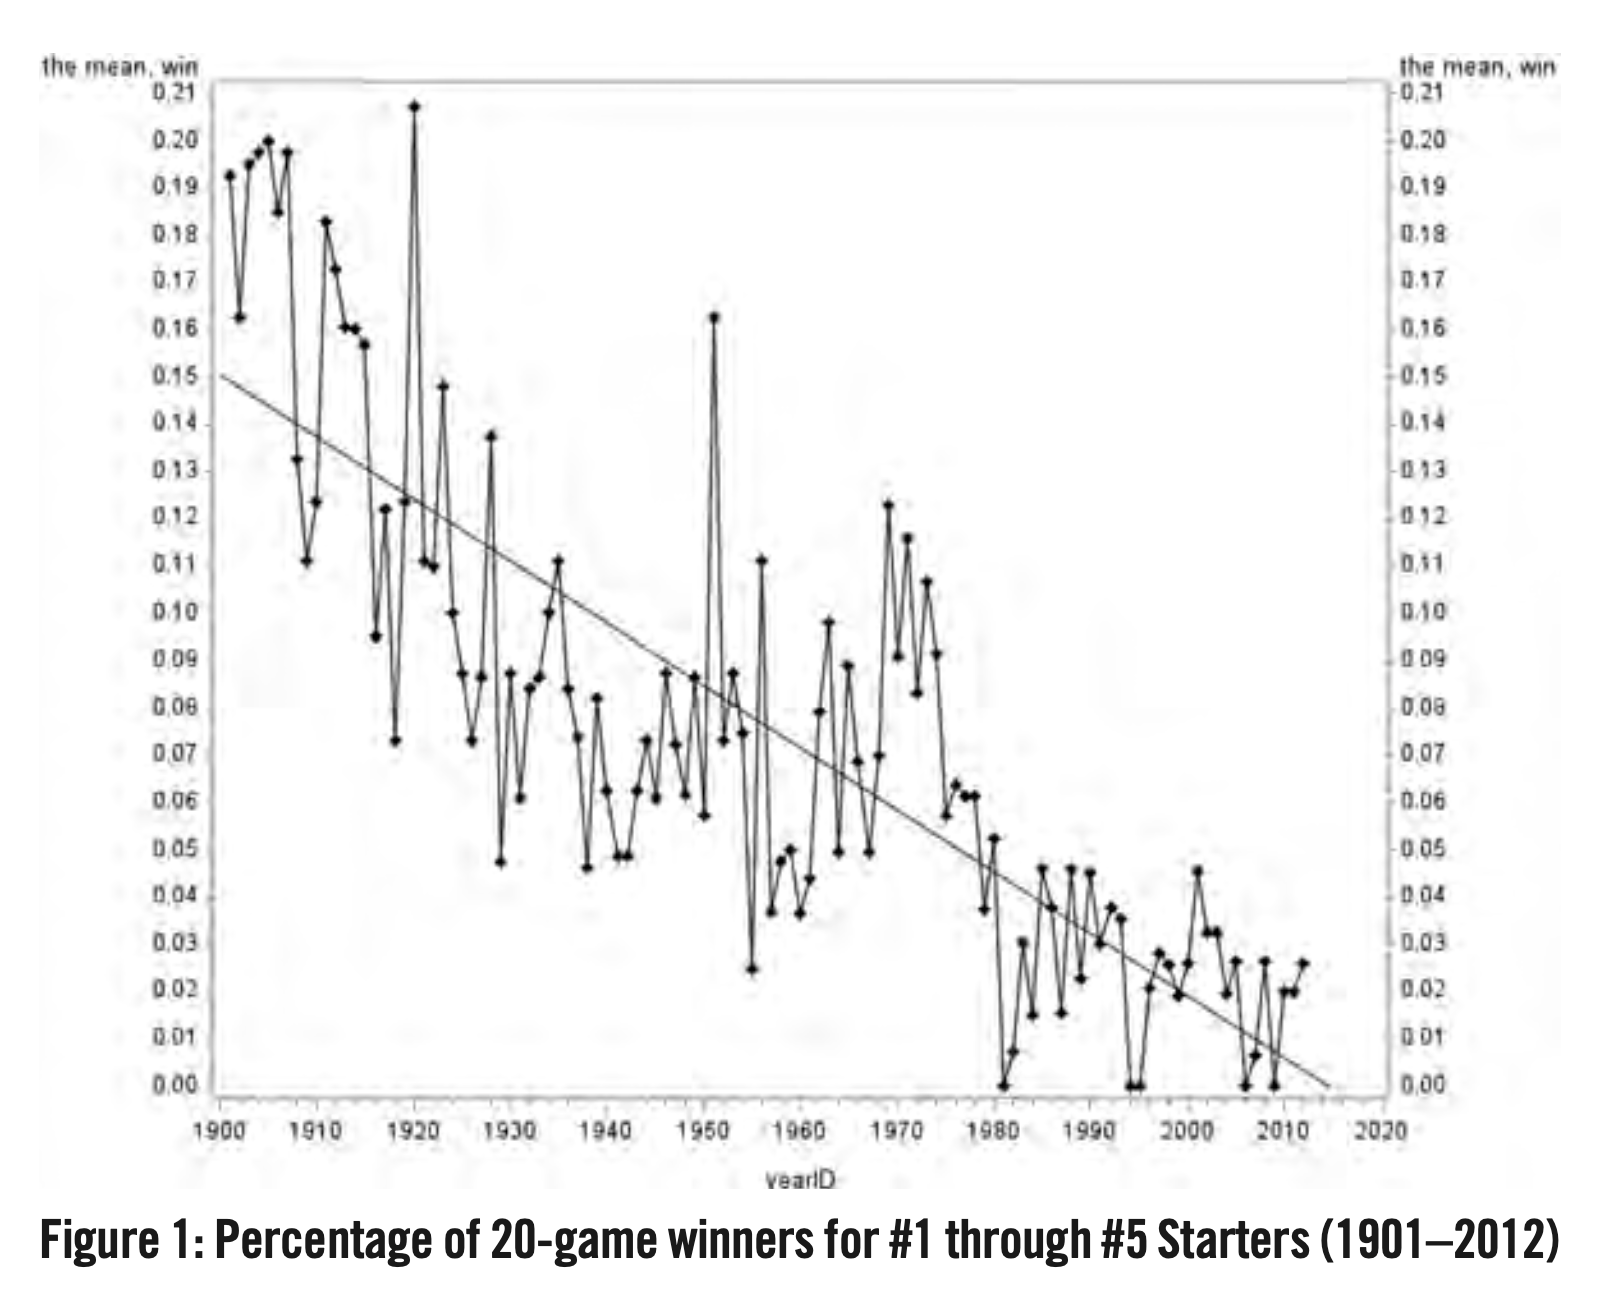
Although there appear to be some upper anomalies in this trend (1920, 1951), note in 2006 and 2009 we see the first two non-strike seasons that have no 20-game winners at all. Recall the increase from 1960 to 1962 in team games played from 154 to 162—an increase in potential wins for a starter. More games are being played, but fewer pitchers are winning 20 games. Why? Clearly, this drastic drop-off in 20-game winners indicates some systemic change, either from a strategic standpoint, quality of pitching, or some fundamental modification to the game itself. A roundtable discussion of knowledgeable baseball fans will yield multiple opinions on this topic. But opinion should be backed up with empirical evidence. We should not confuse symptoms (results) with the underlying causes. This paper will attempt to distinguish between them. The reasons, certainly not an exhaustive list, to be examined in this paper include:
1. Change in Games Started (specifically 4- to 5-man rotations)
2. Change in Number of Innings Pitched for a Starter.
3. Change in the Number of Decisions for a Starter
4. The Designated Hitter
Each of these issues will be examined for their significance as an influence on 20-game winners and then, if determined to be a symptom, will be further analyzed for the root cause. Finally, to make sure nothing important was missed, a qualitative assessment of two famous Detroit Tigers pitchers will be done. We will examine Denny McLain’s 1968 and Justin Verlander’s 2011 seasons start by start. How was Denny McLain able to become the first 30-game winner since Dizzy Dean (1934) when other, more accomplished pitchers, failed? Although Justin Verlander “only” won 24 games in 2011, what kept him from winning 30?
To begin, let’s look at the four reasons proposed.
1. CHANGE IN GAMES STARTED (SPECIFICALLY 4- TO 5-MAN ROTATIONS)
To ignore spot starts, temporary minor league call-ups, and the additional pitching demands caused by doubleheaders, rain-outs, make-up games, etc. only the pitchers with the top five Games Started (GS) totals for each team’s pitching staff were analyzed. Figure 2 plots the percentage of team games started 1901–2012 by the #1 through #5 starting pitchers (#1 had the most GS, #2 second most, etc.).
First, overlooking the labor disputes of 1981, 1994, and 1995, note the overall trends in these plots as indicated by the trend lines. The mean number of starts for the #1 starting pitchers has shown a slight decrease over time (about one fewer start every 78 years and NOT statistically significant) while starters #2, #3, #4 and #5 have shown slight increases (again, not statistically significant).
Further, when examining the micro trends for starters #1, #2, and #3, as opposed to the overall trend, there is generally a decreasing trend in the games started from 1901 to 1945. There could be a variety of reasons for this, possibly a manager’s attempt to prolong a good pitcher’s season or career or perhaps the evolution of the major league pitching staff, but those are simply educated guesses and beyond the scope of this paper. Perhaps a baseball historian could provide more insight into this situation.
Figure 2: Mean Games Started by #1 through #5 Starting Pitchers (1901–2012)
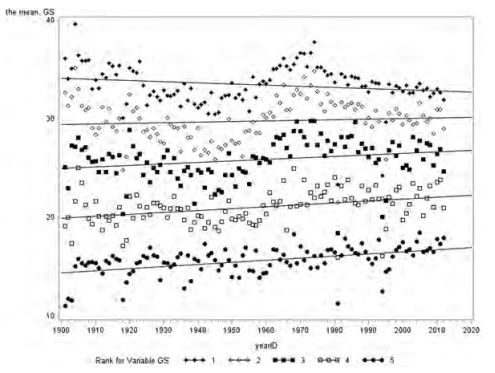
Returning to Figure 2, an upward trend for #1, #2, and #3 begins around 1946 and continues until about 1974. After 1974 the downward trend begins again. Mean GS, at least for the #1 starter, is now back where it was in the 1930s and 1940s.
In terms of starter #4, we can also faintly observe these micro trends, although there is an increase in GS variability due to perhaps different pitchers sharing this particular role for a team. Unlike #1, #2 and perhaps #3, the #4 starter wasn’t always the same person. This is certainly true by the time the #5 starter is reached.
Another interesting result is that 1901–60 (154 game schedule), #1 starters averaged 33.5 GS per season. From 1961 through 2012 (162 game schedule), #1 starters averaged 33.3 games. So although—in theory at least—a #1 starter would have perhaps two additional starts resulting from the longer schedule, it hasn’t shown up in the results. Note that 154 games with a 4-man staff yields 38.5 starts per pitcher whereas 162 games with five starters yields only 32.4 starts per pitcher. If a pitcher gets six fewer average starts per season, could that be the reason 20 or 30 wins is not being realized as often? Unfortunately, the data just don’t support this supposition. Average GS in 1901–60 is almost the same as average GS in 1961–2012. Yet in the former era 10.6 percent of starters were 20-game winners, while in the latter only 4 percent were.
Although the trend for #1 Starters appears to be slightly decreasing, there really isn’t much difference in percentage of GS between the pre-1975 time (1975 arbitrarily selected for the beginning of “formal” 5-man rotations) and post-1975. Table 1 shows this result.
Table 1. Comparison of Percentage of Team Games Started (Pre-1975 versus Post-1975)
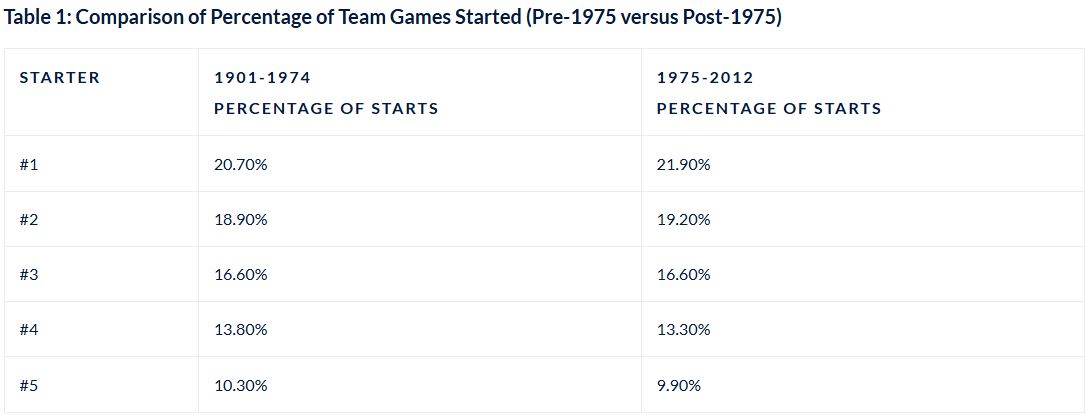
As seen in Table 1, the percentage of team games started for #1 and #2 starters is actually slightly higher in the 5-man rotation “era”, while the percentages for #4 and #5 starters have slightly decreased. One might conclude that since the percentages for all starters has not changed significantly, teams were already using 4+ starting rotations before such a practice became the norm in the 1970s. Certainly, it appears that the movement to a regular 5-man starting rotation is NOT a significant factor in the decrease in 20-game winners. #1 starters are still getting the same number of GS.
Figure 3: Mean IP for #1 through #5 Starting Pitchers (1901–2012)
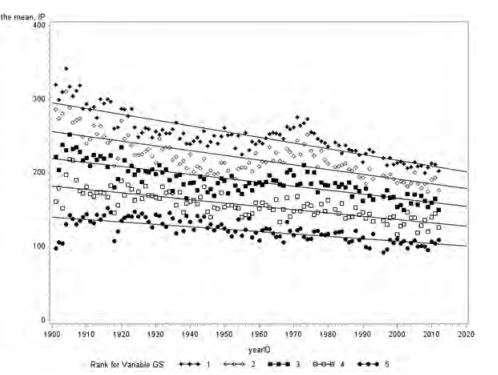
To paraphrase Section 10.17 of the Official Rules of Major League Baseball; If a starting pitcher pitches at least five innings, and leaves the game with his team in the lead, or his team takes the lead in their half of the inning, he gets credited for the win if his team continues to keep the lead and wins the game. Frank Williams (1982) correctly points out that in the early years, these rules did not exist and the selection of the winning pitcher was at the discretion of the Official Scorer. Perhaps this might alter the pitching statistics by a win or two and this fact should be mentioned here for the sake of credibility. Obviously, a starter who pitches all nine innings and wins is in complete control of his pitching destiny. Otherwise, earning the win depends in part on the bullpen as well as other factors outside the starting pitcher’s control. Figure 3 shows the change in IP for Starters #1 through #5 over the last 112 years.
Omitting the labor dispute years of 1981, 1994, and 1995, mean IP has been steadily decreasing for all starting pitchers. Although there appears to be an interesting period of increasing IP from around 1969–74, at least for #1 starters, overall the trend is down. So, although GS has remained relatively constant, IP has been on the decline. How these results actually affect the number of 20-game winners will be discussed in the next section.
3. CHANGE IN THE NUMBER OF DECISIONS FOR A STARTER
Decisions are simply defined as Wins + Losses. By leaving before the ninth inning, the starting pitcher might lose his status as the pitcher of record and not get either a win or a loss. A good bullpen can at best preserve a Win or turn a loss into a No Decision. A bad bullpen can turn a Win into a No Decision or perhaps even a loss for the starter if inherited runners are allowed to score.
Figure 4: Some Statistics for #1 Starting Pitchers (1901–2012)
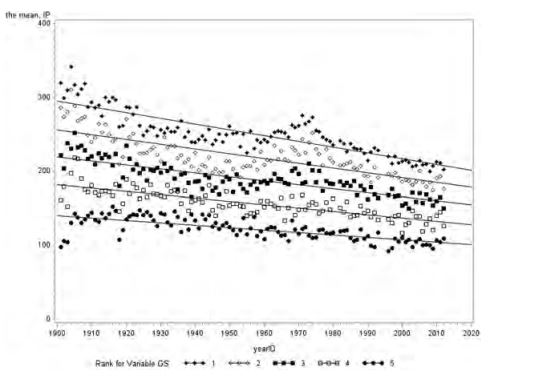
Figure 4, although a bit crowded with information, has some fascinating results regarding the influence of IP on Decisions. This in turn will affect the number of 20-game winners.
First, note the Decisions/IP line at the very bottom using the vertical axis on the right as the scale. This line is remarkably consistent for the last 112 years. Decisions/IP remains relatively constant (10.8% to 12.1% with a mean of 11.5%). Then it becomes obvious that if IP decreases (see Figure 2) then the number of decisions a pitcher gets will also proportionally decrease. This certainly makes intuitive sense. If a starting pitcher leaves the game earlier for strategic reasons (meaning fewer IP), the number of Decisions (Wins + Losses) he has will also decrease. For example, in 1968 the mean IP for a #1 starter was 262.78. Using the average Decisions/IP of 11.5%, we might expect around 30 decisions (the mean was actually 29.3 Decisions for that year). In 2011 the mean IP for a #1 starter was 211.19. Again, we might expect only 24 decisions (the mean was in fact 24).
Looking above the Decisions/IP line, in the middle of the graph, is the percent of 20-game winners for #1 starters only. Again, using the vertical axis on the right as our scale, we see this percentage is decreasing. This is the same result as Figure 1 and the reason this paper was written in the first place.
Now, the top line examines the trend as to how deep a #1 starter gets into a game. This line shows IP/GS using the vertical axis on the left as a reference. Since it has already been shown that GP has remained constant while IP has decreased, we would expect this statistic to show a decreasing trend, and of course it does.
In 1901 the average IP per GS for #1 starters was 8.76 or almost a complete game. By 1975, this had dropped to 7.03. In 2012 the average IP per GS was 6.31 or barely into the seventh inning. This statistic does not account for a #1 starter acting in a relief role, which was more common in the early part of the century and may perhaps inflate these values slightly. But the point here is that starting pitchers, certainly #1 starters, aren’t around when the outcome of a game can change.
It would be interesting to investigate, especially on excellent teams, how often a starter would leave early with his team losing or tied that eventually resulted in a win for the bullpen. Starters from earlier eras would have been around long enough to get credit for the win. Not so much today. Today the starter gets a No Decision instead of a win. Perhaps this spawned the metric Quality Starts.
The reasons for the decline in IP/GS are perhaps numerous, but two possible circumstantial causes are suggested:
1. The development of the situational bullpen as an effective managerial strategy.
2. Escalating pitcher salaries along with long term contracts, which place a premium on protecting a starter’s health and career. Most, if not all, starters are now on strict pitch counts and this number is certainly tracked throughout a game.
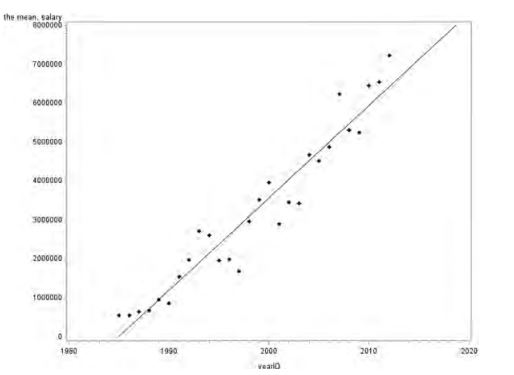
Although it is no secret baseball salaries have continuously increased, Figure 5 is a graph that shows average #1 Starting Pitcher salaries at least from 1985. Reliable data were not available prior to this time, although one would expect salaries to be lower than they are today.
Figure 5: Average Salaries for #1 Starting Pitchers 1985-2012
Certainly, there are other possibilities but these two explanations immediately come to mind. It is simply common sense that if a pitcher leaves the game in the sixth or seventh inning, with his team leading at the time, that the win is not guaranteed nor in his direct control. The quality of the bullpen, team fielding, clutch hitting, the bench, and occasionally the weather can all influence the final outcome of the game.
4. THE DESIGNATED HITTER
Intuitively, one would believe that the American League would have starting pitchers in the game longer since pinch hitting in the late innings would not be necessary. Although IP has drastically decreased overall, does the DH (introduced in 1973) have any positive effect on a pitcher staying in the game longer? Or do pitch counts and the bullpen trump everything? Let’s examine the differences between the AL and NL 1974–2012. Dividing some of the information from Figure 3 into the AL and NL, for the 1974–2012 period, we can see in Table 2 (next page) that DH might contribute to an average of about five more innings pitched and one additional decision over an entire season, but has no real influence on the difference in average length of a start (less than one-third of an inning for IP/GS).
Table 2: #1 Starter Statistics for AL versus NL, 1974-2012
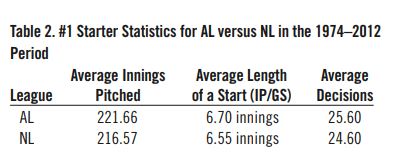
Given the detectable, but small influence the DH has, it still appears that perhaps other factors (situational bullpen, pitch count) have more influence than the DH does.
PART 2: A TALE OF TWO PITCHERS
On September 14, 1968, in front of 33,688 fans on a Saturday in Detroit, Dennis McLain stuck-out 10 batters in a 5–4 win over the Oakland Athletics to become the first 30-game winner since Jay “Dizzy” Dean (St. Louis Cardinals) in 1934. He is also the last pitcher in Major League Baseball to win 30 games in one season.
To summarize, Table 3 is McLain’s list of select statistics for 1968.
Table 3. Denny McLain — 1968 Select Statistics
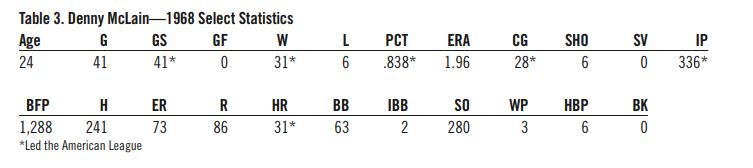
It appeared that Denny McLain pitched deep into his games (28 CG) and as will be seen, benefited by playing on the 1968 World Series winner. The 1968 Tigers, like most championship teams, were legendary in their ability to come from behind. Not only during the regular season; they also fell behind three games to one to Bob Gibson and the St. Louis Cardinals, but eventually won the World Series.
After going through the game logs for each game that McLain started in 1968, it was found that six of his 31 wins could be considered “lucky” wins. By “lucky” it means the team came from behind in the late innings to make McLain the winning pitcher. Those six wins, which could have also ended up as No Decisions or Losses if McLain pitched today, are described as follows:
• May 20, 1968: McLain pitched 10 innings and gave up 3 earned runs. In the top of the 9th inning, Willie Horton hit a home run to tie the game which Detroit won in the 10th.
• June 5, 1968: McLain pitched 6 innings and gave up 3 earned runs. At the time that McLain was pulled from the game, after pitching in the bottom of the 6th inning, the Tigers were losing 4 – 1. In the top of the 7th inning the Tigers scored 4 runs, thus making McLain eligible for the win. The Tigers won the game, giving McLain the win.
• June 16, 1968: McLain pitched 7 innings and gave up 1 earned run. At the time that McLain was pulled from the game, after pitching in the bottom of the 7th inning, the Tigers were losing 1 – 0. In the top of the 8th inning the Tigers scored 5 runs, thus making McLain eligible for the win. The Tigers won the game, giving McLain the win.
• July 7, 1968: McLain pitched a complete game and gave up 4 earned runs. McLain had blown the lead in the top of the 6th inning and could have been relieved. He continued to pitch and Willie Horton hit a walk-off home run in the bottom of the 9th, giving the win to McLain.
• July 23, 1968: McLain pitched 7 innings and gave up 4 earned runs. After pitching his 7th inning, the Tigers were losing. In the top of the 8th inning the Tigers tied the game, pinch-hit for McLain, and then took the lead. This made McLain eligible for the win and the Tigers went on to win the game, again giving McLain the win.
• September 14, 1968: McLain pitched a complete game and gave up 4 earned runs. The Tigers were losing 4–3 in the 9th inning and scored 2 runs to win on a walk-off single in the bottom of the 9th, giving McLain his 30th win of the season.
If the Tigers hadn’t come from behind in these games, McLain would have won only 25 games in 1968. He pitched in 336 innings, unheard of today, so he naturally had more decisions. He played on a championship team that came from behind and got him six additional wins.
For comparison, look at the season that Justin Verlander had in 2011. On September 18, 2011, Verlander won his 24th game of the season. This was the most games won by a starting pitcher in the American League since Bob Welch in 1990 for the Oakland Athletics. By the end of the season, Verlander had won the Triple Crown for pitching in the American League, meaning a particular pitcher leads their league in wins, strikeouts, and earned run average.
Throughout the season, Verlander never had an outing in which he pitched fewer than six innings or 100 pitches (note in 2011 we are counting pitches). Through the 2011 season, Verlander had the best career strikeouts-per-9-innings-pitched average in Tigers’ history (8.3), and the second-best career win-loss average (.652).
This was the first time since Roger Clemens (1986) that the American League Most Valuable Player award was given to a starting pitcher, and the fourth time in Tigers’ history (Dennis McLain once and Hal Newhouser twice); Verlander edged out Jacoby Ellsbury of the Boston Red Sox 280 votes to 242. In addition, Verlander was unanimously named the American League Cy Young award winner.
Table 4 contains a list of some select pitching statistics for Verlander in 2011.
Table 4. Justin Verlander — 2011 Select Statistics

Relative to his peers, Table 5 notes the following comparisons to AL #1 Starters and Denny McLain in 1968.
Table 5. McLain (1968) and Verlander (2011) versus their Peers (#1 Starters).
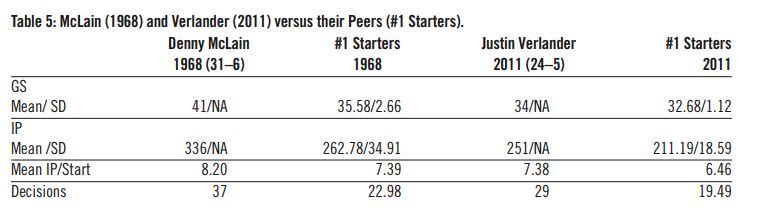
In examining Table 5, we can see McLain was (41–35.58)/2.66=2.04 standard deviations above the mean for GS, while Verlander is 1.18. Clearly, even by 1968 standards, McLain was a workhorse; it appears he never missed a start. For IP however, Verlander was (251–211.19)/18.59=2.14 standard deviations above the 2011 mean, versus 2.10 above the 1968 mean for McLain. McLain had more GS, relative to his peers, than Verlander but did not necessarily pitch more innings relative to his peers than Verlander. McLain was a product of conventional baseball wisdom in 1968. He did what was expected of a #1 starter: finish the game. He was not restricted by pitch counts nor set-up men nor closers. For his 31 wins, McLain was paid a salary of less than $90,000 (his 1970 Tigers salary before being traded). Verlander made $12,850,000—more than 142 times McLain’s 1970 baseball salary. One must also consider McLain’s World Series performance. He lost Game One and Game Four to Bob Gibson and beat Ray Washburn in Game Six. Could his arm have been tired out by the time October rolled around? Perhaps pitch counts and situational bullpens show some wisdom.
Going through the game logs for each game that Verlander started in 2011, unlike with McLain, I found none of his wins could be considered “lucky wins”. Verlander had a solid outing in each of the starts that he won; he pitched deep into games, for his time, and gave up very few earned runs. His team made no miraculous comebacks after he was pulled, had no walk-off hits, etc. while Jose Valverde was 49/49 in save opportunities.
A major difference between McLain in 1968 and Verlander in 2011 was the fact that McLain usually pitched every fourth day, whereas Verlander pitched every fifth day. This could give McLain up to eight more starts (162/4 versus 162/5). In fact, McLain started seven more games than Verlander. So although the figures demonstrate that average GS has not changed much over the years, there can be notable exceptions at the extremes. McLain had more starts, pitched deeper into games, and belong to a team that got him six wins that he wouldn’t have probably earned in 2011 because the bullpen would have earned those comeback decisions. Judging from Verlander’s win-loss percentage in 2011, starting seven more games he would have won six of them. Thus, one may assume that Verlander might have also won 30 games in McLain’s era. This is how close the seasons that McLain and Verlander had. If a few things had happened differently, McLain might have won only 25 games in 1968.
CONCLUSION
After examining these two pitchers, and what happened during their seasons, it is possible to conclude that a pitcher will never win 30 games in a season again. It would take not only a dominating season, but an incredible amount of luck to even get close to winning 30 games.
So, to summarize our findings, we review the following:
1. Mean Games Started has remained relative constant. In spite of the increase to 162 games and the formally defined 5-man starting rotation, GS has had no real effect on the percentage of 20-game winners. At the extremes, it might have given us our last 30-game winner.
2. Mean Total Innings Pitched has been in decline. Pitch counts and situational bullpens result in earlier exits for starting pitchers. This has certainly affected the percentage of 20-game winners, but is actually a symptom of the underlying causes.
3. No Decisions: Decisions/IP has remained constant. If IP decreases, decisions decrease also. This has affected the percentage of 20-game winners, but is also a symptom of the underlying causes.
4. The Designated Hitter has had very little effect on how long a starter pitches into a game and has had no real effect on 20-game winners.
Note “underlying causes” have been mentioned but not yet identified. What are these causes? One could argue pitch counts and situational bullpens, but are these symptoms of yet another cause? Could the real cause be protecting the health of expensive pitchers? Economics is a powerful motivating factor. Could the cause be protecting pitching arms for the postseason? A World Series trophy could also be such a factor. Is there another cause that hasn’t been considered? I would invite baseball researchers to ponder these ideas and consider others.
These findings show that the 30-game winner, although not extinct, would be an unlikely occurrence today. Pitchers are not in enough games to garner the needed wins. Justin Verlander could have won 30 games in 2011—if he had won every single start. Not likely, but certainly possible. After seeing Miguel Cabrera win the first Triple Crown in 45 years, perhaps the impossible is possible.
JOHN E. DANIELS is Associate Professor of Statistics at Central Michigan University. He is young enough to have no recollection of Bill Mazeroski’s 1960 home run against the Yankees, but old enough to remember Ron Swoboda’s catch in Game 4 of the 1969 World Series (an afternoon game, if you can imagine that.) A lifelong Detroit Tigers fan, John never knew all those years spent playing Strat-o-matic in the basement would amount to something so useful or so enjoyable. John has been a SABR member since 2007, can be reached at danie1je@cmich.edu, and spends his days thinking about Ernie Harwell’s reincarnation and being humbled by Miguel Cabrera’s destruction of his 2008 BRJ Triple Crown article.
STEVE KUEHL is Mathematics Instructor at Silver Lake College. He received his Master’s Degree from Central Michigan University, where he worked on multiple baseball statistics research papers with John Daniels. Also a lifelong Detroit Tigers fan, his hope is to see them win a World Series, since it hasn’t happened in his lifetime. He has always enjoyed numbers and baseball. Steve can be reached at sgkuehl@mtu.edu, and spends his days watching Tigers baseball and hoping that Miguel Cabrera can win back-to-back Triple Crowns.
References
Lahman, S. Lahman’s Baseball Database (version 5.5). www/baseball1.com (2007).
Williams, Frank J. “All the Record Books are Wrong.” The National Pastime, Vol. 1 (Fall 1982).