

The Cy Young Award: Individual or Team Recognition?
This article was written by Monte Cely
This article was published in 2006 Baseball Research Journal
The Cy Young Award is Major League Baseball’s premier annual recognition of pitching achievement. While only one outstanding pitcher in each league is presented the award, is that honor fundamentally an individual, or a team, recognition?
The Cy Young Memorial Award was established in 1956 by baseball commissioner Ford Frick to honor the best pitcher in major league baseball. The award is named for pitching great and all- time wins leader Denton True “Cy” Young, who had passed away in 1955. The Cy Young Award winners are selected by the Baseball Writers Association of America. During the first 11 years of the award, from 1956 to 1966, only a single winner was selected for all of Major League Baseball. Don Newcombe of the Brooklyn Dodgers was the first recipient. Immediately after Commissioner Frick retired, the rules were amended to provide for a winner from each league.1
After a voting tie in 1969 resulted in the American League award being given to both Denny McLain and Mike Cuellar, the voting rules were adjusted to allow the BBWAA voters to cast “weighted” votes for first, second, and third places.2 Criteria for the voting is minimal, with the ballot instructing the sportswriters to “vote for the best pitcher.”
Data Collection
To test the existence of a fundamental influence in Cy Young Award selection, a set of statis- tics needed to be collected and categorized.
In his book The Neyer/James Guide to Pitchers (co-authored with Rob Neyer), Bill James presents a method, based upon past statistics, to predict the winner of the Cy Young Award. His method determines a number of Cy Young “points” (or CYP) awarded to a pitcher, based upon a linear equation using various weightings of the following statistics: Innings Pitched, Earned Runs, Strikeouts, Saves, Shutouts, Wins, Losses, and a Victory Bonus. The Victory Bonus is awarded if the pitcher’s team wins their respective division champion- ship. James’ CYP formula did indeed predict two of the four CYA winners in 2004 and 2005: Johan Santana (AL 2004) and Chris Carpenter (NL 2005).3
As in the earlier NL edition of this paper, my purpose is not to propose a new or enhanced method to predict Cy Young Award winners, but rather to look retrospectively at the relative influence of team versus individual accomplishments on that selection. I found James’ CYP formula useful as a guide toward the key statistics. Consequently, I continue to use the following performance statistics for this study:
- Individual Performance: ERA, Strikeouts, WHIP, Innings Pitched
- Team Performance: Wins, Win %, Saves, Team Wins & Team Finish
Analyses and Discussion
Appendix 1 recaps the 46 National League Cy Young Award winners, their pertinent statis- tics, and league rankings for those statistics.4 Correlations, in descending frequency, in terms of the number of times that the NL Cy Young Award winner led in the performance categories, are as follows:
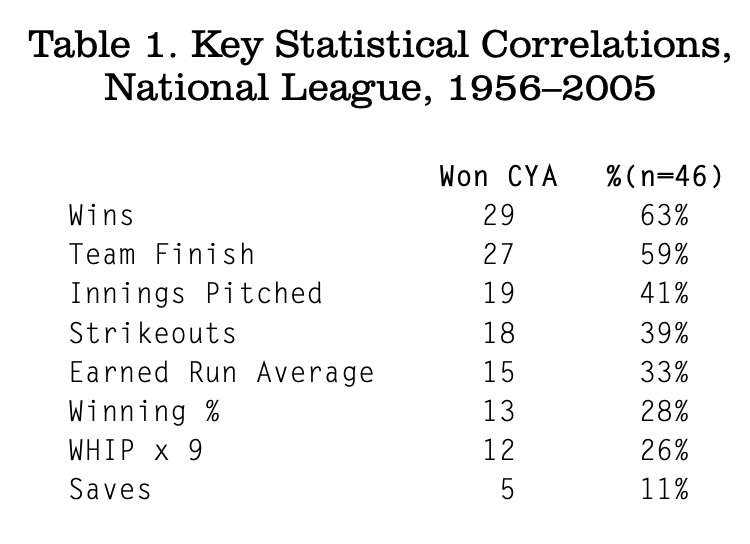
This high-level analysis shows that two team- oriented accomplishments, Wins and Team Finish, are most highly correlated with winning the NL Cy Young Award, and in fact are the only statistics in this study that reflect frequencies of higher than 50% in the National League. Among the individual-oriented statistics, Innings Pitched had the highest frequency, at 41%—ahead of the stats that seem to get the most attention, ERA (33%) and Strikeouts (39%).
Let’s look at the American League Cy Young Award winners. Appendix 2 lists the 44 AL award winners, their key statistics, and season rankings for those statistics. (Remember that during the first 11 years of the Cy Young Award, only one award was given for the entire major leagues. There was also a tie resulting in two AL awards being given in 1969. Consequently, the number of awards for the NL and AL are not equal.) Key correlations are as follows:
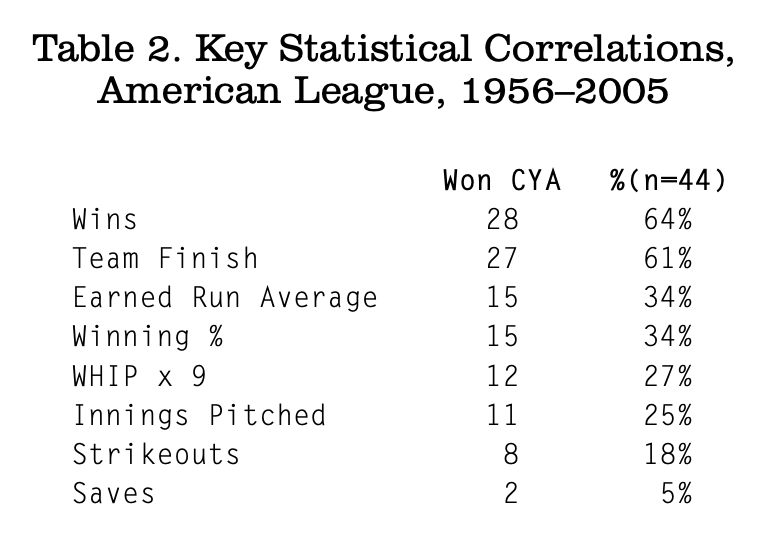
As is the case in the National League, Wins and Team Finish are most highly correlated with winning the AL Cy Young Award. In fact, the correlation is slightly (though not significantly) stronger than in the NL. ERA leadership is most highly cor- related among the individual statistics in the AL, at 34%. Strikeouts and innings-pitched leadership show a much lower correlation in the AL than in the NL.
Evaluating the impact of league statistical leadership is problematic when it comes to those relief pitchers that have won the Cy Young Award. In general, relievers either don’t rank or don’t qualify (due to their lower number of innings pitched) for leadership in many of the key statistical pitching categories. It is noteworthy that, of the four AL relief pitchers that have won the Cy Young, two of them (Sparky Lyle in 1977 and Willie Hernandez in 1984) did not lead in saves during their award-winning seasons. Over in the NL, all five of the Cy Young Award–winning relievers ranked number one in saves during their honored season.
With team finish having one of the stronger correlations to the Cy Young Award, would we expect to find the award-winning pitchers concentrated on “big market” teams? Or would the alleged East Coast–West Coast biases of baseball pundits have an effect on Cy Young Award selection? These could be classified as team-oriented effects, if they exist. Here’s the data on Cy Young Award winners by team:
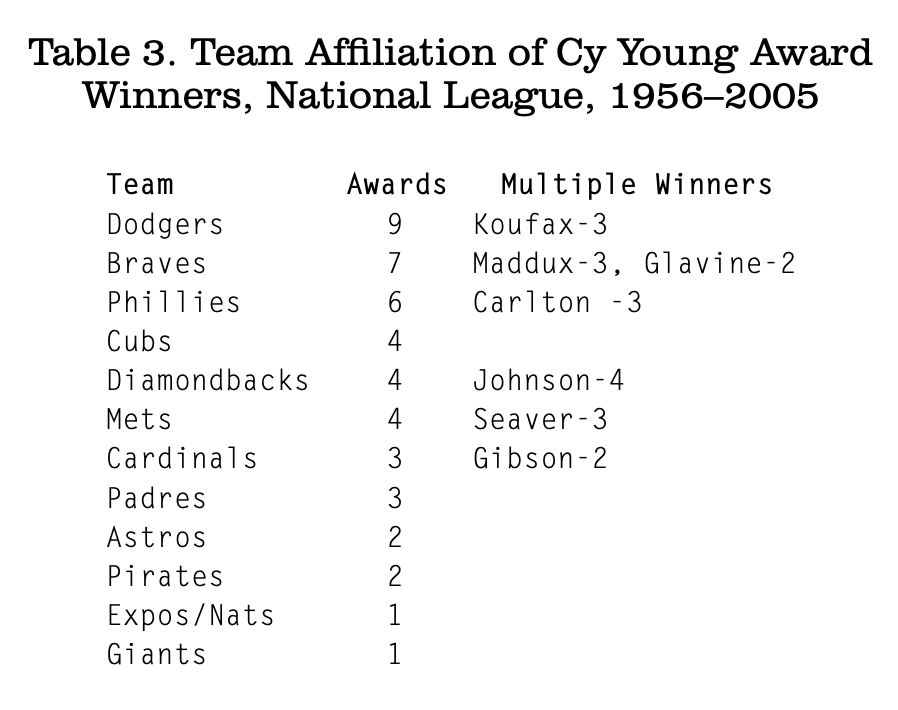
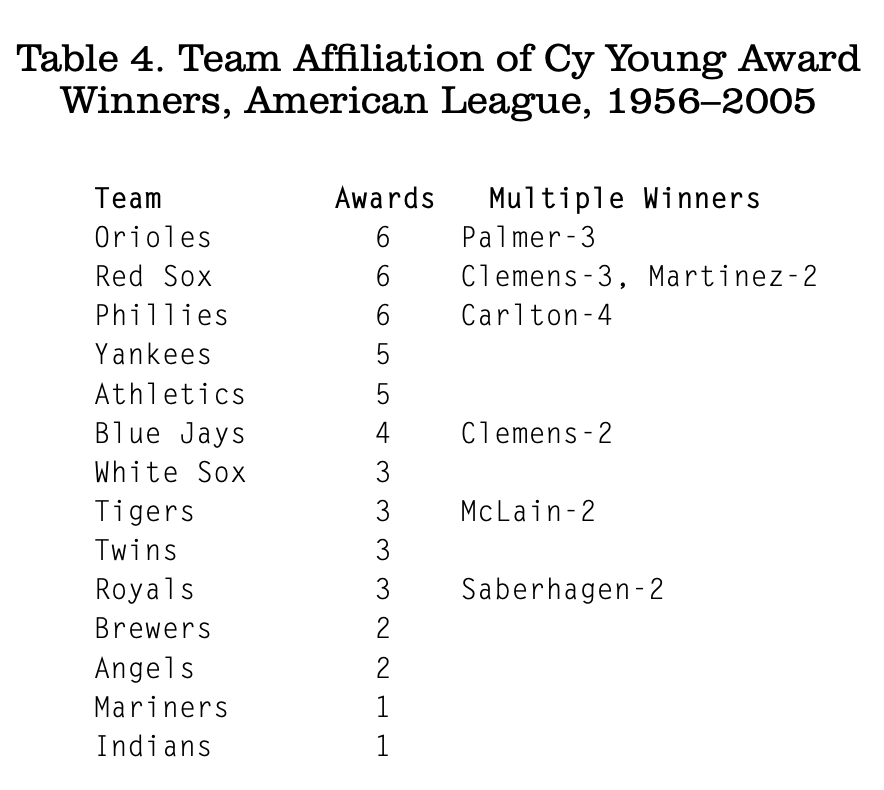
The key drivers here appear to be the numbers of league and division championships won by the team combined with the presence of dominant Hall of Fame (or future HoF)–caliber pitchers. The “big-market” and “East Coast–West Coast” effects are probably secondary in nature.
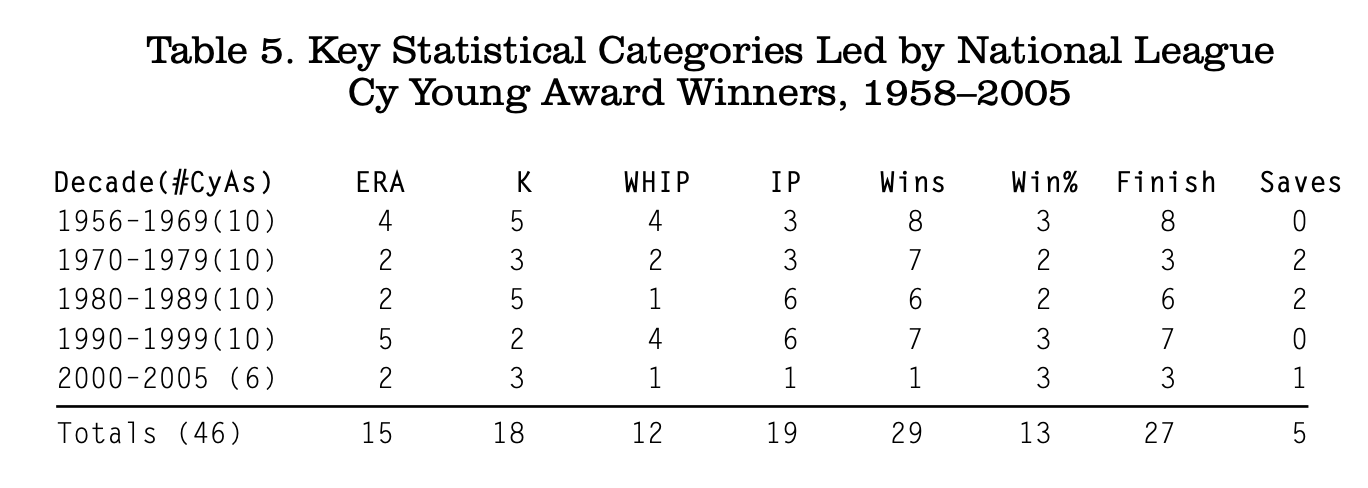
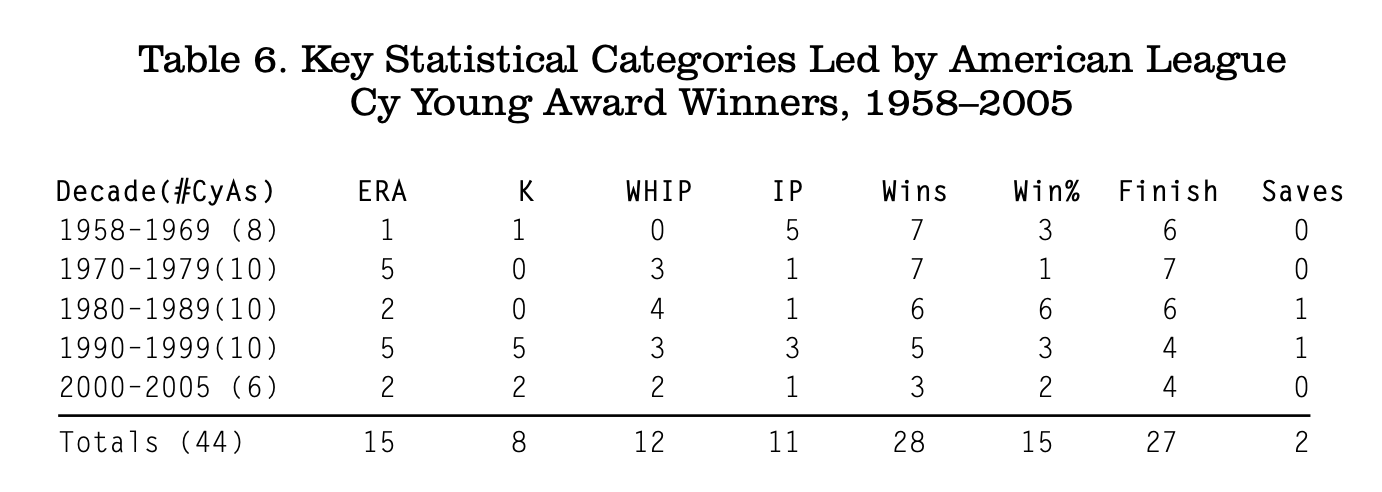
An additional analysis is to study the trend, over time, of how leadership in these performance accomplishments has correlated to winning the Cy Young Award. There have been 46 Cy Young winners from the National League and 44 AL winners across the 50 seasons that the award has been bestowed. Has there been any “shift” in emphasis on the various statistics over time? (See Table 5 and Table 6.)
A better trend line might be evident by the end of this decade. However, it does not appear at present that there is any fundamental shift in the correlations, with the possible exception of fewer Win leaders receiving the award in the NL in the 2000s.
Summary and Conclusions
In reviewing the eight statistical categories used for this paper (Wins, Winning Percentage, Saves, Team Finish, ERA, Strikeouts, WHIP, and Innings Pitched), the winning pitcher or his team (in every case except one—David Cone of the 1994 Royals)—finished first in at least one of the key statistics. In one case, Sandy Koufax in 1965, a starting pitcher finished first in all seven of the pertinent statistical categories (excluding saves).
Of course, the statistics representing these accomplishments are highly interrelated. It is of particular interest that leadership in Strikeouts and Innings Pitched were more often correlated with the award in the NL than was leadership in ERA. ERA was indeed the most correlated individual statistic studied in the AL. A potentially confounding factor here is that the relief pitchers that have won the award are generally not eligible for the ERA leadership due to their lower number of innings pitched. I do not believe that this would affect the statistical comparisons of this paper, as it could also be argued from the team accomplishments perspective that winning a wild card could be counted as a team finish of comparable weight with winning a division championship.
The fundamental conclusion of this paper is that leadership in team-oriented accomplishments (defined as Wins, Winning Percentage, Saves, and Team Finish) has more often, over the last 50 years in both the National League and the American League, influenced the selection of the Cy Young Award winner than does leadership in individual accomplishments (defined as ERA, Strikeouts, WHIP, and Innings Pitched). There may be some evidence that this trend is changing in the 21st century, although Bartolo Colon would argue against that premise.
MONTE CELY is a second-year SABR member. He is retired from the telecommunications business and lives in Round Rock, Texas, home of the popular minor league affiliate of the Houston Astros. Monte is a longtime St. Louis Cardinals fan, having seen his first major league baseball game with his dad at Sportsman’s Park (Busch Stadium) in 1959.
Acknowledgments
Thanks go to SABR members Bill Gilbert, Jan Larson, Jim Charlton, and Bernie Miklasz for their advice and insights in the formulation of this topic and development of the paper.
Thanks to my friend and baseball memorabilia collector Jerry Adamic for his encouragement, and to my son and fellow baseball fan Matt Cely for his support and proofreading of the paper.
Finally, thanks to my wife Linda for helping me track down statistical sources for use in this paper, and for her patience as I labored at my computer.
Notes
An earlier version of this paper examined key individual and team statistics for Cy Young Award winners in the National League and attempted to draw conclusions as to which factors most directly, or most often, influenced selection to this prestigious award.
1. Baseball Almanac website, www.baseball-almanac.com
2. Online Baseball Library, www.BaseballLibrary.com
3. Bill James & Rob Neyer. The Neyer/James Guide to Pitchers (New York: Fireside, 2004).
4. Sources and clarifications for the statistical table presented in Appendices 1 and 2: (1) Statistics are from the Baseball Almanac website, unless noted below. (2) WHIP calculations were derived from individual pitching statistics listed on the SABR Online Encyclopedia. (3) WHIP and innings-pitched league rankings are from Baseball Reference (www.baseball- reference.com). (4) All NL relievers that have won the Cy Young Award also finished first in the league that year in saves (1974, 1979, 1987, 1989, 2003). Of the AL relievers that have won the Cy Young Award, the 1981 and 1992 winners also led in saves. Sparky Lyle in 1977 finished second in saves; in 1984, Willie Hernandez finished third in saves. (5) Various statistics for the 1981 and 1994 seasons may seem “low” due to work stoppages. (6) Rick Sutcliffe was credited with wins leadership in 1984 due to his four wins credited in the AL prior to his trade to the Cubs.
Appendix 1: Statistics and Rankings for NL Cy Young Award Winners, 1956–2005
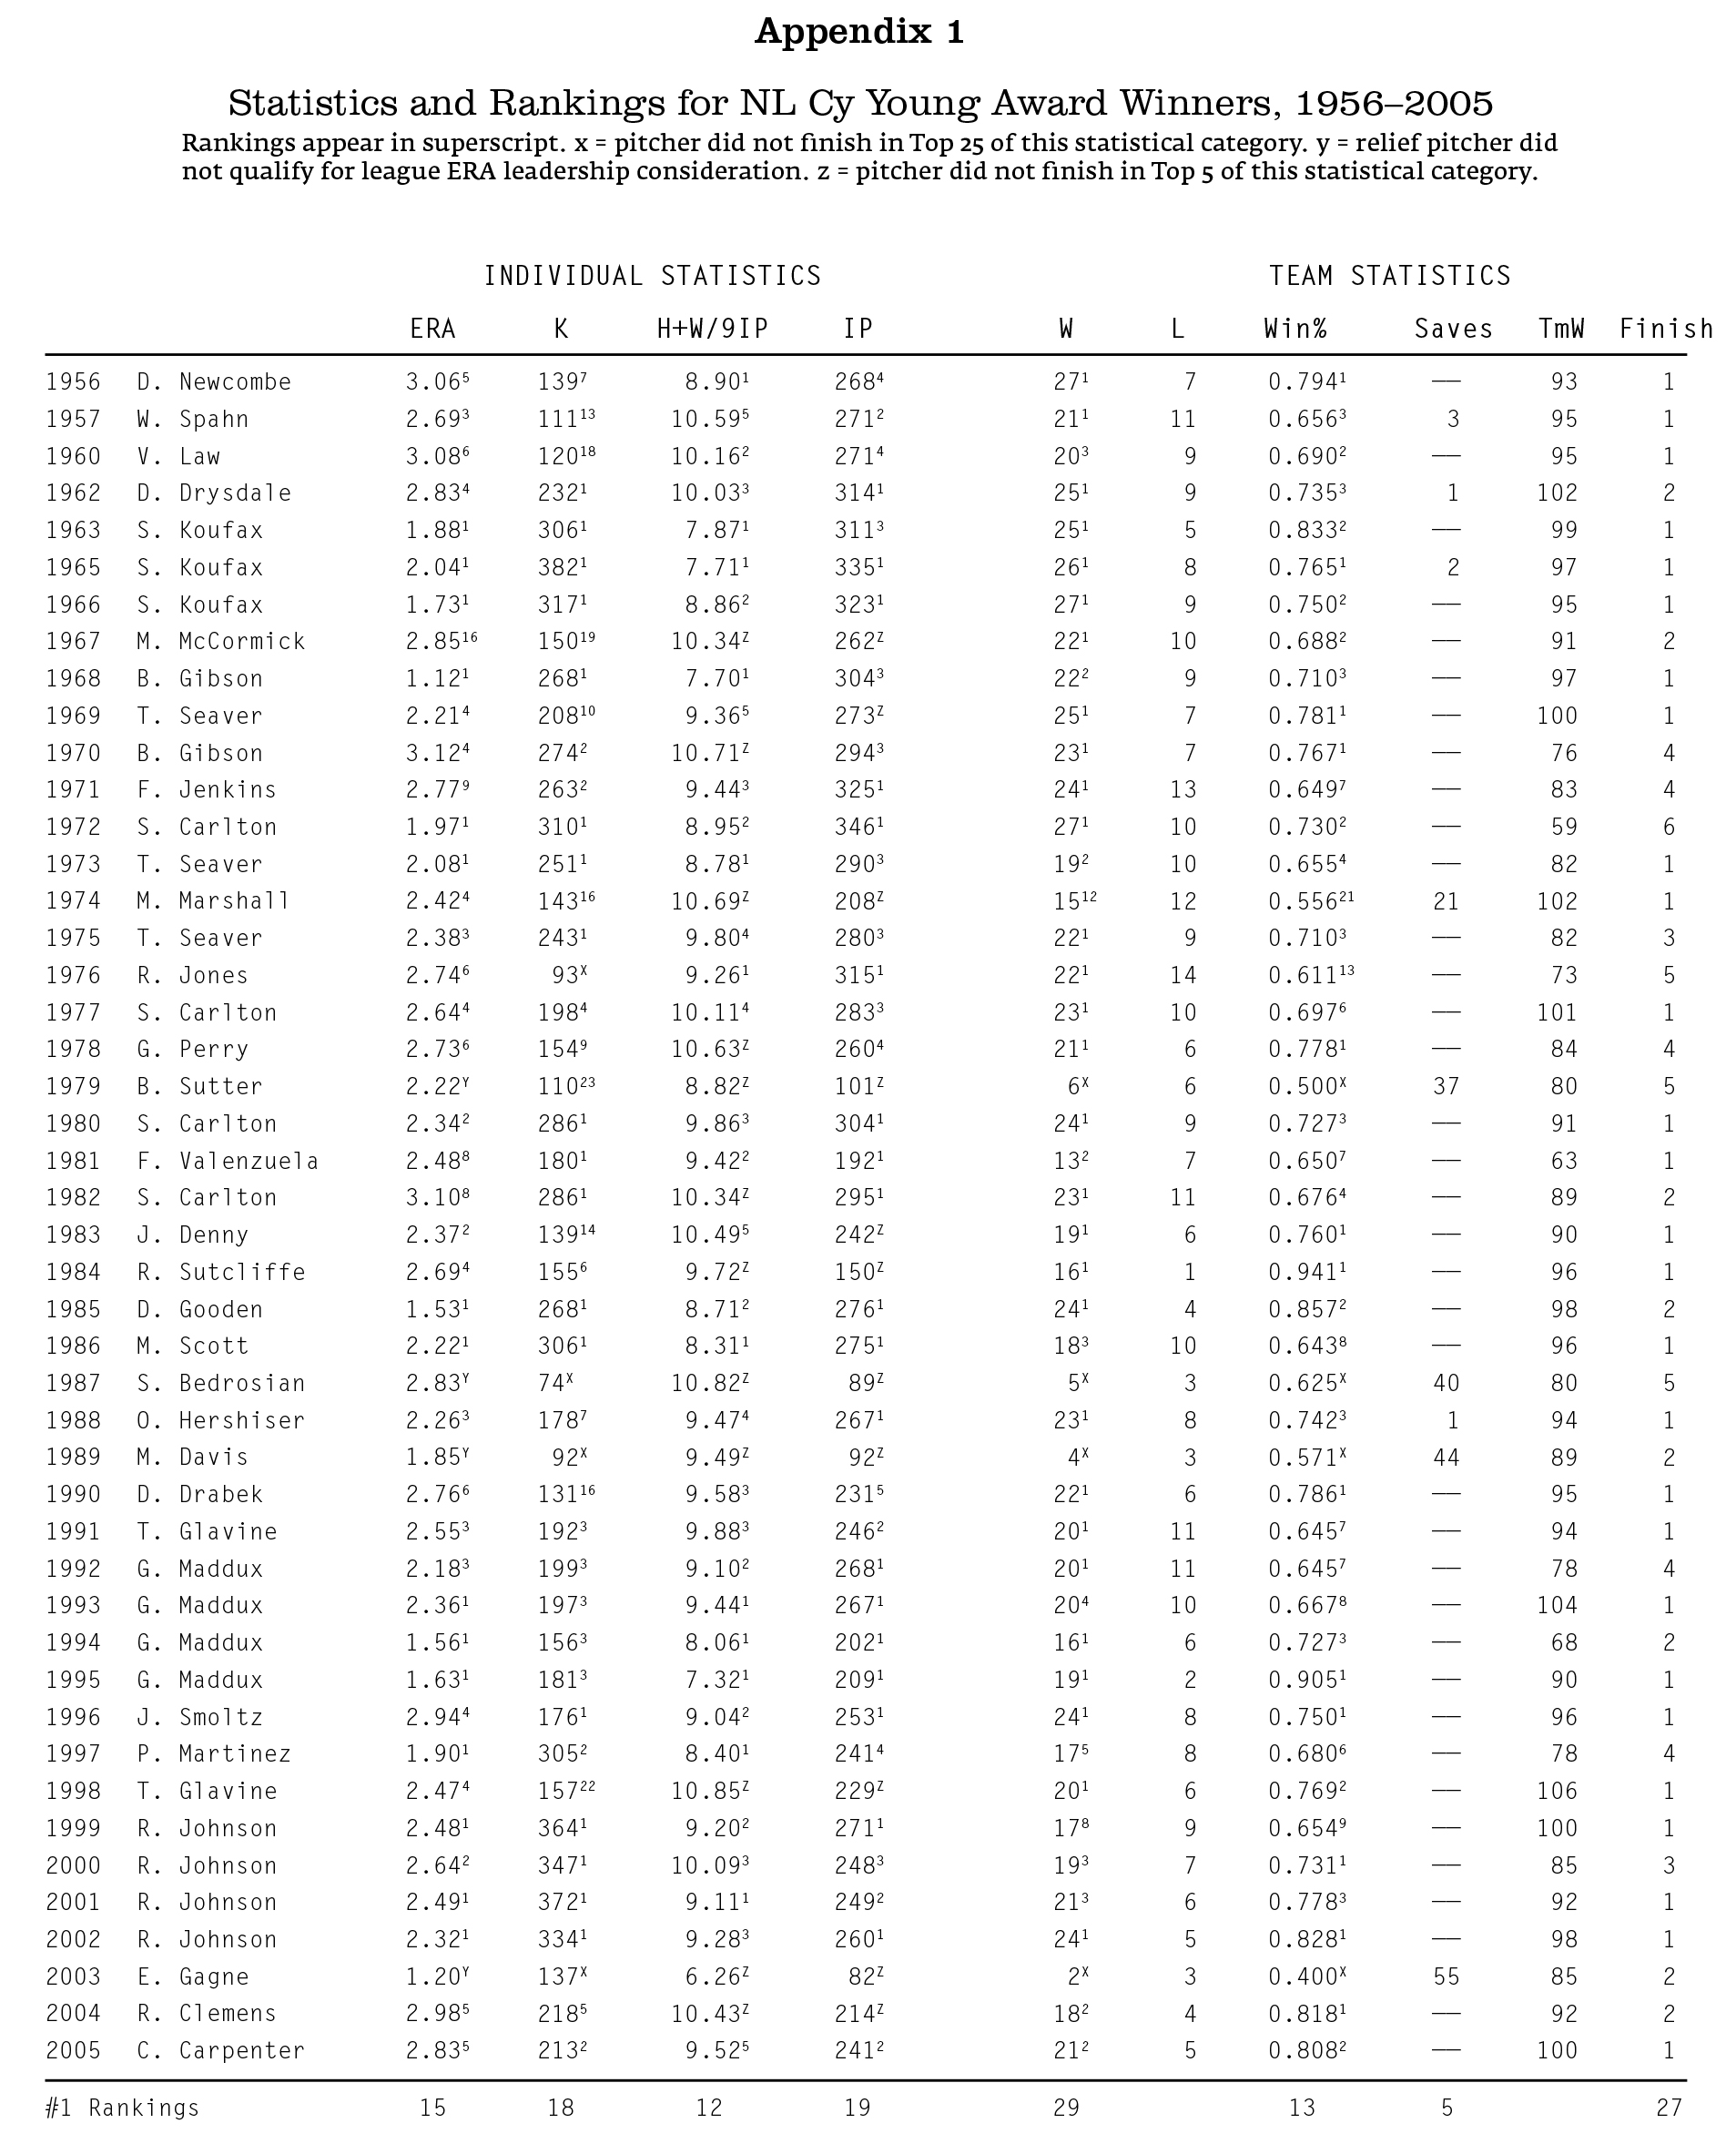
(Click image to enlarge)
Appendix 2: Statistics and Rankings for AL Cy Young Award Winners, 1956–2005
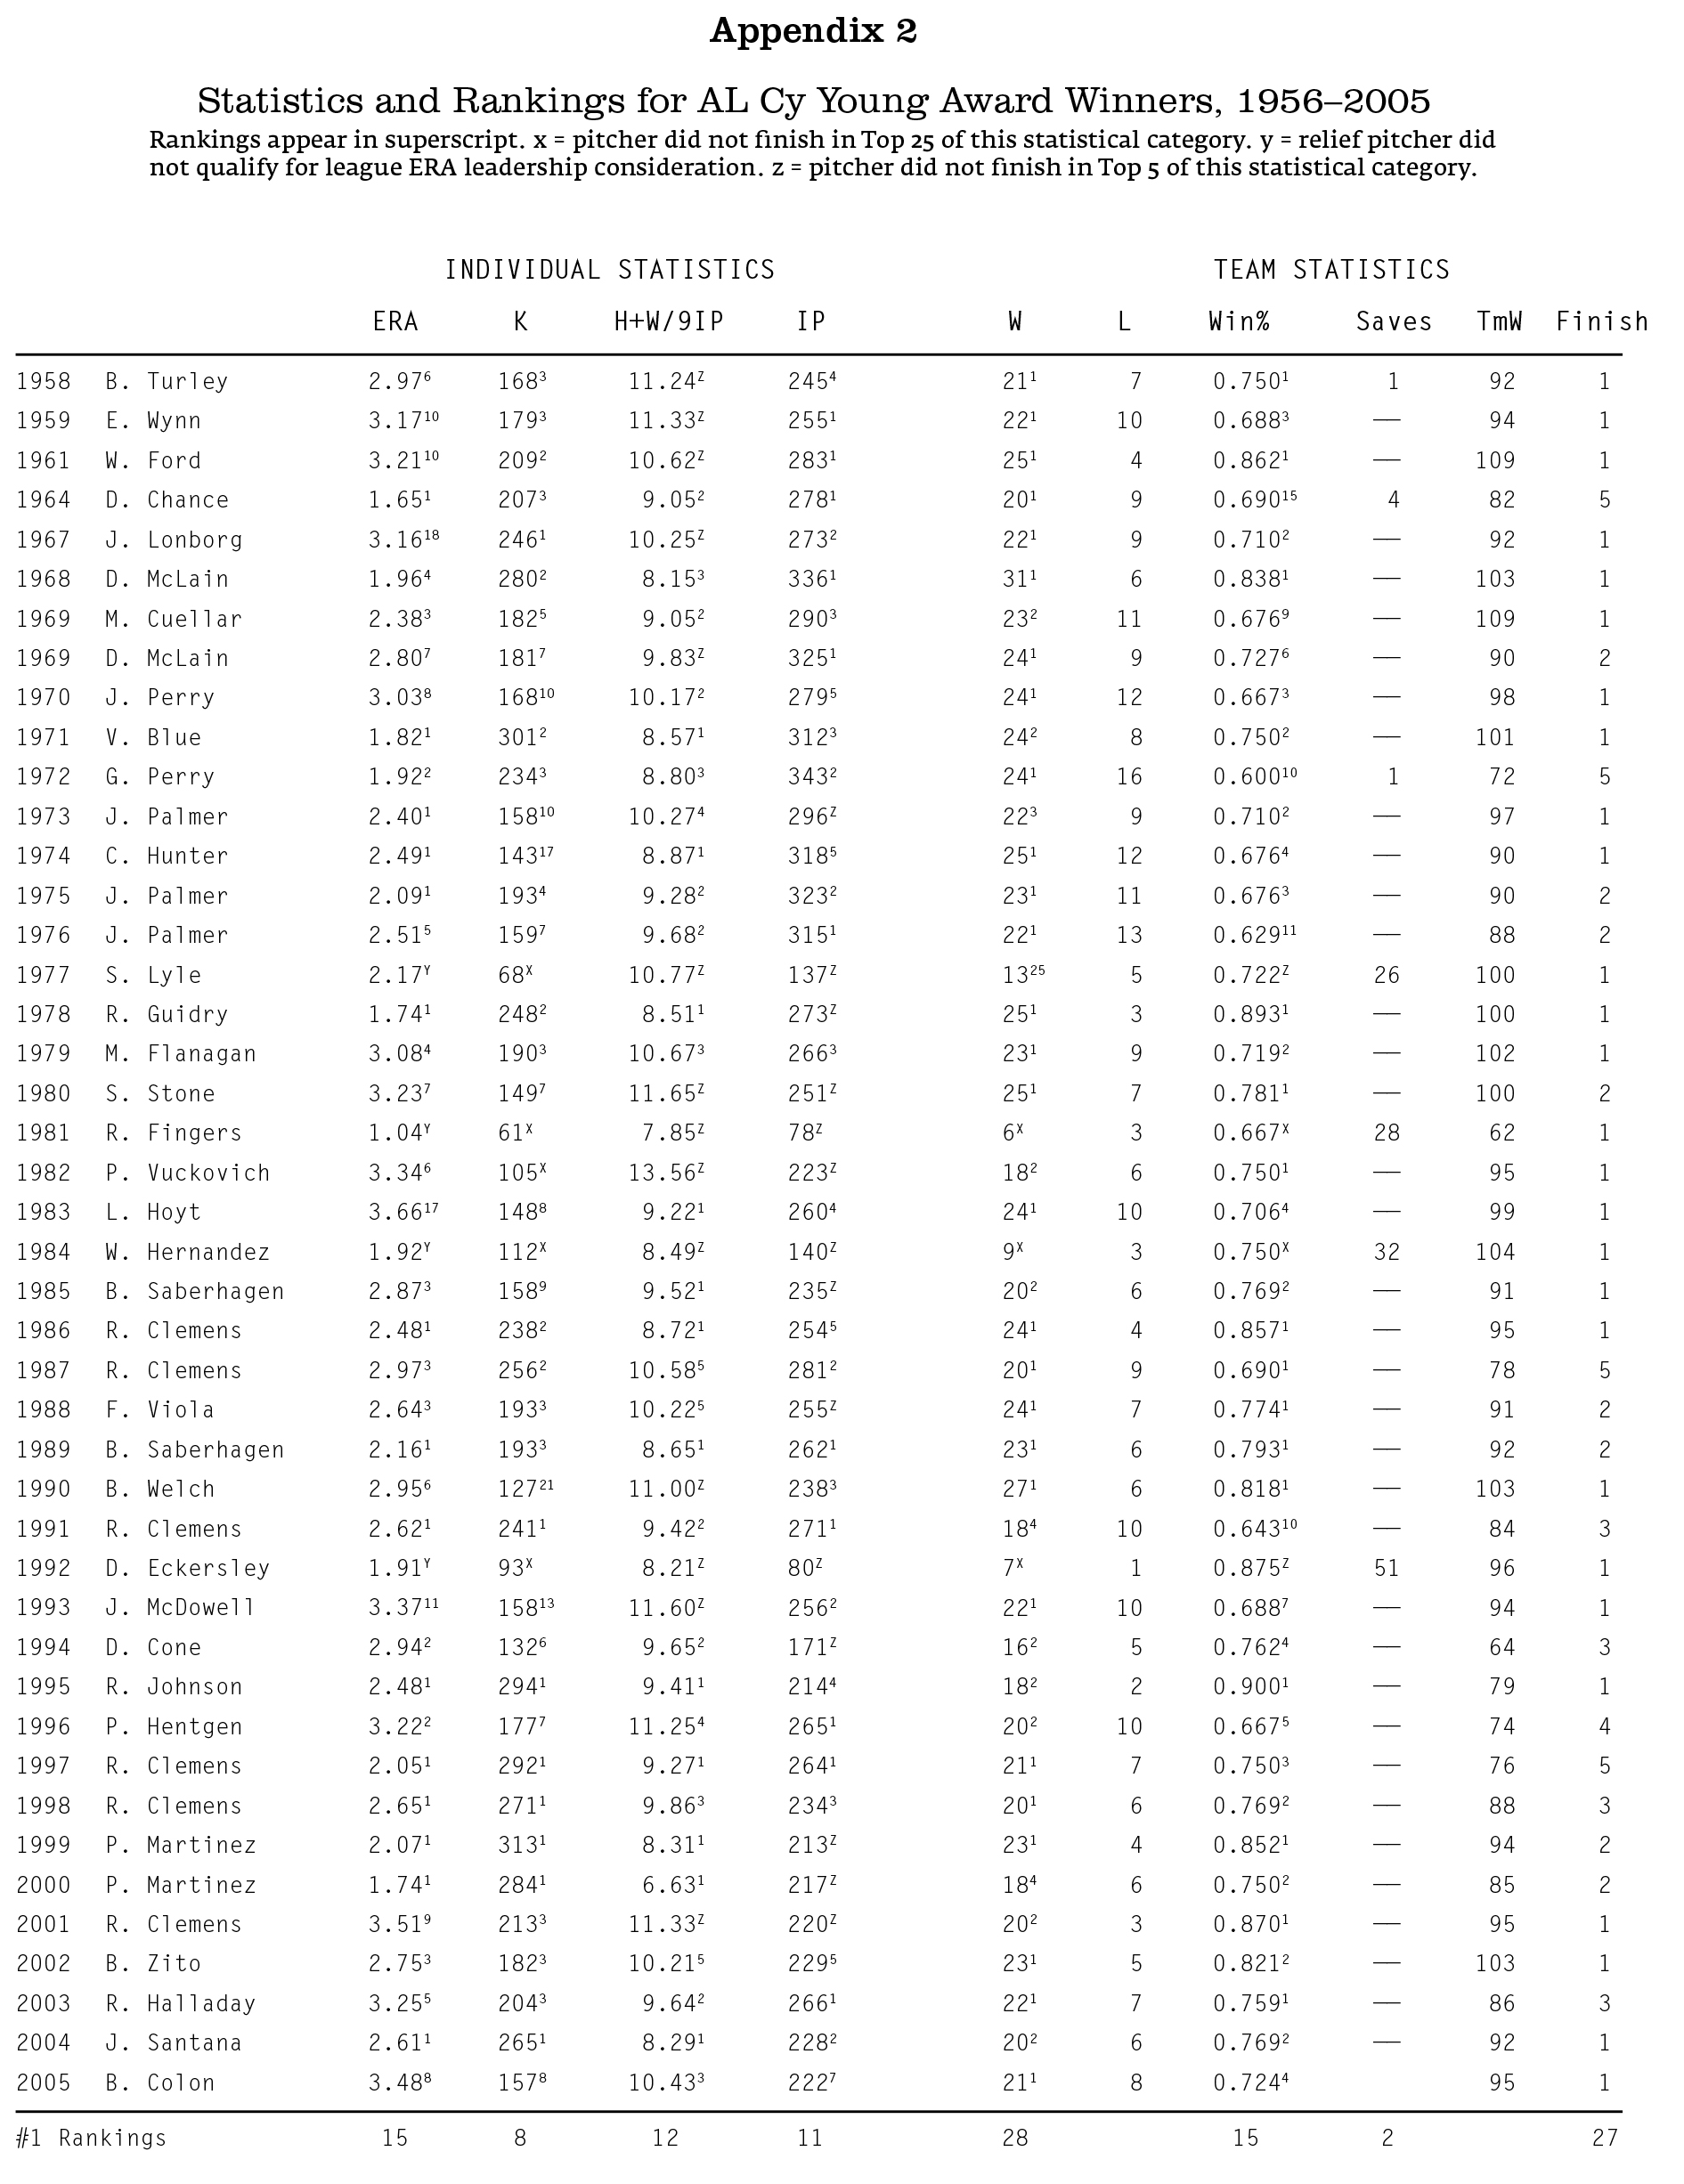
(Click image to enlarge)