

The Use of Over-30 Lineups in Major League Baseball
This article was written by Douglas Jordan
This article was published in Fall 2022 Baseball Research Journal
 In February 2021, SABR member Rich Campbell observed that the San Francisco Giants might utilize a lineup during the 2021 baseball season where all of the players on the field were over 30 years old. This observation prompted Ben Lindbergh, the cohost of Effectively Wild (the FanGraphs podcast), to explore the over-30 lineup question in more detail during an episode.1 Lindbergh used Retrosheet data on over-30 lineups generated by his Stat Blast consultant, Adam Ott, to discuss the question.2 He noted that the only team to use an over-30 lineup since 2016 was the 2018 Giants, and he pointed out a few other aspects of the data.
But given the limitations of a podcast format, Lindbergh was not able to do a comprehensive analysis of the data generated by Ott. The purpose of this paper is to closely examine Ott’s data trove in order to learn about the history of the use of over-30 lineups in baseball, and to examine the success of the teams that have utilized older lineups. The team finishes cited in the performance section of the article were obtained from Baseball Reference.
Two aspects of Ott’s data must be clarified. First, the data utilize the actual age of a player on the date a game was played. This is in contrast to how Baseball-Reference uses June 30 to calculate a player’s age for a given season. Second, the data use the first nine players listed in the starting lineup as the basis for the over-30 calculations. In the National League, and the American League prior to 1973, the pitcher is also required to be over 30.
Designated hitters are listed in the starting lineup before pitchers on Retrosheet. This means that to qualify in the American League since the introduction of the designated hitter in 1973, the lineup must have eight non-pitchers and one designated hitter, all of whom are over 30. The pitcher on these teams is not required to be over 30. Therefore, the American League results beginning in 1973 are slightly different from the results for the rest of the data.
DISCUSSION OF THE RAW DATA
The first use of an over-30 lineup in the American or National Leagues occurred in 1925. Since then, those two leagues have played about 170,000 games. In just 484 (0.28 percent) of those games did a team use an over-30 lineup. This means that an over-30 lineup has been used 28 times out of every 10,000 games played since that first time; the use of an over-30 lineup is rare. These lineups are so unusual that only 14 franchises have ever utilized such a lineup. These franchises, and the number of times they fielded an over-30 lineup, are shown in Table 1.
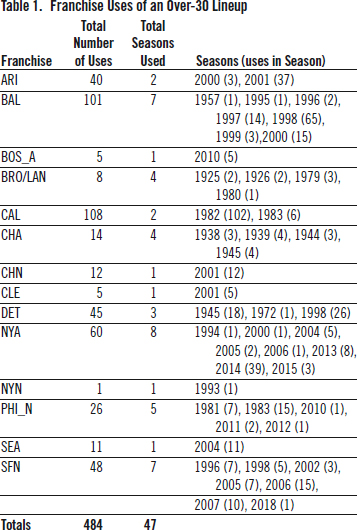
Table 1 shows that only two franchises, the California Angels (108 uses in two seasons) and the Baltimore Orioles (101 uses over seven seasons), have deployed an over-30 lineup more than 100 times. These two teams are discussed in more detail below. Seven teams have used an over-30 lineup more than 20 times, and four teams have used the lineup fewer than ten times. The Yankees have a total of 60 uses spread out over eight seasons while the Giants have 48 uses in seven seasons. Five teams, the Red Sox, Cubs, Indians, Mets, and Mariners have used an over-30 lineup in just one season.
A natural question to ask is; which of these 484 teams used the oldest lineup? The answer is the 1998 Baltimore Orioles. Twice that year, every man deployed in the lineup was at least 33 years old. The oldest player in those lineups was 38-year-old Joe Carter. He was joined by Cal Ripken (37), Eric Davis (36), Brady Anderson (34), Jeff Reboulet (34), Rafael Palmeiro (33), B. J. Surhoff (33), and Lenny Webster (33). As it happened, the pitchers for these two lineups were Doug Drabek (35, and who turned 36 two days after his start with the lineup) and Scott Erickson, who was 30.
The 2007 San Francisco Giants employed the next oldest lineup. Eight times that season every player sent out there was at least 32 years old. Led by 42-year-old Barry Bonds, the team also employed Omar Visquel (40), Ryan Klesko (36), Dave Roberts (35), Ray Durham (35), and Matt Morris (32) as the pitcher. There were a total of 22 uses (4.6 percent) of an all over-32 lineup, 62 uses (12.8 percent) of an all over-31 lineup, and (again, not surprisingly) the vast majority of the uses of the lineup occurred when the youngest player was 30 years old. This happened in 398 (82.2 percent) lineups.
USES PER SEASON
The first question to be addressed is the use of over-30 lineups through time. Has the frequency of use of older lineups increased or decreased since the initial example in 1925? The answer is revealed in Figure 1.
Figure 1 shows that the first use of an over-30 lineup in the American or National Leagues was by the Brooklyn Dodgers in 1925. The Dodgers used an over-30 lineup twice in 1925 and twice again in 1926. Then, with the exception of 1945, over-30 lineups were used infrequently until about 1980. In 1945 the Detroit Tigers used an over-30 lineup 18 times and the White Sox had four uses. That Tigers team won the World Series and featured 34-year-old Hank Greenberg, Paul Richards (36), Eddie Mayo (35), and 40-year-old Doc Cramer. There are only two instances of over-30 lineup use between 1946 and 1978. In total, over-30 lineups were used in only eight years prior to 1979.
The frequency of use of over-30 lineups increased starting in the 1980s. The 1979 and 1980 Dodgers used veteran-laden lineups four times. Those teams featured Davey Lopes (34), Steve Yeager (30), Steve Garvey (30), Dusty Baker (30), with Don Sutton as the 34-year-old pitcher. Neither of those teams made the playoffs. But the 1981 Dodger team, which never used a complete over-30 lineup, yet did retain the core of veterans from the previous two years, won the World Series. A similar dynamic occurred with the Phillies. The 1980 Phillies won the World Series with a veteran-heavy lineup, but never used an over-30 lineup that year. However, as the team aged, the Phillies did use an over-30 lineup seven times in 1981 and fifteen times in 1983 (the Angels account for the other six uses during 1983) when the Philadelphians advanced to the World Series but lost to Baltimore.
Over one-fifth of the over-30 lineup uses occurred in 1982. The California Angels used an over-30 lineup 102 times that year. Led by two 36-year-olds, Reggie Jackson and Rod Carew, the team also included veterans Don Baylor (32), Fred Lynn (30), Bob Boone (34), and Bobby Grich (33). That Angels team won 93 games and finished first in the AL West before falling to the Brewers in five games in the ALCS. The last use of an over-30 lineup in the 1980s occurred in 1988 when the Tigers used an over-30 lineup 26 times. The team featured 41-year-old Darrell Evans, along with Ray Knight (35), and Lou Whitaker (31). The pitching staff included 37-year-old Doyle Alexander and Jack Morris (33). Those Tigers won 88 games and finished one game behind Boston in the AL East.
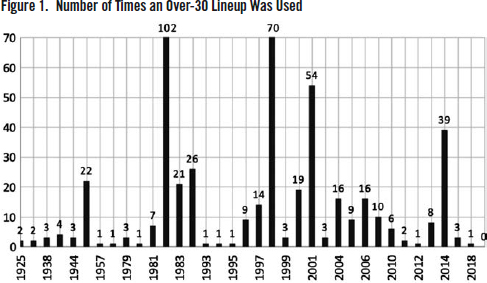
The Baltimore Orioles account for about another fifth of all uses of over-30 lineups. The Orioles used an over-30 lineup at least once every year starting in 1995 and ending in 2000, with 100 total uses over that time span. In 1998 the team featured 39-year-old Harold Baines and 37-year-old Cal Ripken, with 65 uses of an over-30 lineup. This is the second highest usage for a single team in one season behind the 1982 Angels (102 uses). The franchise had the most success during the early portion of the over-30 use period. The Orioles finished second in the division in 1996 and then won the AL East in 1997, but fell to the Indians in the ALCS.
It’s evident from Figure 1 that over-30 lineups have been used more frequently over the last thirty years than before 1980. Except for five years with no uses, an over-30 lineup was used each year during the 26 years from 1993 to 2018. This period included the third highest use of an over-30 lineup by the Yankees in 2014 (39 uses), and the fourth highest use (37 uses) by the 2001 Diamondbacks. The 2014 Yankees team failed to make the playoffs, but the 2001 Diamondbacks, who featured 37-year-old Randy Johnson and 34-year-old Curt Schilling, won a memorable, thrilling World Series in seven games over the Yankees. No team employed an over-30 lineup in 2019 or 2020.
OVERALL PERFORMANCE OF TEAMS WITH OVER-30 LINEUPS
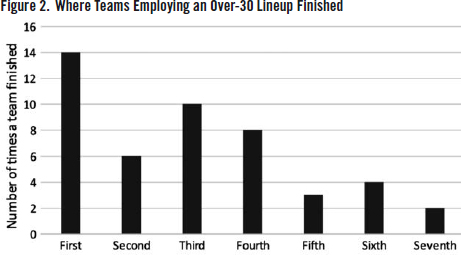
The previous section of the paper contained a few comments on how well some of the teams that used an over-30 lineup performed in the year they employed the lineup. This section looks at the performance of all of the teams that used an over-30 lineup. A total of 47 teams used an over-30 lineup at least once during a season. The question is; how well did those teams fare in the year that they used an over-30 lineup? The results are shown in Figure 2.
Figure 2 shows that 14 of the 47 teams that used an over-30 lineup finished first in their league or division. Of those 14 teams, two of them won the World Series, and were in the top six teams with the most uses. Those two teams were the 37-use Diamondbacks in 2001, and the 18-use Tigers in 1945. The Yankees used an over-30 lineup once on their way to the championship in 2000. The 1983 Phillies used an over-30 lineup 15 times, and made it to the World Series, but lost that Series to the Orioles.
Five other first place teams that used an over-30 lineup lost in the League Championship Series (1972 Tigers, 1982 Angels, 1997 Orioles, 2004 Yankees, 2010 Phillies) and four first place teams that used the lineup lost in the Division Series (2001 Indians, 2005 Yankees, 2006 Yankees, 2011 Phillies). The fourteenth team to use an over-30 lineup and finish first was the 1994 Yankees. There were no playoff games that year because of a strike by the players. Overall, in terms of numbers of uses of over-30 lineups, five of the top ten teams in terms of uses came in first. Three of those teams made it to the World Series (two won it) and the other two lost in the LCS.
Prior to 1995, teams that came in second missed out on the playoffs. But with the advent of the wild card in 1995, it became possible for a second-place team to make the playoffs. Six of the teams that used an over-30 lineup came in second. Two of those teams, the 2014 Yankees (third highest number of uses, 39) and the 1988 Tigers (fifth highest number of uses, 26) were in the top five in terms of the number of uses of an over-30 lineup.
Four of the six second place teams that used an over-30 lineup did so after 1995. But only two of those four teams qualified as a wild card team. In 1996, the second-place Orioles used an over-30 lineup twice during the season and earned the wild card. That team beat Cleveland in the division series before falling to the Yankees in the ALCS. The 2015 Yankees used an over-30 lineup three times on the way to a second-place finish. The Yanks lost to the Astros in the wild card game.
MOST USAGES OF AN OVER-30 LINEUP, AND FOLLOW ON PERFORMANCE
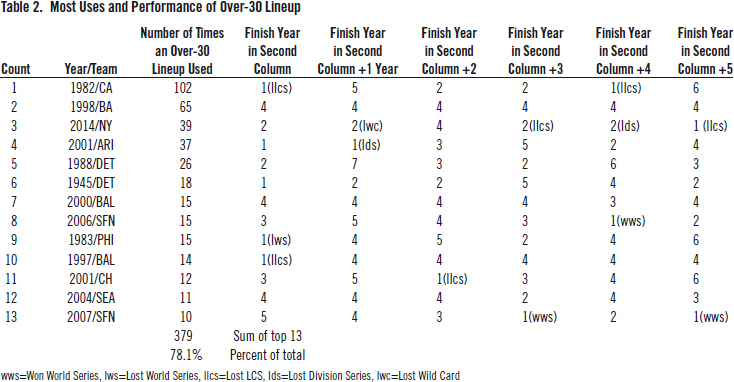
Only 13 out of the 47 teams that used an over-30 lineup did so ten or more times during the season. We will now examine how those 13 teams fared in the season they used the over-30 lineup, and in the subsequent five seasons. The interesting question is; does the use of an older lineup in a season negatively impact team performance in following seasons? Intuition suggests that subsequent performance will be negatively impacted for a couple of reasons. First, the use of veterans means that younger players will get less playing time. This could slow their development. And second, the veterans’ performance is likely to decline with each subsequent year, which could also negatively impact the team’s results. The data in Table 2 allow this question to be investigated.
The 13 teams shown in Table 2 used an over-30 lineup a total of 379 times. This represents 78 percent of the total uses of an over-30 lineup. It shows that the relatively few teams that used an over-30 lineup multiple times account for the majority of the uses. In terms of performance in the year of use, Table 2 shows that five of the 13 teams came in first and two others came in second. So more than half (7 out of 13) of the teams that used an over-30 lineup the most times finished first or second. Of the five teams that came in first, two of them (the 2001 Diamondbacks and the 1945 Tigers) won the World Series, and one of them (the 1983 Phillies) lost the World Series. The other two first place finishers (the 1982 Angels and the 1997 Orioles) lost in the LCS.
But what happens in subsequent years? Regular use of an older lineup means that development of younger players will be hindered. Does this result in poor performance in following years? To look at this question, Table 2 shows the finish for these 13 teams in the following five years. In order to avoid double counting, the data for the 1998 and 2000 Orioles, as well as the 2007 Giants, will not be used for the subsequent year analysis since those same data show up in the 1997 Orioles and 2006 Giants data respectively.
This leaves ten teams for the subsequent year analysis. Just two teams finished first in either of the next two seasons and only four other teams came in second. So, over the following two seasons, six out of 20 (30 percent) of the teams that used an over-30 lineup the most came in first or second and none of those teams made it to the World Series. Table 2 suggests that performance in the next two years is negatively impacted by regular use of an over-30 lineup.
However, team performance improved in out years three to five. Three of those 30 teams came in first. One of those first-place teams—the 2010 Giants—won the World Series and the other two lost in the LCS. Nine of those teams came in second, so a total of 12 out of 30 teams (40 percent) came in first or second in subsequent years three to five. This is an improvement over the results for the immediately following two years.
But we shouldn’t read too much into this result. Three to five years is a long time. Rosters can change dramatically over that time frame, so it is possible that there is little to no correlation between the later year results and the year of use of an over-30 lineup in a particular season.
TOPICS FOR FURTHER RESEARCH
The purpose of this paper is to explore the data set on over-30 lineups provided by Adam Ott in order to better understand the use of those lineups historically. In addition, the article looks at how well those teams have performed in terms of league, or division, finishes. Both of these endeavors are primarily descriptive. The different sections of this paper simply describe what happened historically.
The historical facts are interesting, but additional analysis could provide deeper insight into the use of veteran-heavy lineups. Areas for further research could include an analysis of the decision makers who are responsible for constructing these lineups, i.e. the manager and general manager, and the winning percentage of a team when playing with an over-30 lineup compared to without an over-30 lineup during a particular season.
It would also be interesting to know if big-market teams are more likely to employ an over-30 lineup than small-market teams. A team’s payroll restrictions, or lack thereof, are likely to have an impact on the team’s use of high-priced veterans. This analysis could also be extended to explore the question what mixture of younger and older players gives a team the best chance of winning a championship.
CONCLUSION
This article looks at major league baseball teams that used a lineup where every player is at least 30 years old. How often has that happened? The data show that fourteen franchises (comprising 47 team seasons) have used an over-30 lineup 484 times since 1925. Use of these older lineups was rare prior to 1980 but has become more common since then. The team with the most uses of an over-30 lineup in a single season was the California Angels. In 1982 the Angels used an over-30 lineup 102 times. Led by Reggie Jackson and Rod Carew, that team won their division, but lost in the ALCS.
In addition to describing the raw data, the paper also examines the performance of teams that used an over-30 lineup in order to better understand how those teams fared during that and subsequent seasons. These data show that 47 teams utilized an over-30 lineup at least once during a season. Fourteen of those teams finished in first place and six teams finished second for a combined 20/47 (42.6 percent) that won their division (or league) or came in second. In other words, history suggests that about four of ten teams that utilize an over-30 lineup have a good chance of making the playoffs.
DOUGLAS JORDAN is a professor emeritus at Sonoma State University in Northern California. He has been a regular contributor to BRJ since 2014. He runs marathons and plays chess when he is not watching or writing about baseball. You can contact him at jordand@sonoma.edu.
Acknowledgments
Many thanks to two anonymous reviewers for their careful reading of the first draft of this article. Their comments helped to improve the paper.
Notes
1. Lindbergh’s podcast is titled “Effectively Wild Episode 1659: Rotten Mather.” It is dated February 24, 2021 and the portion concerning over-30 lineups runs from minute 14 to minute 20. The URL is https://blogs.fangraphs.com/effectively-wild-episode-1659-rotten-mather.
2. The over-30 lineup data generated by Adam Ott can be found at https://docs.google.com/spreadsheets/d/1xyq9hVatiF9qXWqjAt6xJb-dOJ1tTFdvATj-2G_X1lM/edit#gid=1108050359.