

WAA vs. WAR: Which is the Better Measure for Overall Performance in MLB, Wins Above Average or Wins Above Replacement?
This article was written by Campbell Gibson
This article was published in Fall 2019 Baseball Research Journal
 Among the many statistical analyses of baseball that have been published during the last four decades, the single most important in my opinion is The Hidden Game of Baseball (1984) by Pete Palmer and John Thorn. Their research, based on a large-scale regression analysis of baseball statistics, led to the development of summary measures for overall performance (including batting, base running, pitching, and fielding) standardized to account for several factors. These factors included changes over time in the average number of runs scored per game, differences in players’ home parks, and the relative difficulty of a player’s fielding position. This last factor reflects the fact that for two players with identical offensive performance, the one playing a more difficult position (e.g., catcher or shortstop) is more valuable than one playing a less difficult position (e.g., left field).
The beauty of Palmer’s and Thorn’s two primary summary measures — Total Player Rating (TPR) and Total Pitcher Index (TPI) — was that they quantified the performance of players (both pitchers and non-pitchers) in terms of wins contributed to the team relative to average performance. Thus the values of these measures could be positive, zero, or negative, and totals for teams correlated very highly with team performance. Since team performance is primarily a function of how well the team’s players perform, these measures were in fact good predictors of team performance.
Eight editions of Total Baseball were published next, 1989 through 2004, authored by Palmer, Thorn, and others. TB was more comprehensive than previous baseball encyclopedias, and starting with the 4th edition was recognized as the official encyclopedia of Major League Baseball. Total Baseball included other measures of overall performance in addition to those developed by Palmer and Thorn. The 8th edition introduced the term Total Player Wins (TPW), described as: “The ‘MVP’ of statistics, this ranks pitchers and position players by their total wins contributed in all their endeavors, revealing the most valuable performers in a given year.” (Page 2,673.) TPW replaced the terms TPR and TPI used previously. The TPW concept was continued in five editions of the ESPN Baseball Encyclopedia through 2008 where it was referred to as Batter-Fielder Wins (BFW).
As with many print publications, Total Baseball became antiquated in the wake of the Internet. Baseball-Reference.com, developed by Sean Forman, went public in 2000. The B-R.com database was developed originally using the same data underlying the issues of Total Baseball.1 At B-R.com, the concept of TPR has been relabeled Wins Above Average (WAA). While there have been many refinements in computing values of WAA, the basic concept is the same: WAA quantifies the performance of players (both pitchers and non-pitchers) in terms of wins contributed to the player’s team compared with average performance.2
Sources of the data
Most of the data included in this paper are from Baseball-Reference.com, and many were obtained using the Play Index on the website. The Play Index is a feature of Baseball-Reference.com that enables a researcher to develop a wide range of custom tabulations. Without the Play Index, it would not have been feasible to calculate many of the statistics presented here.
Wins Above Average (WAA)
To illustrate how WAA relates values for players with team performance, we can start with the 2018 season, using an average team, the best team, and the weakest team, as defined by their won-lost records. The most average team was the Los Angeles Angels with an 80–82 record. They had a team WAA of +0.2 (essentially zero), composed of a +5.2 for the non-pitching position players and designated hitters — hereafter called “position players” — and a -5.0 for pitchers. Not surprisingly, the best player on the team was Mike Trout with a WAA of +8.1. With just an average player in place of Trout, the team would probably have won about eight fewer games, which would have produced a 72–90 record. (It should be noted that a team’s WAA is not expected to predict its won-lost record exactly; differences can occur for various reasons, for example how well or poorly a team did in one-run games.)
 The best team in 2018 was the Boston Red Sox with a won-lost record of 108–54 and a team WAA of +22.3, composed of +6.2 for position players and +16.1 for pitchers. This value of WAA suggests a won-lost record of about 22 games above .500, or 103–59. While the Red Sox ranked first in the American League in runs scored with 876 and third lowest in runs allowed with 647, the values of WAA indicate that their pitchers were further above average than their position players. The explanation for this apparent inconsistency is one of the features of WAA, which incorporates Park Factor. As usual, Fenway Park in 2018 was more favorable to hitters and less favorable to pitchers than the average park. In 2018, Mookie Betts had a WAA value of +8.9, the highest in the major league. Without Mookie Betts and with an average player in his place, the total WAA value for position players on the Red Sox team would actually have been negative (-2.7, calculated as +6.2 – 8.9).
The weakest team in 2018 was the Baltimore Orioles at 47-115 with a team WAA of –22.9, composed of –15.6 for position players and –7.3 for pitchers. This suggests a won-lost record about 23 games below .500, or 58–104. As seems frequently to be the case with weak teams (such as teams losing more than twice as many games as they won), the Orioles’ record in games decided by one run was also weak, with 12 wins and 29 losses.
One more example to show how WAA relates player value to team performance: the 1927 New York Yankees. Considered one of the best teams of all time, the 1927 Yankees included six future Hall of Famers: Babe Ruth, Lou Gehrig, Herb Pennock, Waite Hoyt, Earle Combs, and Tony Lazzeri, as well as their manager, Miller Huggins. The team had a won-lost record of 110-44 and a team WAA of +33.4, composed of +26.7 for position players and +6.7 for pitchers. In the 154-game season then in use (where a record of 77–77 was average), this suggests a won-lost record of about 110–44, which happens to agree exactly with the Yankees record that year. Their run-producing ability was led by outstanding seasons for Ruth (+9.9) and Gehrig (+9.3), with major contributions from Combs (+4.4) and Lazzeri (+3.8).
In brief, the WAA concept provides an excellent method that is intuitively appealing for quantifying the performance of players and connects player performance with team performance in a systematic way.
Wins Above Replacement (WAR)
The summary definition of WAR from the Baseball-Reference website follows: “A single number that presents the number of wins the player added to the team above what a replacement player . . . would add.” (This replacement player would come from the top minor-league level.) A comprehensive history and discussion of the WAR concept is also provided on B-R.com. As noted in this discussion, “There is no one way to determine WAR. There are hundreds of steps to make this calculation, and dozens of places where reasonable people can disagree on the best way to implement a particular part of the framework. . . . WAR is necessarily an approximation and will never be as precise or accurate as one would like.”
The discussion includes the concept of replacement players and states, “When computing the value of a major league player, average is a poor baseline for comparison. Average players are relatively rare and can be expensive to acquire. . . . Replacement level players, by their very definition, are players easy to obtain when a starter goes down. These are the players who receive non-roster invites at the start of the year, or the players who are 6-year minor league free agents.”
While the computation of WAA and WAR are both complex and involve many steps, the computation of WAR is more subjective. The computation of WAR starts with WAA and adjusts the benchmark from the concept of an average (a straightforward statistical measure), to the concept of a replacement player. The replacement player concept is not at all straightforward, as reflected by the fact that it is calculated differently by different sources (e.g. Baseball Reference, Fangraphs). The calculation is further complicated by the fact that the best actual replacement player available to a team varies because the minor league players available vary from one team to another. An example of this is provided later.
It is clear from the definition of WAR and the discussion of the concept of replacement-level players that the primary motivation for developing WAR is not the performance level of baseball players in general, but rather the performance level as it pertains to replacing a major league player with an available minor league player.
The problem with this approach is that while the replacement-level concept may be very useful with regard to replacing a player, this does not mean that the replacement-level concept is preferable in general, or that WAR is preferable to WAA for general evaluations of player performance. In part because the WAR concept has been used widely to analyze the financial costs of replacing players and because there is an understandable focus among baseball journalists about players’ salaries, team salary totals, the financial worth of free agents, etc., WAR values are cited frequently. In contrast WAA values are rarely, if ever, seen in newspapers and magazines, but appear only (or with few exceptions) in the professional literature on the analysis of baseball performance. A related difficulty is that WAR values are used in the media with no discussion of their limitations.
Limitations of Wins Above Replacement (WAR)
We can start by looking at what using the WAR concept in place of the WAA concept does to our examples relating values for players with team performance. In the case of our average team — the 2018 Los Angeles Angels and their 80-82 record — the team WAR was +35.0 (composed of +26.0 for position players and +9.0 for pitchers). Unlike the team WAA value of +0.2, the team WAR value of +35.0 does not convey that this was an average team. One would have to dig into the technical details of the computation of WAR to find out that the benchmark for an average team is no longer a won-lost record of 81–81 and a .500 winning percentage, but rather a won-lost record of 47–115 and a .292 winning percentage. While a lot of research has gone into determining this benchmark, it has changed over time and reflects a lot of subjective decisions, as noted in the Wins Above Replacement Explainer quoted earlier.
Does the fact that the replacement-level benchmark of a won-lost record of 47–115 is equal to the actual performance of the 2018 Baltimore Orioles mean that they could have gone out and signed a team of replacement-level players and achieved the same result? This is highly doubtful. There is a big difference between the pool of talent at the top minor-league level (noted in the summary definition of WAR) and the talent actually available (the non-roster invites and 6-year minor league free agents, as noted earlier).
Historically, there are many examples of top minor league players who were not free to sign with a major league team of their choice or a team looking for a replacement player. The 1937 Newark Bears (with a .717 winning percentage) in the International League provide one notable example. This team was owned by the New York Yankees and was the top team in its minor league farm system, with several players who were good enough to have been starters on other major league teams in 1938, including batting champion Charlie Keller. He was kept at Newark for the 1938 season because the Yankees had a starting outfield of Joe DiMaggio, Tommy Heinrich, and George Selkirk.
While the fact that there are very few major league players who are not exactly “average” and that they can be expensive to acquire, as noted above, does not mean that the average major league player is not a useful benchmark — or the most useful benchmark — for general player evaluation. While it is nice to deal with distributions of values that conform to the classic bell-shaped curve (in statistical theory, a normal distribution) where the average (more technically, the mean), median, and mode of the distribution are identical, these distributions exist primarily in statistical theory. A simple example would be the distribution of the expected number of heads in 100 tosses of a coin.
Statistical distributions in the real world are skewed, and the mean is most likely not the most frequent value. The distribution of US households by annual income provides another example. In this case, the distribution is skewed to the right (reflecting the fact that there are cases where the value is extremely high), and thus most cases have values below the mean.
The distribution of values of WAA provides another example. The distribution is skewed to the right with most cases having values below the mean. The primary explanation is that players who are way above average (say a WAA of 5.0+) typically will play in the large majority, if not all, of their team’s games. Players who are way below average (e.g., on pace for a WAA of –5.0 or less in a season) will not get to play very long in the major leagues. In 2018, 448 position players had 100 or more plate appearances, among whom 194 had a positive WAA (+0.1 or higher), 11 had a WAA of 0.0, and 243 (a majority) had a negative WAA (–0.1 or lower). In contrast, the corresponding WAR values of these 448 position players were 338 positive, 9 at 0.0, and 101 negative, reflecting that the benchmark for WAR values is well below the average major league performance.
In 2018, the top 10 position players, all of whom had over 600 plate appearances, had an average WAA of 5.8. Their average WAR was 7.9, suggesting that for full-time players, the average WAR is roughly 2.0 above the average WAA for a single season.
Three major observations about the WAR concept stand out based on the preceding discussion:
- the WAR concept was developed originally with a focus on replacing a major league player with a minor league player, not on the general evaluation of player performance;
- the implementation the of replacement-level concept is highly subjective; and
- the WAR concept distorts the basic statistical properties of distributions such as the average.
These three observations led me to see if anyone had researched the issues raised by these facts. I found research published in 2012 by Adam Darowski comparing WAR and WAA at HighHeatStats.com.3 He showed that in addition to increasing the numerical value of a player’s career by switching from WAA to WAR, this increase is not consistent among players and results in tremendous differences in the ranking of players by their career performance.
 His primary example of a player whose career ranking benefits from using his WAR value rather than his WAA value is Pete Rose. This is because Rose had many average or below- average seasons as measured by his WAA value — especially in the latter years of his long career — that still added to his WAR value or did not reduce it significantly. Darowski asks, when considering a player for the Hall of Fame, does one ask if “he was so much better than the AAA players of his day” or if “he was so much better than everyone else?” Darowski favors the latter criterion, and given this choice, divides a player’s WAR value into two categories: his WAA wins (due to being above average compared with other major league players) and his “showing-up wins” (due to being below average among major league players but better than the minor-league benchmark). There are some cases where a major league player’s performance was so far below average that his WAR value was negative (e.g., Pete Rose in 1981 and 1982, at ages 41 and 42, with WAA values of -3.4 and -4.0, and WAR values of -1.1 and -2.1, respectively.)
The term “showing-up wins” may seem a bit harsh and/or cynical since most players in any given year are likely to have WAA values below average, as explained previously. This does not mean that they do not deserve to play in the major leagues. However, Darowski’s term is used here because the focus is on overall performance compared to other players overall (e.g., does the player deserve to be considered for the Hall of Fame), not on who the team might replace him with if he is no longer available (e.g., injured or opts for free agency).
Table 1 is titled “WAA and WAR Comparison for the top 65 Position Players in Career WAA and in Career WAR: 1871-2018.” (See below.) I limited the lists to 65 players — about the number that can be included reasonably in a one-page table. The table is designed to illustrate how WAR values relate to WAA values for top players by dividing their WAR wins into WAA wins and showing-up wins, as suggested by Darowski. The two lists include 74 players: 56 players who appear on both lists, 9 players who appear on the WAA list only, and 9 players who appear on the WAR list only.
While the lists of the top 65 position players in WAA and in WAR include many of the same players, there is a pronounced and systematic bias. In general, players with less than the average number of career plate appearances show a drop in their ranking when switching from WAA to WAR, and vice versa. Among the top 10 players in WAA, Rogers Hornsby and Ted Williams (each with fewer than 10,000 plate appearances) drop from 5 to 9 and from 6 to 11, respectively. Among players in the top 65 in career WAA and with fewer than 8,000 career plate appearances, there were the following changes (all declines) in career ranking when switching from WAA to WAR: Dan Brouthers, 28 to 39; Joe DiMaggio, 30 to 42; Mike Trout (active), 37 to 99; Arky Vaughan (40 to 54); Johnny Mize, 45 to 61; Lou Boudreau, 50 to 104; Chase Utley, 53 to 95; Joe Jackson, 56 to 110; Gary Carter, 57 to 68; Billy Hamilton, 60 to 103; and Jackie Robinson, 62 to 114.
Among players whose rank is higher using WAR instead of WAA, Pete Rose, with the all-time record of 15,890 plate appearances, stands out (40 compared with 134). Other players with differences in rank of 20 or more include: Robin Yount, 43 versus 74; Paul Molitor, 45 versus 73; Sam Crawford, 48 versus 94; Reggie Jackson, 51 versus 89; Derek Jeter, 57 versus 114; and Rafael Palmeiro, 59 versus 122. Most of these players had over 12,000 career plate appearances.
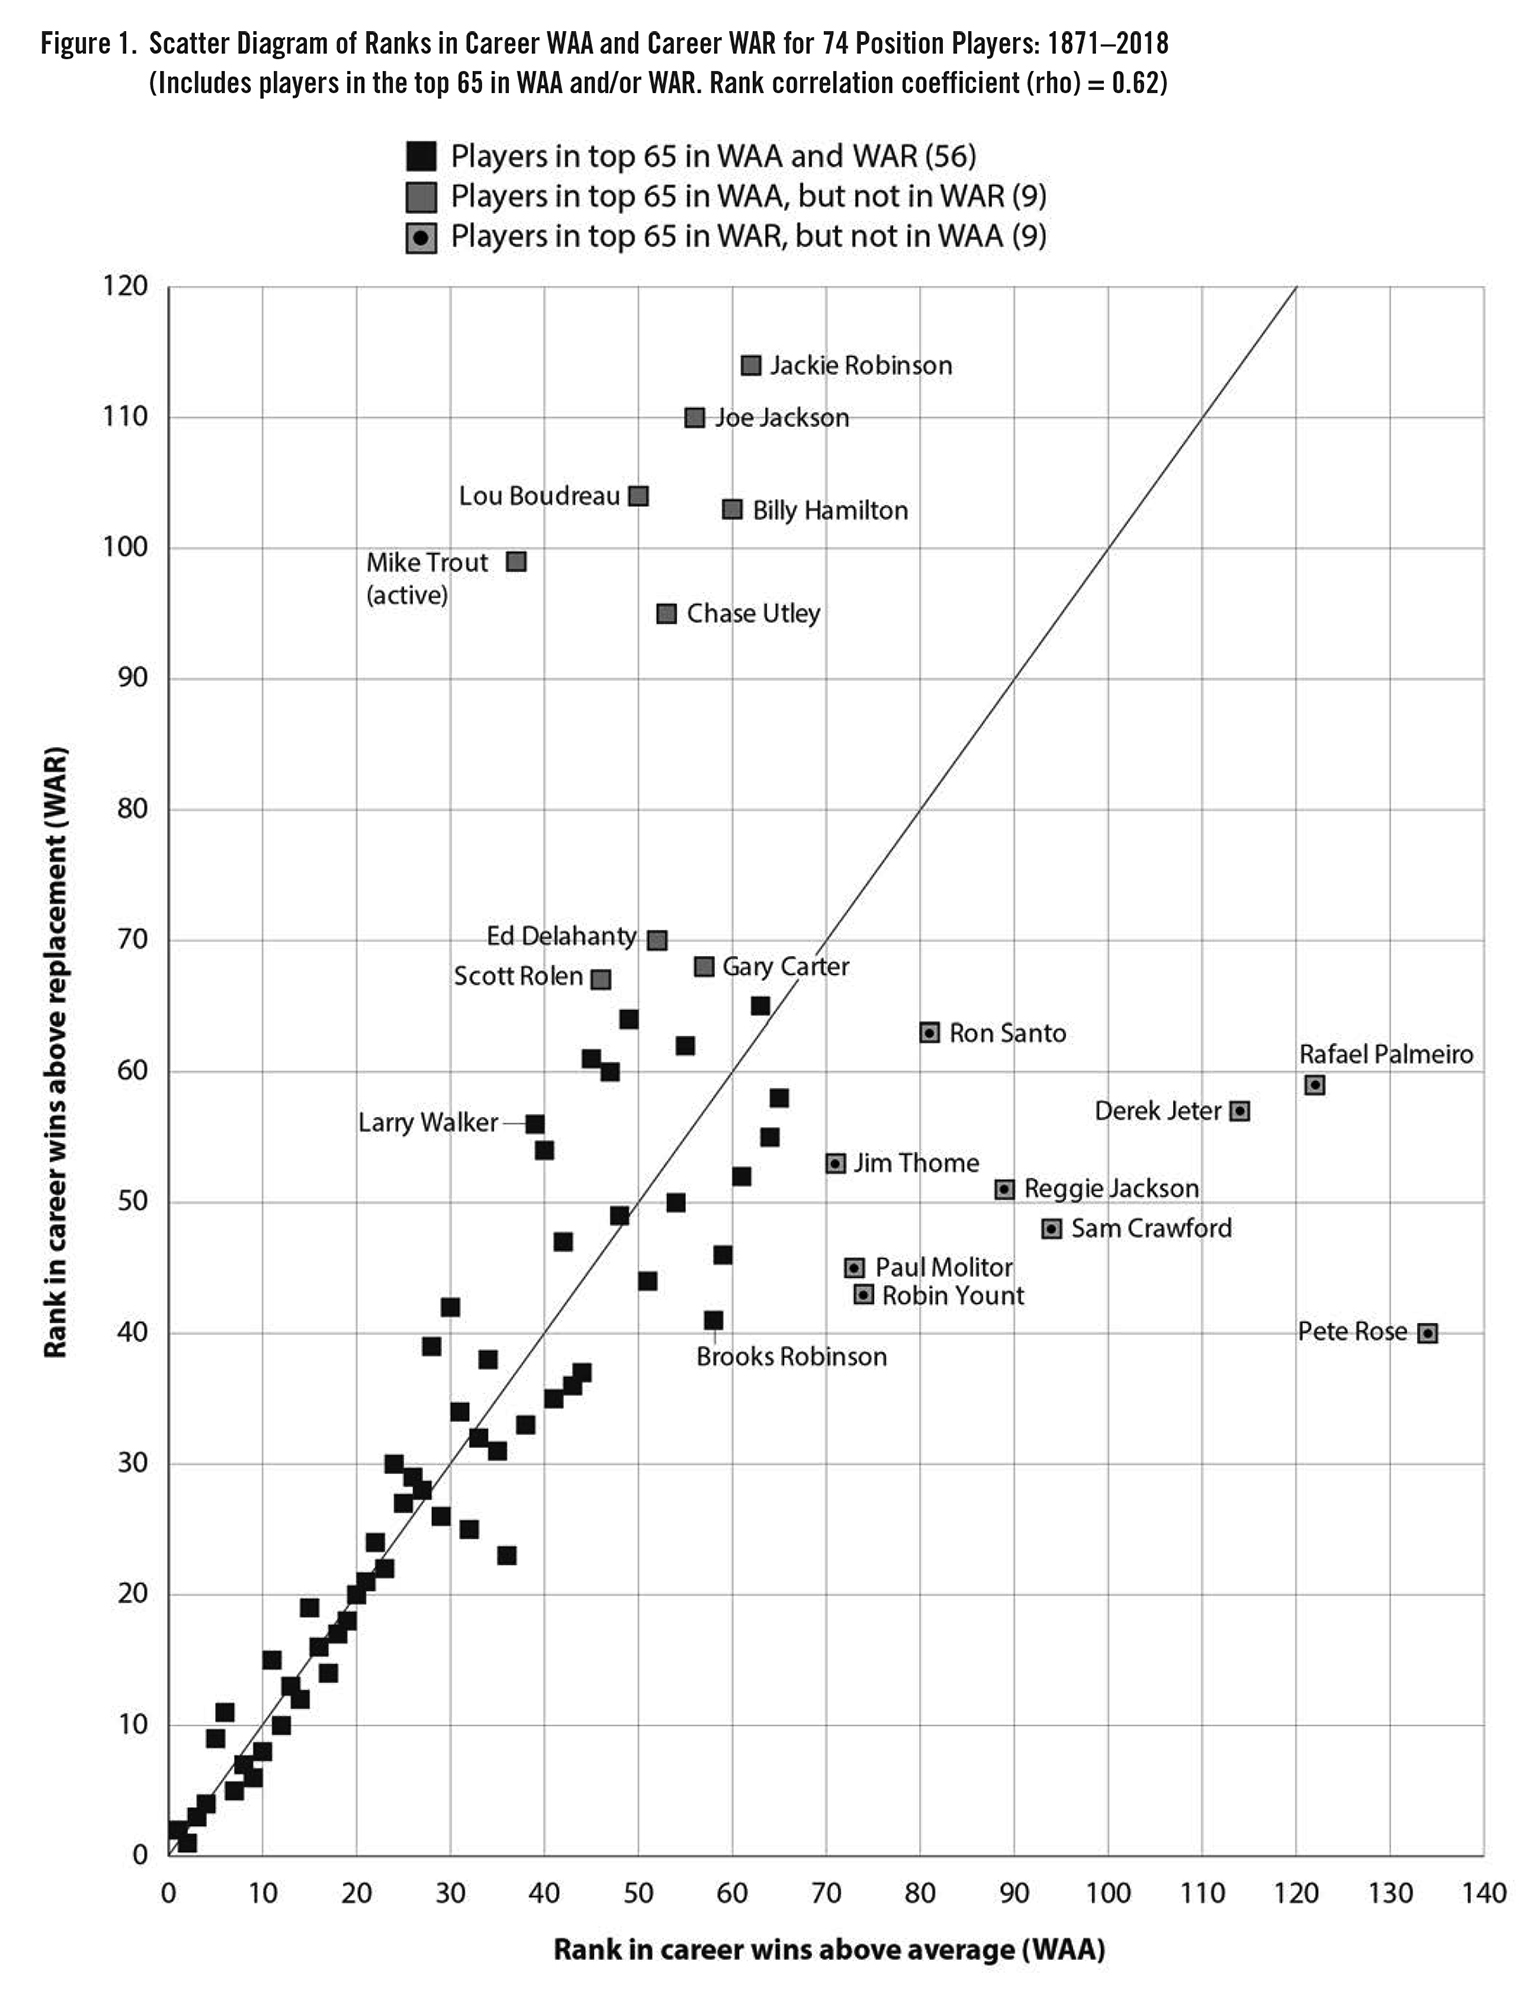
WAA and WAR player rankings from Table 1 are shown in a scatter diagram in Figure 1 for 74 players. These include the 56 players who are among the top 65 in both WAA and WAR, the 9 players who are among the top 65 in WAA only, and the 9 players who are among the top 65 in WAR only. The Coefficient of Rank Correlation (rho) = 0. 62. As would be expected, among the 56 players on both lists, the maximum difference in rankings between WAA and WAR is relatively small; it is 17 for both Larry Walker (WAA of 39 and WAR of 56) and Brooks Robinson (WAA of 58 and WAR of 41). For the other 18 players (those who are in the top 65 on just one of the two measures, WAA or WAR, but not both), the differences in rankings are typically much larger. The largest difference in ranking is 94 for Pete Rose (WAA of 134 and WAR of 40). The largest difference in the opposite direction is 62 for Mike Trout (WAA of 37 and WAR of 99). (This difference may well decrease as Trout’s career progresses.)
The systematic bias noted above can be quantified by comparing the statistical relationship between career plate appearances and the change from WAA ranking to WAR ranking for the 18 players who appear on just one of the two lists. For example, Derek Jeter with 12,602 plate appearances rises 57 places (WAA rank of 114 to WAR rank of 57), and Lou Boudreau with 7,025 career plate appearances drops 54 places (WAA rank of 50 to WAR of 104). For these 18 players, the coefficient of correlation (r) between career plate appearances and change in ranking = 0.96. This means that the coefficient of determination (r squared) = 0.92. Thus 92 percent of the variation in the changes in going from WAA ranking to WAR ranking for these 18 players is due entirely to differences in their numbers of career plate appearances. This supports Darowski’s conclusion as described previously. This is not to question the WAR concept for the purpose that it was developed, but to show that the WAR concept has a pronounced bias when it comes to evaluating overall career performance, including deciding which players should be considered for the Hall of Fame.
The focus in this analysis is on differences in rankings of players by WAA and WAR, as reflected in the discussion above and in Figure 1; however, it may be of interest also to summarize the statistical relationship among the values (as opposed to the rankings) of WAA and WAR. While this not a classic case of trying to quantify the effect of an independent variable (X) on a dependent variable (Y), such as the effect of education on income), WAA is designated here as the independent variable (X), and WAR is designated as the dependent variable (Y), reflecting the fact that WAR adjusts the performance benchmark from that of an average major league player to a top minor league player. Using linear regression, the least-squares line (in the form of Y = a + bX) showing this relationship is WAR = 28.358 + (1.112)(WAA). Consistent with this relationship, for the 74 players, the mean value of WAA is 56.3 and the mean value of WAR is 91.0. The largest difference between a predicted value (using the least-squares line) of WAR and the actual value of WAR for any of the 74 players is for Pete Rose. Given his WAA value of 29.7, his predicted WAR value is 60.7 compared with his actual WAR value of 79.7.
Finally, it is interesting also to look at the percentage of a player’s wins in his WAR value that are due to “showing up,” as defined by Darowski and as discussed above. It is below 30 percent for some of the greatest players of all time: Babe Ruth (22.6 percent), Rogers Hornsby (23.2), Ted Williams (23.6), Barry Bonds (23.9), Mike Trout (24.3, active), Mickey Mantle (27.9), Willie Mays (29.5), and Honus Wagner (29.9). At the other extreme, the percentage of a player’s wins as defined by his WAR value that are due to showing up, is above 50 percent for several players among the top 65 in career WAR, led by Pete Rose at 63.5 percent.
Summary and Recommendations
The data presented in this paper show that the Wins Above Replacement (WAR) concept seriously distorts the evaluation of player performance in Major League Baseball by systematically understating the value of players with relatively short careers and overstating the value of players with relatively long careers (as measured by plate appearances) and are consistent with the findings of Adam Darowski. It is recommended that the evaluation of player performance be shown using values based on the Wins Above Average (WAA) concept and that use of the WAR concept be restricted to its original focus on replacing a major league player with a minor league player.
Table 1
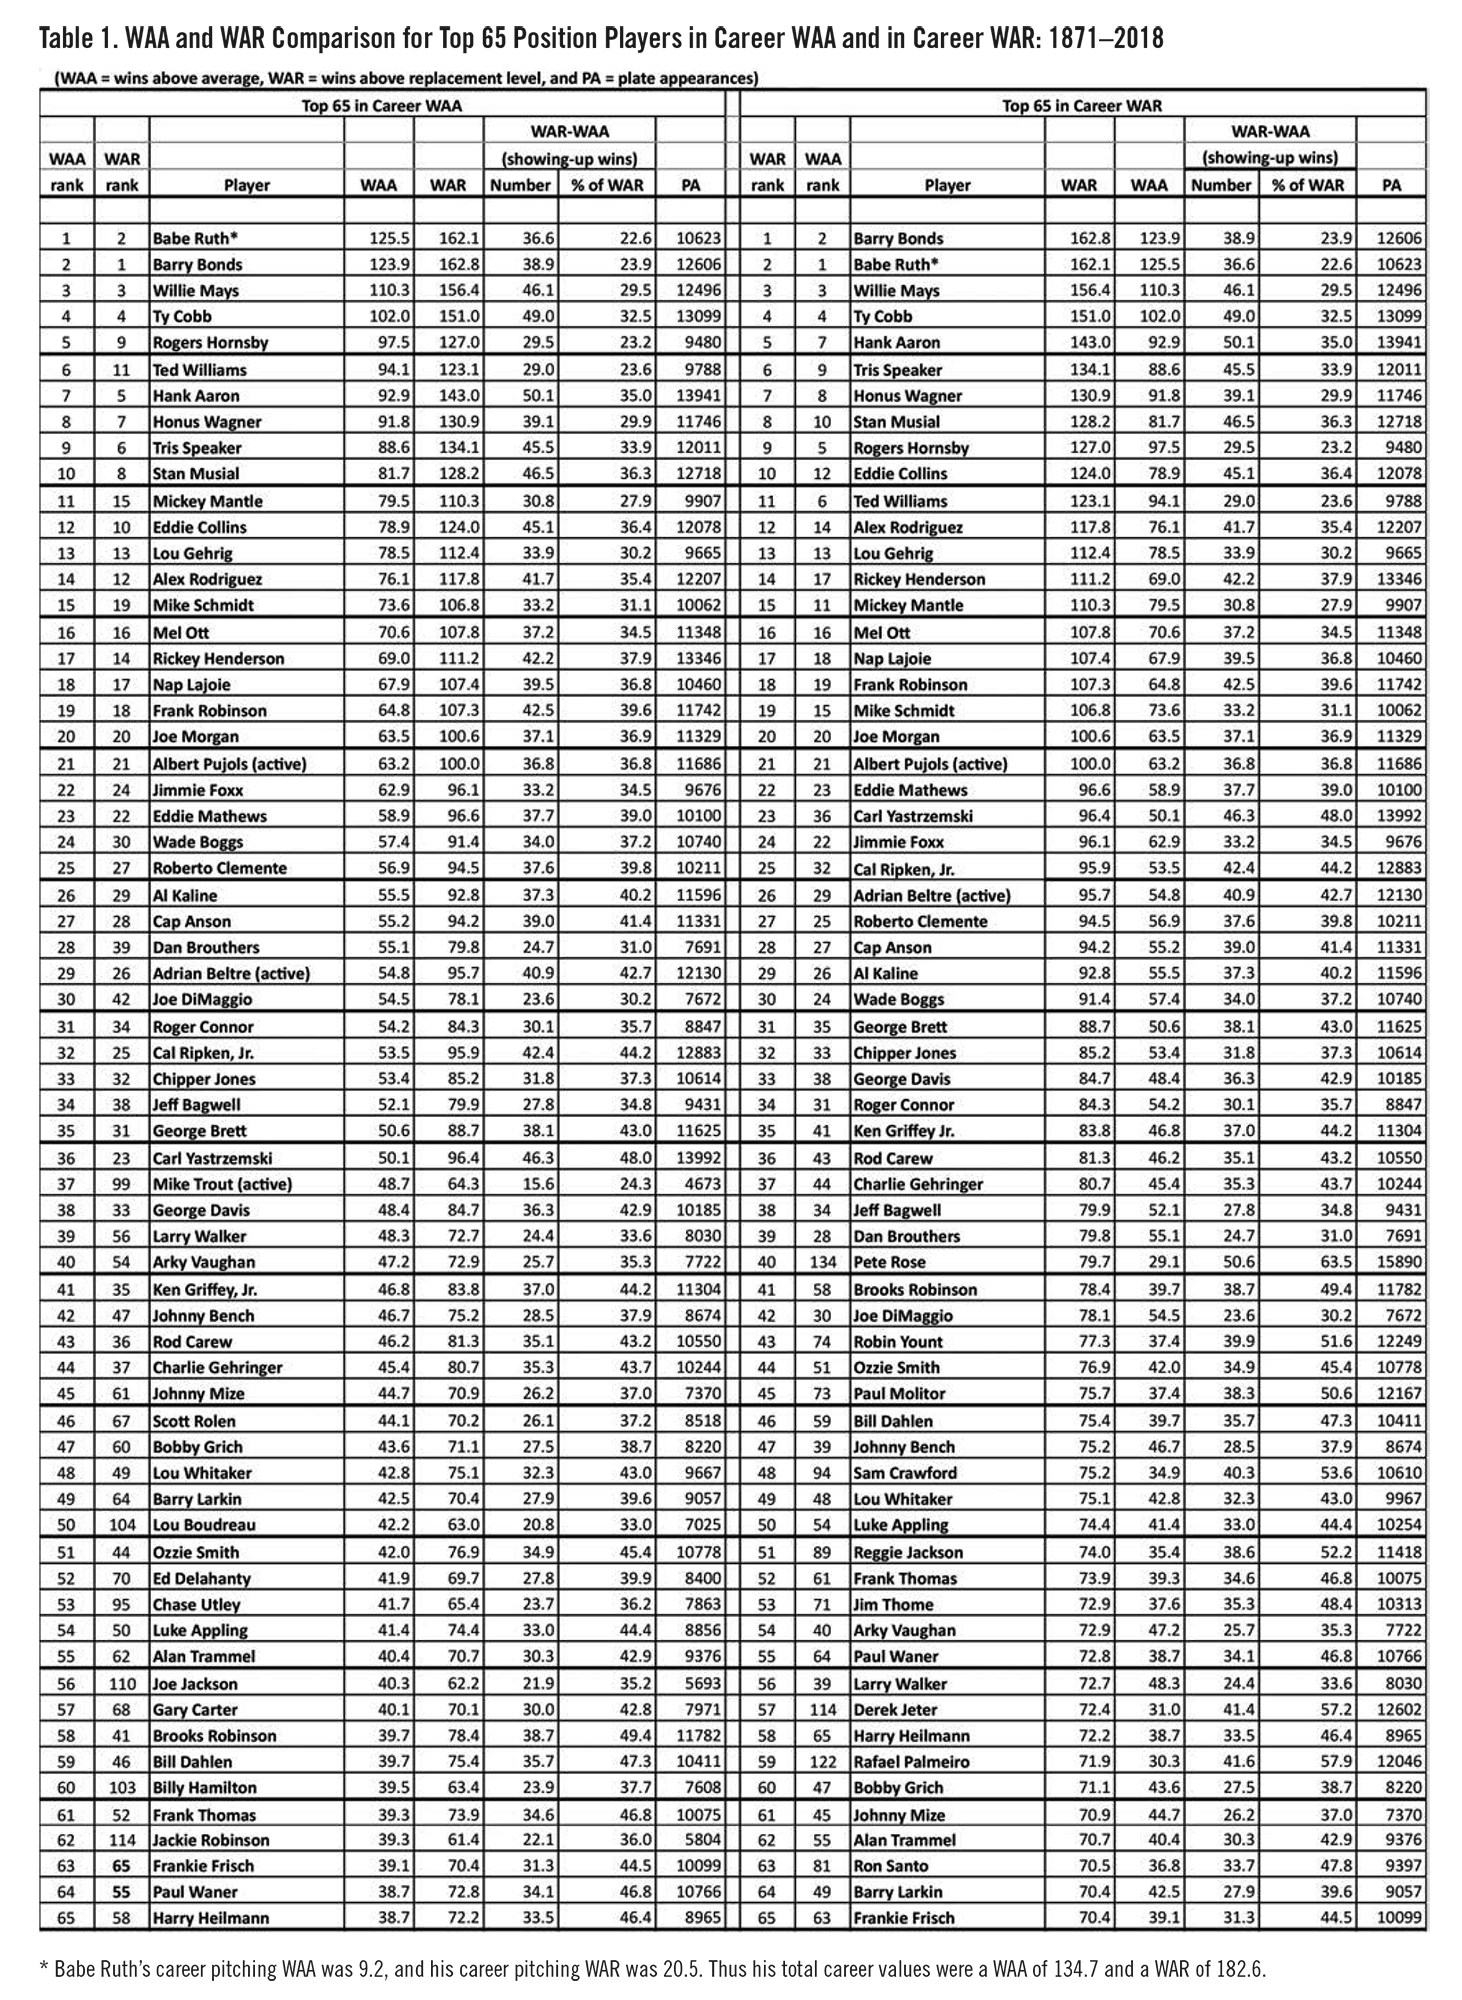
Figure 1
(Click images to enlarge)
CAMPBELL GIBSON, PhD, is a retired Census Bureau demographer. His first article in the BRJ was “Simon Nicholls: Gentleman, Farmer, Ballplayer” published in Vol. 18 (1989).
Acknowledgements
I appreciate the comments and suggestions of two anonymous reviewers, especially the suggestion to add a scatter diagram.
Notes
1 It should be noted that the database for Baseball-Reference.com is much larger than that original Total Baseball dataset, including comprehensive statistics for minor league baseball, and that the database and website are updated almost continuously. The WAR values and statistical values pulled from Baseball-Reference.com reflect what was current on February 1, 2019, and will have changed by the time of publication of this article.
2 For a detailed explanation of these measures, see The Hidden Game of Baseball. For a shorter explanation, see the 8th edition of Total Baseball, pages 976-979.
3 http://www.highheatstats.com/2012/07/wins-above-replacement-war-vs-wins-above-average-waa/.