

Impact of the Varying Sacrifice Fly Rules on Batting Champs, 1931–2019
This article was written by Herm Krabbenhoft
This article was published in Fall 2021 Baseball Research Journal
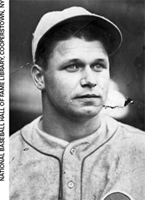
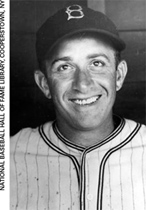
Jimmie Foxx had 11 RBI flyouts in 1932, but only one in 1935. Would these achievements have changed the record books if today’s sac fly rule were in place? (NATIONAL BASEBALL HALL OF FAME LIBRARY)
The official rules currently governing sacrifice flies in Major League Baseball have not always been in use, and have varied.1 From 1908 through 1930, the official rules stipulated that a player who batted in a run with a flyout was credited with a sacrifice hit and not charged an at-bat. In fact, from 1926 through 1930, a player was also credited with a sacrifice hit when he hit a flyout that resulted in any baserunner advancing to any base.
Then from 1931 through 1938, the official rules did not credit a batter with a sacrifice when he hit a flyout which permitted a runner to score (or advance to any base); i.e., an RBI flyout was scored as an at-bat, just like an RBI groundout. For the 1939 season, the sacrifice on a fly was re-instituted, but only for RBI flyouts. The sacrifice fly was again eliminated for the 1940–53 seasons; batters were again charged with an at-bat when they hit an RBI flyout.
Finally, the sacrifice fly rule that has been in operation from 1954 to the present restores the rule that batters who hit RBI flyouts are credited with a sac fly, and an RBI flyout is not charged as an at bat, just as a sacrifice bunt is not charged as an at-bat.
The back-and-forth character of the sacrifice fly rule (i.e., at-bat or no at-bat) has resulted in some interesting “What if?” situations. For instance, one of baseball’s oldest (and at-one-time highly revered) batting metrics is batting average (BA, hits divided by at-bats), with the player with the highest batting average being regarded as the batting champion of his league.2 But which players would have won baseball’s batting crowns if the rule had been consistent since 1931? Specifically:
A. What if the current sacrifice fly rule had been in effect for the 1931–53 period?
B. What if the no-sacrifice-fly rule—the one in effect for the 1931–38 and 1940–53 periods—had continued to be in effect from 1954 to today?
RESEARCH PROCEDURE
To address Question A, I utilized Retrosheet to ascertain the number of RBI flyouts achieved by each player who was the league leader in BA as given on the relevant “League Leaders” pages for the seasons from 1931 through 1953. I examined the Retrosheet Play-By-Play (PBP) narratives for each game in which the player’s Retrosheet Daily file indicated he had one or more runs batted in.
I recorded the batting event for each RBI as follows: two-RBI single (S-2), one-RBI double (D-1), one-RBI groundout (GO-1), one-RBI flyout (FO-1), one-RBI walk (W-1), etc. I did the same for each player who finished with a BA within .020 of the leader’s league-leading mark. With complete RBI flyout numbers then in hand, I was able to ascertain the values for a player’s hypothetical BA (i.e., his BA computed with RBI flyouts treated as not being at-bats). With regard to Question B, the hypothetical BA was obtained using the official statistics for sacrifice flies and treating sac-flies as at-bats.
RESULTS
A. What if the Present Sac-Fly rule (No At-Bat) had been in effect for the 1931–53 period?
Table 1 summarizes the five times that a player did not win his league’s batting title during the 1931–53 period because of the “no Sac-Fly” rule. As can be seen, nearly half of the players listed became Hall of Famers. Twice the “no Sac-Fly” rule precluded a player from winning the esteemed Triple Crown of batting.
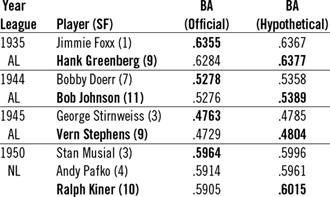
Table 1. Hypothetical BA Champs if the 1954 Sac-Fly Rule
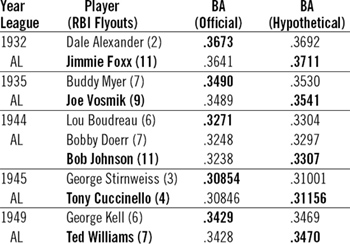
The first hypothetical change in a batting average king occurred in 1932. The actual 1932 AL batting champion was Dale Alexander, who compiled a batting average of .367 (144 hits in 392 AB).3 Jimmie Foxx finished second with a .364 mark (213 hits in 585 AB). Had the current Sac-Fly rule been operative in 1932, Foxx would have won the batting crown. According to Retrosheet, two of Alexander’s 60 RBIs came via flyouts, which when treated as non at-bats, would adjust his batting average to .3692. Foxx, meanwhile, had eleven RBI flyouts, which—if not counted as at-bats—yields an adjusted batting average of .3711. Since Double X was also the AL leader in home runs (58) and runs batted in (168), he would have won the batting Triple Crown.4
At the conclusion of the 1935 campaign, Buddy Myer emerged with the highest batting average: .3490 (215 hits in 616 AB). Joe Vosmik was runner-up: .3484 (216 hits in 619 AB).5 Jimmie Foxx came in third: .346 (185 hits in 535 AB). However, Vosmik would have been the batting champ if the current Sac-Fly rule had been in effect. Myer had 7 RBI flyouts, which would have given him a hypothetical .3530 BA. Vosmik had 9 RBI flyouts, giving him a hypothetical .3541 BA. Foxx, with only one RBI flyout, would have ended up with .3464.
The 1944 campaign provides the next possible hypothetical change for the occupant of the batting throne. According to the official rules and records, Lou Boudreau compiled the highest qualifying batting average in the American League. With 191 hits in 584 at bats he fashioned a .3271 BA. Close behind were Bobby Doerr (.3248) and Bob Johnson (.3238). Had the current Sac-Fly rule been in effect, all three of these players would have had a higher batting average. According to the PBP details given on the Retrosheet website, Boudreau had six RBI flyouts (which afford an adjusted BA of .3304). Similarly, Doerr’s seven RBI flyouts give him an adjusted BA of .3297. And, Johnson’s eleven RBI flyouts provide him a modified BA of .3307. Thus, it appears that Johnson won our hypothetical batting title. However, there’s an uncertainty connected with Boudreau’s adjusted BA.
In addition to the six clearly-stated RBI flyouts given in the Retrosheet PBPs, there are three RBI plays with the following deduced descriptions:
- June 21 (at Detroit), first inning. “Boudreau out on an unknown play [Peters scored, O’Dea to second].”
- July 1 (at Washington), fourth inning. “Boudreau out on an unknown play [Hoag scored (unearned)].”
- September 20 (vs. Boston), fourth inning. “Boudreau out on an unknown play [Rocco scored].”
Each of these deduced “out on an unknown play” events could be a groundout-RBI or a flyout-RBI. To ascertain which, if any, of these three “unknown plays” was an RBI flyout, I examined the game accounts in pertinent newspapers and found that Boudreau made infield outs in each of the first two games. Unfortunately, the newspaper text descriptions did not resolve the “unknown play” for the third game. Thus, if the “unknown play” was an infield out, Boudreau’s adjusted BA would still be .3304 and Johnson’s hypothetical .3307 BA would still be the highest. However, if the “unknown play” was an outfield flyout, then Boudreau’s adjusted BA would be .3310, resulting in Boudreau retaining the batting crown.6,7
The 1945 AL batting race remains the closest race in history, with a slim .00008 separating the champion’s .30854 batting average from the runner-up’s .30846. George “Snuffy” Stirnweiss, playing in 152 games, amassed 195 hits in 632 at bats to carve out his league-leading .309 mark, while Tony Cuccinello accumulated 124 hits in 402 at bats in the 118 games he played for his second-place .308 BA. However, when one takes into account the RBI flyouts each man had, Cuccinello emerges with the higher hypothetical batting average. Cuccinello, with four RBI flyouts, has an adjusted BA of .31156, while Stirnweiss, with three RBI flyouts, has an adjusted BA of .31001.8 The 1945 campaign was Cuccinello’s final season of his 13-year big league career. Playing “full time” for the first time since 1940, he was basically a “war-time replacement player” during the 1943–45 seasons. Had the current Sac-Fly rule been operative in 1945, he would have been the first and only player to be a BA king in his final major-league season.
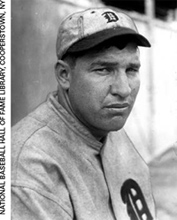
Dale Alexander won the 1932 batting title with an official batting average of .3673, but if sacrifice flies had not been counted as at-bats, he would have been edged out by Jimmie Foxx. (NATIONAL BASEBALL HALL OF FAME LIBRARY)
In 1949, the chase for the AL batting crown came down to the final day, October 2. Before that day’s diamond action commenced, Boston’s Ted Williams had the highest BA: .344. Detroit’s George Kell was next at .341. As the day unfolded, Williams went 0-for-2 with a pair of walks in Boston’s 5–3 loss to the pennant-clinching Yankees. The Splendid Splinter finished with a .3428 BA (194 hits in 566 AB).
Kell’s Tigers also did not fare well, dropping its game to Cleveland, 8–4. But Kell did well from the batter’s box, collecting two hits in three at bats plus a walk, finishing at .3429 (179 hits in 522 at bats). What would have been the final result if the current Sac-Fly rule had been in place? Kell had six RBI flyouts on the year, which would have boosted his average to .3469 if they had not counted against his at-bats. However, Williams had seven RBI flyouts, which would have elevated his BA to .3470. Teddy Ballgame would have won his third consecutive batting crown and—since he also led the AL in homers (43) and RBIs (159, tied with teammate Vern Stephens)—he would have earned his third Triple Crown.
While there were a few other very close batting races during the 1931–53 period, such as the 1931 NL race (Chick Hafey at .3489 and Bill Terry at .3486) and the 1953 AL race (Mickey Vernon at .3372) and Al Rosen at .3356), but after adjustment the winner remained in the lead.9,10 One other no-sac-fly-impacted batting average item is worth mentioning. In 1941, Ted Williams batted a lusty .406 (185 H in 456 AB), but had his eight RBI flyouts not been counted as at-bats, his batting average would have been .413.
B. What if the “no Sac-Fly” rule (1931–38 and 1940–53) had remained in effect to the present?
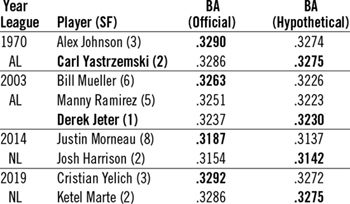
If the 1953 Sac-Fly rule had not been changed there would have been four different batting kings (Table 2). In 1970, Alex Johnson edged out Carl Yastrzemski for the AL batting title, .32899 to .32862. However, because Johnson had three sac-flies and Yaz had two, Johnson’s adjusted BA would be .32739 while Carl’s would be .32746 and Yastrzemski would have captured the batting throne by .00007 points. It would have been Yaz’s fourth BA title. Similarly, Derek Jeter would have catapulted over both Manny Ramirez and Bill Mueller in 2003, Josh Harrison would have overtaken Justin Morneau in 2014, and Ketel Marte would have surpassed Christian Yelich in 2019 to earn hypothetical batting titles.
In addition to the hypothetical changes shown in Table 2, Carl Yastrzemski would have surfaced as the 1968 AL batting king with a sub-.300 mark. Yaz, who put together an official batting average of .301 (162 hits in 539 at bats), had four no-at-bat-sac-flies. Had those four sac-flies been at-bat RBI flyouts, his official batting average would have been reduced by three points, to a hypothetical .298.
Table 2. Hypothetical BA Champs if the 1953 Sac-Fly Rule
OTHER HYPOTHETICAL CHANGES
While the traditional batting averages and batting championships are/were historically considered important, they are certainly not viewed with esteem and utility by many of today’s baseball analysts.11 Perhaps the only traditional batting metric still considered at least somewhat worthwhile is slugging average (total bases divided by at bats), which has been included in the annual baseball guides such as Spalding’s Official Base Ball Guide since 1924 for the National League, and since 1947 for the American League (for example, in The Sporting News Official Baseball Guide).
Tony Cucinello would have beaten George Stirnweiss for the 1945 AL batting crown had that season been played under today’s sac fly rules. (NATIONAL BASEBALL HALL OF FAME LIBRARY)
In addition to ascertaining the hypothetical batting champions impacted by the varying sac-fly rules, I also determined the hypothetical slugging kings, as well as the hypothetical leaders in one of today’s more-highly-valued and seemingly ubiquitous batting metrics, on-baseplus-slugging (OPS), which made its in-print debut in 1984.12 Table 3 provides the information for the hypothetical slugging average leaders analogous to Table 1 (i.e., if the 1954 “yes-SF” rule had been utilized for the 1931–53 period).
As can be seen, Hank Greenberg would have surpassed Jimmie Foxx in 1935, Bob Johnson would have overtaken Bobby Doerr in 1944, Vern Stephens would have supplanted George Stirnweiss in 1945, and Ralph Kiner would have leapfrogged over both Andy Pafko and Stan Musial in 1950. According to my research, there would not have been any hypothetical changes in the OPS leaders (and no change in the On-Base Average leaders13).
Table 3. Hypothetical SLG Kings if the 1954 Sac-Fly Rule
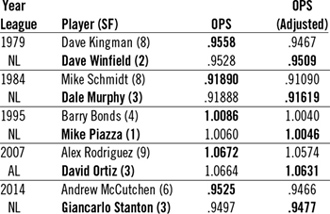
Tables 4 and 5 present the corresponding adjusted SLG and OPS numbers analogous to Table 2, showing the leaders if the 1953 “no-SF” rule had been used 1954–2019. Joe Adcock would have fashioned a higher adjusted slugging average than Duke Snider in 1956. Similarly for Orlando Cepeda and Frank Robinson in 1961, Andres Galarraga and Darryl Strawberry in 1988, and Carlos Quentin and Alex Rodriguez in 2008. And, as shown in Table 5, Dave Winfield compiled a higher adjusted OPS than Dave Kingman in 1979. Likewise for Dale Murphy and Mike Schmidt in 1984, Mike Piazza and Barry Bonds in 1995, David Ortiz and Alex Rodriguez in 2007, and Giancarlo Stanton and Andrew McCutchen in 2014.
Table 4. Hypothetical SLG Kings if the 1953 Sac-Fly Rule
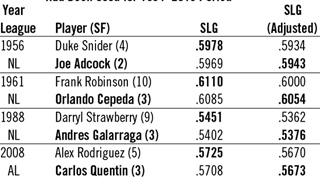
Table 5. Hypothetical OPS Kings if the 1953 Sac-Fly Rule
CONCLUDING REMARKS
I emphatically declare that I am not advocating the changing of any official records impacted by the various rules regarding sacrifice flies. Jimmie Foxx (in 1932) and Ted Williams (in 1949) should not be granted Triple Crowns because officially there were no sacrifice flies in those seasons, and Dale Alexander and George Kell earned their batting crowns fair-and-square. Likewise, for all of the other players shown as official batting kings or classified as “hypothetical batting kings” in Tables 1 and 2 and the hypothetical slugging percentage kings and OPS leaders shown in Tables 3–5.
HERM KRABBENHOFT, a retired organic chemist, has been a SABR member since 1981 and is the author of Leadoff Batters of Major League Baseball (McFarland, 2006).
Acknowledgments
It is a pleasure to thank Pete Palmer, Tom Ruane, and Dixie Tourangeau for their inputs and help with the research I carried out for this project, some of which was described previously in a presentation I made at the Baseball Records Committee Meeting at the SABR 45 Convention (Chicago, June 2015, “The Impact of the Sac-Fly Rule on Baseball Royalty…The Kings of the Percentage Crowns for Batters”).
Dedication
I should like to dedicate this article to my good friend and fellow SABR member Art Neff. Thanks, Art, for your fantastic collaboration in documenting the uniform numbers of Detroit Tigers players (1931–2019) and all the great times we’ve shared at SABR meetings and ballgames as we achieved the feat of attending and scoring at least one game at every current major league ballpark through the 2019 season. All the best for you and Sue!
Notes
1. John Schwartz, “The Sacrifice Fly,” The Baseball Research Journal, 1981, 150–58.
2. “Spalding’s Official Base Ball Guide, 1877,” provides (pages 50–51) the “batting averages of players who have taken part in six or more championship games.”
3. However, there has been some disagreement with the official position. For example, in its file of ML League Leaders for the 1932 season, for the AL BAVG, Retrosheet has the following rank-order list: “.364 Foxx PHI; .349 Gehrig NY; .367 Alexander DET-BOS; .342 Manush WAS.” Both BAVG and Alexander are shown with plus (+) signs, directing the reader to the statement “Alexander was officially recognized as winning the batting title.”
4. According to the Retrosheet Player Daily file for Jimmie Foxx for 1932, Foxx amassed a total of 168 RBIs, one RBI fewer than the 169 RBIs given in the AL’s official DBD records. The discrepancy is attributable to the second game of the Boston vs. Philadelphia double header on August 13: The official DBD records mistakenly show Foxx credited with one (1) RBI. The Athletics scored eight runs in the game, with, according to the official records, the runs batted in by Jimmy Dykes (1), Foxx (1), Mule Haas (2), and Bing Miller (4). According to Retrosheet’s detailed PBP narrative, there are no discrepancies with the official RBI numbers for Dykes, Haas, and Miller. However, as stated in the Retrosheet PBP for the third inning, Philadelphia scored its one run as follows: “Bishop walked; Haas out on a sacrifice bunt (pitcher to first) [Bishop to second]; Cochrane popped to shortstop; Kline threw a wild pitch [Bishop scored]; Simmons singled to first; Foxx walked [Simmons to second]; McNair forced Simmons (third unassisted).” Thus, Foxx did not have any RBIs in the game and his full-season total is 168, not 169, RBIs.
5. According to the Retrosheet Player Daily file for Joe Vosmik for 1935, Vomik amassed a total of 619 at-bats, one fewer than the 620 at-bats given in the AL’s official DBD records. The discrepancy is attributable to the St. Louis vs. Cleveland game on June 03: The official DBD records show Vosmik with seven (7) at bats. The Retrosheet box score and PBP details show that Vosmik had six (6) at bats in seven plate appearances — (1) he doubled in the first; (2) he walked in the third; (3) he flied out to right in the fifth; (4) he flied out to right in the seventh; (5) he popped out to the catcher in the tenth; (6) he flied out to right in the twelfth; (7) he singled in the fourteenth. Thus, in actuality, Vosmik achieved a final batting average of .3489 (216 H in 619 AB), as shown in Table 1, not a final batting average of .3484 (216 H in 620 AB), as given in the official AL DBD records.
6. The details for Boudreau’s six FO-RBIs are given here: (1) April 30 (second game) (5th inning) – “Boudreau flied out to right [Heath scored];” (2) May 31 (8th inning) – “Boudreau flied out on an unknown play [Keltner scored (unearned)];” (3) July 07 (1st inning) – “Boudreau flied out on an unknown play [Seerey scored (unearned)];” (4) July 13 (first game) (1st inning) – “Boudreau hit into a double play to center [O’Dea scored, Hockett out at third (center to first to third)];” (5) July 13 (second game) (4th inning) – “Boudreau flied out to left [Rocco scored];” (6) August 16 (8th inning) — “Boudreau flied out to right [Hockett scored].”
7. It is also noted that the Retrosheet PBP file for Doerr has one “unknown play” in which Doerr was credited with one RBI: July 20 (Boston at Chicago, 8th inning)—”Doerr out on an unknown play [Fox scored, B. Johnson to second].” According to the game account provided in the Chicago Tribune, “Fox did most of the damage against Maltzberger in the eighth, hitting a triple with the bases loaded and scoring on an infield out [by Doerr].”
8. It is noted that Retrosheet’s “ML Leaders” file for 1945 does not include Cuccinello as the AL player with second highest batting average. the Retrosheet procedure for generating its list of the top four players uses the 1957 official rules, which require a minimum of 3.1 plate appearances per scheduled game for a player’s team. [Tom Ruane, email to Herm Krabbenhoft, February 28, 2021] Thus, according to Retrosheet, 477 plate appearances were required for a player to qualify for the batting title (and be included in the list of the players with the four highest batting averages). However, Retrosheet’s position is not in alignment with the “official rules” of major league baseball for the 1945 season. Actually, according to the official rules for major league baseball, there were no minimum requirements to qualify for the batting title; this was the situation for all seasons prior to 1950. The customary practice, however, was to award the batting championship to the player with the highest batting average — provided he played in at least 100 games. Beginning with the 1950 season, the official rules specified that “to be eligible for the individual batting championship of a major league, a player must be credited with at least 400 times at bat.” Thus, Cuccinello, who played in 118 games and had 402 at bats would have been eligible for the individual batting title in 1950 — as well as in 1945. Indeed, several baseball encyclopedias [e.g., The Baseball Encyclopedia (ten editions, Macmillan), Total Baseball (eight editions, several publishers), The ESPN Baseball Encyclopedia (five editions, Sterling)] each show the top five AL batters for 1945 as follows—Stirnweiss (.309), Cuccinello (.308), Dickshot (.302), Estalella (.299), and Wyatt (.296).
9. Not surprisingly, shortly after it was announced that the sacrifice fly rule had been re-instituted [Hy Turkin, “Batters Get Break in Rule Change,” The Sporting News, Volume 136, Number 16 (November 11, 1953), 1–2], the following was reported in The Sporting News [Volume 136, Number 17 (November 18, 1953), 14]: “Had the sacrifice fly rule been changed one year earlier, it would not have affected the American League batting championship, according to Hal Lebovitz of the Cleveland News. ‘Al Rosen and Mickey Vernon hit six sacrifice flies in 1953, scoring runners from third base, and, therefore, Vernon would have remained ahead of Rosen,’ Lebovitz wrote. ‘Eliminating a time at bat each sacrifice fly, Rosen’s average advances from .336 to .339. Vernon’s jumps from .337 to .341.’”
10. Similarly for the 1953 National League batting title: Roscoe McGowan reported in The Sporting News [Volume 136, Number 18 (November 25, 1953), 6]: “Carl Furillo brought five mates home from third base for a potential batting average gain of four points, which would have made his league-leading mark .348.” In the previous issue [J. Roy Stockton, “Rule Changes Please Players,” The Sporting News, Volume 136, Number 17 (November 18, 1953), the following was reported: “Bob Broeg (Post-Dispatch baseball writer) furnished statistics on Stan Musial and Red Schoendienst to show the effect the sacrifice fly would have had on their 1953 batting marks. Musial, who hit .337, hit eight run-scoring flies, and if they had been sacrifices, Stan would have finished the season with .342. Schoendienst hit .342 and five run-scoring flies, if sacrifices, would have made his average .345.” Schoendienst’s official .342 placed second to Furillo’s official .344.
11. Anthony Castrovince, A Fan’s Guide to Baseball Analytics (New York: Sports Publishing, 2020), 4–7.
12. John Thorn and Pete Palmer with David Reuther, The Hidden Game of Baseball (Garden City, NY: Double Day & Company, Inc., 1984), 69; Alan Schwartz, “The Numbers Game,” (New York: St. Martins Press, 2004), 165, 233; Bryan Grosnick, “Separate but not quite equal: Why OPS is a ‘bad’ statistic,” beyondtheboxscore.com, September 18, 2015. Accessed January 20, 2021. See also: Tom Tango, “This is a step-by-step explanation as to why you should use some form of modified OPS, and not just OPS,” insidethebook.com, February 07, 2007. Accessed January 20, 2021; Pete Palmer, “Why OPS Works,” The Baseball Research Journal, Volume 48, Number 2 (Fall 2019), 43–47.
13. On Base Average (OBA) [the sum of (times on base via hits, walks, and hit by pitched balls) divided by the sum of (at bats plus walks plus times hit by pitched balls plus sacrifice flies)] was formulated by Branch Rickey and Alan Roth in 1954 and became an official stat in 1984; see: (a) Branch Rickey, “Goodby to Some Old Baseball Ideas,” Life, August 2, 1954, 79–89; (b) Pete Palmer, “On Base Average for Players,” The Baseball Research Journal, 1973, 87–91; (c) Ray C. Fair and Danielle Catambay, “Branch Rickey’s Equation Fifty Years Later,” Cowles Foundation Discussion Paper No. 1529, July 2005 (Revised, January 2007), Cowles Foundation for Research in Economics, Yale University, New Haven CT. It should be emphasized that on base average is not impacted by the varying Sac-Fly rules for the 1931–38, 1940–53, and 1954–2019 periods because (a) for the 1931–38 and 1940–53 periods, there were no sacrifice flies (i.e., RBI flyouts were at bats) and because (b) for the 1954–2019 period, sacrifice flies are included in the denominator of the OBA formula. For the exceptional 1939 season, the OBA league leaders were, as given on Baseball-Reference.com) Jimmie Foxx (AL, .466) and Mel Ott (NL, .449). It is pointed out that these OBA values were computed without including sacrifice flies — because sacrifice flies were not specifically tabulated in the official records: the official records only tabulated the sum of sacrifice hits (bunts) and sacrifice flies. Including Sac-Flies, as ascertained by examining the pertinent Retrosheet PBP narratives (5 for Foxx and 9 for Ott), in the denominator yields adjusted (true) OBA values of .462 and .441, respectively. According to my research, no AL player had a higher adjusted (true) OBA number than Foxx; likewise, no NL player had a higher adjusted (true) OBA number than Ott.
APPENDIX — Details for FlyOut RBIs (FO–RBIs) for Selected Players (1931–53)
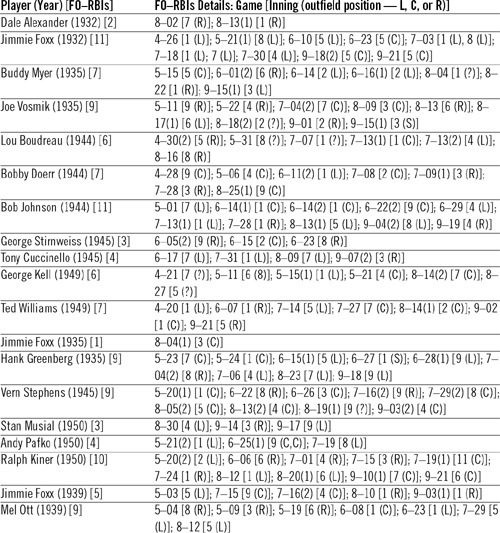
(Click image to enlarge)
Appendix notes
1. These FO-RBI details are taken from the Retrosheet PBP narratives; the outfield positions are Left (L), Center (C), and Right (R). For some FO-RBIs the Retrosheet PBP narrative states “player-A flied out on unknown play [player-B scored].” For these the fielding position is shown as a question mark i.e., (?).
2. For some FO-RBIs the fielder was an infielder; for these the fielding positions are abbreviated as follows — First (F), Second (S), Shortstop (SS), Third (T).
3. The FO-RBIs for Foxx (1939) and Ott (1939) were officially recorded as sacrifice hits; see endnote 13.