

When the Fans Didn’t Go Wild: The 2020 MLB Season as a Natural Experiment on Home Team Performance
This article was written by Elliott Fullmer - J. Furman Daniel III
This article was published in Fall 2021 Baseball Research Journal
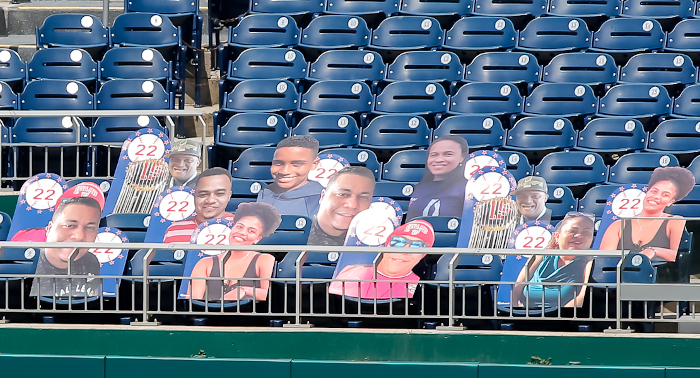
Juan Soto’s family represented as cardboard cutouts at Nationals Park in 2020. (Photo by Ed Shea/All Pro Reels)
The 2020 Major League Baseball season was unprecedented, as games were played without fans for the entire COVID-19-abbreviated schedule, creating a unique environment for study of the effect of fans on MLB team performance.
The season almost never happened at all. After the COVID-19 pandemic abruptly halted Spring Training and delayed Opening Day, players and owners squabbled for months over a plan to return to the field. As the virus continued to kill thousands each week and compromise the global economy, an agreement was finally reached to play 60 regular season games with significant scheduling and travel modifications, notable rule changes, and increased safety protocols. Teams would travel shorter distances than usual, playing games only against regional opponents. The National League (NL) would adopt the Designated Hitter (DH) for the first time. Regarding safety protocols, the most striking change was the exclusion of fans and nonessential personnel from all 2020 MLB games.
With the exception of an April 29, 2015, White Sox-Orioles game played without fans due to rioting in the city of Baltimore, this was uncharted territory. This new reality produced a powerful consensus — seemingly everyone could concur that they missed fans in the ballparks.
While the circumstances of the 2020 MLB campaign were far from ideal for owners, coaches, players, and fans, the season does present a unique research opportunity. Home-field advantage has long been observed in all major team sports, including baseball. While the advantage in baseball is smaller than in other sports, an MLB team could historically be expected to win between six and seven more games at home than on the road in a given season (Moskowitz and Wertheim, 2011).1 Over the past several decades, researchers have sought to explain this persistent phenomenon. While multiple explanations have been advanced, the most common centers on the effect of attending crowds. Cheering (or booing) fans, the argument goes, affect the performance of players or umpires, leading to advantages for the home team.
Because the 2020 MLB season was played without crowds, we are able to test the impact of fans on game outcomes through this unique natural experiment. If crowds are indeed the primary driver of home-field advantage, then we should expect home teams to perform more poorly in 2020 than they typically do. We examine all 8,188 MLB games played from 2017 through 2020 in an effort to assess whether the absence of fans reduced home-field advantage in 2020. To our surprise, it did not. Home teams continued to enjoy comparable success, winning 55.7% percent of their games in 2020. This figure was actually slightly higher — albeit not significantly so — than that observed in the three previous seasons. Through a series of multivariate OLS and Probit regressions, we also report that the unique travel circumstances associated with 2020 had no effect on home team performance. Predictably, home team quality did have a strong, positive relationship with on-the-field success.
Our work proceeds in several steps. First, we discuss the logic regarding why home crowds arguably should confer an advantage to MLB home teams. Second, we briefly address the relevant scholarly literature. Third, we present our methods and findings. Finally, we discuss the implications of our results, as well as some potential directions for future research.
FANS AND HOME-FIELD ADVANTAGE
The impact of fans on the outcome of professional sporting events has long been part of popular lore and conventional wisdom. To take an early literary example, Ernest Lawrence Thayer’s 1888 poem Casey at the Bat is as much about the emotions of the crowd as it is about the failure of the title character. Indeed, the prospect of their hero having a chance to win the game transforms the atmosphere from a “pall like silence” to a “lusty yell” which echoed from “five thousand throats.” The fictitious crowd is so invested in the outcome of the game that they even threaten to, “‘Kill him! Kill the umpire!’…[A]nd it’s likely they’d have killed him had not Casey raised his hand [and] [W]ith a smile of Christian charity…stilled the rising tumult; he bade the game go on.” While Casey ultimately strikes out and leaves the Mudville faithful with “no joy,” the logic is brutally simple; the crowd has power and influence (Thayer, 1888).
In theory, the power to affect outcomes comes in two basic forms: 1) the ability to change the performance of players and 2) the ability to change the performance of umpires. Arguably, fans can use their cheers to either exert a positive energy or a negative one. When applied to players, positive energy would encourage them to play harder, have confidence in their own abilities, and know that they are loved — presumably all things that will result in improved performance of home team athletes. When applied to umpires, this encouraging form of cheering would provide positive reinforcement for calls that benefit the home team — something that would result in their players having increased success thanks to a systematic bias in their favor.
Conversely, conventional wisdom would suggest that cheering also has more sinister or negative uses — those of negative reinforcement or coercion through peer-pressure. Fans booing players or umpires, for example, could worsen the performance of visiting athletes or influence the impartiality of officials in favor of the home team.
This theory has a simple and appealing logic for fans, players, and owners alike.2 Not only is it intuitive that cheering influences the outcome of the game, but the belief that fans play their own role in determining the outcome of games helps maintain fan interest, merchandise sales, and attendance. While there are plausible theoretical and psychological explanations for it, does the evidence support the hypothesis that fan participation is the primary catalyst for home-field advantage?
LITERATURE
Despite the fact that millions of fans spend billions of dollars to attend live sporting events worldwide each year, their impact on the outcome of actual games was not rigorously tested until recent decades. The lack of serious study is the failure of both sports teams and academics. Until recently, sport franchises tended to be some of the least analytically inclined businesses, preferring to trust their scouts, coaches, and “insiders” to make decisions about how to construct and manage their teams.3
What analytics they did conduct were proprietary in nature and thus not shared outside their limited circle for fear of other teams copying or exploiting their own methods. Similarly, until recently, few academics seriously studied sports in a rigorous manner and few peer-reviewed journals existed to validate their work and expose it to a broader audience.
The first major academic analysis regarding the impact of home-field advantage on team performance was published in 1977 by Barry Schwartz and Stephen F. Barsky. In this groundbreaking work, the authors concluded that there was a very strong, positive correlation between playing at home and team performance. The authors reported that home-field effects were most pronounced in “indoor” sports such as ice hockey and basketball and less pronounced in “outdoor” sports such as baseball and football. While this study had some methodological limitations, it made a critical breakthrough for future researchers — home team advantages were due primarily to social forces from the crowd. Meanwhile, the authors concluded that factors such as visiting team fatigue and (un)familiarity with the home arena had no measurable impact on the outcome of games.
Schwartz and Barsky’s research spurred a series of follow-on studies which generally supported their initial findings regarding a strong correlation between fan participation (e.g. noise level, attendance, behavior, etc.) and team performance. With the possible exception of unruly or disruptive fans (Thirer & Rampey, 1979), there is a positive correlation: the greater the fan participation, the greater the performance (Courneya and Carron, 1992; Carron, Loughead, & Bray, 2005; Armatas and Pollard, 2013; Goumas, 2014).4
In an effort to test a causal mechanism regarding why home crowds affected the outcome of games, research began to examine the impact of crowds on two different groups: 1) players and 2) officials. While it is incredibly difficult to measure the true impact of crowd noise on players’ performance, the majority of studies suggest that crowds probably have little impact on the individual performance of players. Studies that examine repeatable actions such as free throws in basketball, shoot-outs in ice hockey, and field goals (from comparable distances) and extra-point kicks in football show remarkably little variation from athletes at home versus on the road (Moskowitz & Wertheim, 2011).
Some studies suggest that playing at home may lead to higher levels of testosterone and cortisol versus playing on the road (Neave & Wolfson, 2003; Carré, Muir, Belanger, and Putnam, 2006), yet the actual impact of these chemical changes on physical aggression and athletic performance has not been fully supported by scientific research (Jones, Bray, & Olivier, 2005). Moreover, these studies were primarily conducted on amateur ice hockey players, not professional athletes. Given the (literally) toxic and taboo nature of performance enhancing drugs in professional sports, it is unlikely that such research could be conducted on professional athletes.
While the impact of crowds on player performance is inconclusive at best, what about the ability of crowds to systematically bias officials? Again, the logic here is that officials may conform to the pressure of the home crowd by giving them favorable calls, or that they could use the initial reaction of the crowd as a heuristic short cut to rapidly make a difficult call under tight time constraints. One would expect that the larger the crowd, the greater the impact on officiating, particularly in cases of close or judgment calls such as penalties or fouls in a variety of sports, balls and strikes in baseball, and stoppage time in soccer. Indeed, evidence exists to support the hypothesis that a noisy crowd does impact the judgment of officials in a manner that benefits the home team (Downward and Jones, 2007).5 A similar series of studies tested this hypothesis by comparing soccer games under normal crowd conditions with those played under no-noise conditions where officials watched games with headphones or without sound. The results showed that on judgment calls such as extra time or penalties, officials were much more likely to 1) reward the home team with extra time and 2) punish the visiting team with penalties in the presence of crowd noise than in no-noise conditions (Boyko, Boyko, and Boyko, 2007; Nevill, Balmer, and Williams, 2002; Unkelbach and Memmert, 2010).
The most scientific way to explore crowd effects is to compare officials’ calls with a home crowd present to known cases where one was not present. This unusual situation actually occurred in the Italian Soccer League in 2006–2007 because of inadequate safety precautions in stadiums, as well as in various 2020 professional soccer leagues because of COVID-19. In the games played without crowds, a home-field advantage was still observed, but it was both substantively and statistically less than games in the control group played in front of fans (Pettersson-Lidbom and Priks, 2010; van de Ven, 2011; and Baldwin, 2020).6
While professional soccer has accounted for the plurality of studies on crowd effects, Major League Baseball (MLB) is an ideal candidate for this research because it has a large number of judgment calls in the form of balls and strikes which have a clear impact on the outcome of games. The most notable study to explore crowd effects on officiating in MLB appears in Jon Wertheim and Toby Moskowitz’s popular book, Scorecasting. In a study analyzing over 1.5 million ball-strike determinations in 2002–08, the authors determined that the social pressure of the crowd systematically favored home teams. This finding was particularly pronounced in “high leverage” situations such as full counts, where the batter could either walk or strike out based on the call of the home plate umpire. According to the researchers, high leverage ball-strike determinations accounted for 516 more strike outs called against away teams and 195 more walks for home teams, enough to account for a “sizable fraction of the home team’s success in MLB” (Moskowitz and Wertheim, 2011; Chen, Moskowitz, & Shue, 2016).
While this research was extremely rigorous, it could not test the impact of playing without a crowd. Indeed, until the 2020 MLB season, there was only one regular season game ever played without fans, hardly a sufficient sample size to draw any meaningful conclusions. With the 2020 season complete, however, there are now 898 games that can be analyzed to subject the crowd effects hypothesis to new scrutiny.7 The unique features of 2020 games can also be used to explore some competing hypotheses regarding homefield advantage.
In addition to the impact of crowds on home team advantage, researchers have also found that road team fatigue from travel (Recht, Lew, and Schwartz, 1995; Goumas, 2013), as well as the ability of home teams to bat last (Simon and Simonoff, 2006) and pitch first (Smith, 2015), can also produce positive advantages for home clubs. Furthermore, teams constructing their rosters to exploit the unique dimensions of their home stadiums appears to have little or no effect on homefield advantage (Moskowitz and Wertheim, 2011).
DATA AND METHODS
Due to the COVID-19 pandemic, the 2020 MLB campaign was delayed nearly four months and consisted of only 60 regular season games (instead of the usual 162) per team. Games were played in teams’ home stadiums, though fans were not permitted to attend. Instead, some organizations chose to place cardboard cutouts in some seats, particularly those most visible on television. While teams also experimented with artificial crowd noise, the typical cheers and boos that accompany home runs, errors, and controversial ball-strike calls were nowhere to be found.
Furthermore, the league altered team travel in an attempt to minimize the risk of contracting COVID-19. Teams played only against 1) other clubs in their division or 2) teams in the corresponding division in the opposite league (i.e. NL East teams played against other NL East teams and AL East teams only). For the first time, the Designated Hitter (DH) rule was applied to NL teams, meaning pitchers would no longer be required to bat. Games played as part of doubleheaders were shortened to seven innings, while a runner was automatically placed on second base at the start of all extra innings. The Toronto Blue Jays — denied permission to play in their home stadium by the Canadian government — were forced to play the entire season in a minor league park in Buffalo, New York. And on nearly two dozen occasions, feared or actual COVID-19 outbreaks caused home teams to play games in the away team’s stadium.
While the 2020 season was less than ideal for all involved, the altered landscape offers convenient treatment and control groups. Some aforementioned explanations for home-field effects (e.g. batting last, stadium familiarity, the comforts of home) were unchanged in 2020. If these features are indeed major drivers of home-field effects, then we would not expect home teams to perform worse in 2020 relative to previous years. But if screaming fans are responsible for teams playing better at home — due to effects on either players or umpires — then any normal effects should be absent in 2020. Similarly, if travel fatigue typically hurts away teams, then the restricted travel schedule in 2020 would be expected to lessen — at least slightly — these effects.
Our first goal is identifying whether home-field advantage changed during the 2020 season. Data were obtained through Baseball-Reference.com, which includes dates, outcomes, and attendance figures for each contest. One-way ANOVA and Chi Square tests determine whether home-field advantage dropped in 2020 relative to each of the three previous seasons. We measure home-field advantage in two ways: 1) the mean run differential enjoyed by home teams during the respective years (HTRunDiff) and 2) the share of games won by the home team (HTWin). One could argue that if crowd effects matter, they should help determine winners and losers. This is particularly true if crowds matter most in high-leverage situations, as Moskowitz & Wertheim (2011) suggest. However, we include the run differential measure because it is also possible that empty stadiums impact team performance, but not in ways that cause significant changes in win rates.
Second, we conduct a series of OLS and Probit regression tests to better gauge the role of empty stadiums and other potential factors on home-field advantage. Our unit of analysis is each MLB game (N=8,188) played 2017–2020. We again run models with two different dependent variables — a continuous measure noting the home team’s run differential in a respective game and a binary measure of home team victory.
Our primary independent variable is a binary variable noting whether a game was played without a crowd (NoCrowd). Because only 2020 contests were played without fans in the four years examined, this measure is effectively a binary measure for 2020 games. As we discussed, research has suggested that the mere existence of a crowd may not fully capture fans’ effect on outcomes. Crowd size or density may also matter (Armatas and Pollard, 2013; Goumas, 2014). We therefore include specifications that consider both total attendance (CrowdSize) and the share of the park filled in each game (CrowdDensity).8
In a typical season, a team with 10,000 fans may not enjoy the same home-field advantage as one with 50,000. If this is true, then it would follow that a drop from 10,000 to 0 in 2020 would not be the same as a drop from 50,000 to 0. Notably, our attendance variables capture tickets sold rather than the number of fans actually attending games (which teams do not announce). Nevertheless, these metrics should capture variation in attending crowds reasonably well.
Because research has also offered travel fatigue as an explanation for home-field advantage (Recht, Lew, and Schwartz, 1995; and Goumas, 2013), we include two variables designed to capture situations when the home team may be affected by travel factors. The first is a binary measure indicating whether the away team is an out-of-division opponent (NonDiv). In most cases, these opponents are required to travel further than division opponents. Even if they are traveling from a different city (as part of a longer road trip), this indicates that they have been on the road for an extended period of time, perhaps exacerbating fatigue effects. Because 2020 did not include out-of-division matchups (but previous years did), this variable should help isolate any effects of that year’s unusual travel schedule. If this measure is significant and positive, we can gain confidence that home teams typically benefit from playing teams who have traveled further, likely due to increased fatigue.
The second travel variable is a binary measure indicating whether the home team played a game on the road the previous day (RecentTravel). While away teams nearly always must travel, home teams generally do not. However, there are instances when home teams must return from an away series in another city before beginning a new series in their own park. In these situations, we should expect that travel fatigue would not be considerably different for the home team than the road team.
Not only were games played without a crowd in 2020, but there were 24 games in which the home team was forced to play in the visiting stadium. Most, though not all, of these instances were due to COVID-19 related game postponements. Furthermore, the Toronto Blue Jays were forced to play each of their home games at Sahlen Field, the team’s Triple-A park in Buffalo, New York. If the comforts of home and/or park familiarity are valid explanations for home-field advantage, we would expect those effects to be absent in each of these cases. As a result, we include binary variables noting 1) home games played in visiting parks (HomeTeamRoad) and 2) games played at neutral sites (NeutralPark). The latter variable also captures three Houston Astros home games played in a neutral setting (in Tampa Bay) during Hurricane Harvey in 2017.
MLB rules arguably confer an advantage to home teams. First, as Simon and Simonoff (2006) have reported, batting last is an asset to home teams. In addition, interleague contests between American League (AL) and National League (NL) teams adopt the Designated Hitter (DH) rule, or lack thereof, of the home club. AL teams have played with the DH since 1973, though NL teams instead allowed pitchers to hit until 2020. Before 2020, we would expect both AL and NL teams to have an added advantage in home interleague games because their rosters were constructed in a way that matched the applicable DH rules.
In 2020 — just one month before the season began — the National League adopted the DH for the first time. Because this was too late to modify rosters in a meaningful way, AL home teams appeared to still benefit from DH rules in 2020 interleague contests, while NL home teams did not. We therefore include a binary measure for interleague games during 2017–20 in which the home team should be advantaged — AL-hosted contests in 2017–20 and NL hosted contests in 2017–19 (InterleagueAdv).
Finally, one of the most obvious predictors of a home team’s success in a given game is the quality of its roster. While teams of all talent levels tend to perform better at home than on the road, better teams should have more success at home than poorer teams. Similar to Goumas (2014), we therefore control for each home team’s division ranking at the time a game was played. All MLB teams belong to divisions consisting of five teams. To capture team quality, we include binary variables noting whether a team was in first, second, fourth, or fifth place before a particular contest (FirstPlace, SecondPlace, FourthPlace, FifthPlace).9
While we run specifications with additional variables (as discussed) to ensure robustness, our primary regression model can be expressed as:
y (HTRunDiff.) = a + β (NoCrowd) + β (InterleagueAdv) + β (FirstPlace) + β(SecondPlace) + β (FourthPlace) + β (Fifth-Place) + β (RecentTravel) + β (NonDiv) + β(NeutralPark) + β (HomeTeamRoad) + e
FINDINGS
Figures 1 and 2 feature simple bar graphs demonstrating home-field advantage in MLB 2017–20. The graphics clearly suggest that the advantage did not decline in 2020, both in terms of the mean run differential or win percentage enjoyed by the home team, respectively. In fact, home teams appeared to perform slightly better in 2020. While run differential and win percentage generally mirror one another, 2019 was a bit unusual in that home teams actually scored fewer runs per game despite winning nearly 53% of their contests.
In fact, while all but six MLB teams had better records at home than on the road in 2019, just 16 had better run differentials at home. It appears that many MLB clubs won home games by smaller margins than they tended to lose them that season, suggesting that their run scoring was unusually efficient.
Figure 1. Mean MLB Home Team Run Differential (per game), 2017–20

Figure 2. MLB Home Team Win Percentage, 2017–20
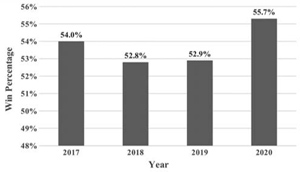
Table 1 presents a One-way ANOVA test that examines whether the mean run differential recorded by home teams significantly differed in any of the four years examined. Because the p value is 0.490, we can confidently assert that no significant differences are present. The dip observed in 2019 does not represent a statistically significant deviation from the other years we examined. More importantly for our purposes, 2020 did not feature a statistically meaningful drop or rise in home team run differential.
Table 1. Mean MLB Home Team Run Differential, 2017–20 (One-way ANOVA)

Table 2 presents a Chi-Square test that compares the means of home team win percentage across the four years. With a p value of 0.356, we continue to report no significant differences between home team performance during the 2017–20 seasons. These findings are striking, as they indicate that the absence of fans in 2020 did not alter the strength of home performance in any discernible way.
Table 2. MLB Home Team Win Average, 2017-2020 (Chi-Square Analysis)

Through more sophisticated regression models, we are able to assess the role of empty ballparks while accounting for other potential predictors of home-field advantage. Table 3 presents our findings using the home team’s run differential as the dependent variable.
Table 3. Predicting MLB Home Team Run Advantage, 2017–20 (OLS Regression)

In the first specification, with only the binary measure of empty stadiums included, we confirm the insignificant findings reported in the One-way ANOVA test. Homefield advantage was unaffected by the absence of fans in 2020. In the second test, with all covariates now included, we continue to report no relationship between the primary independent variable and home team run differential. In the third and fourth tests, we substitute our binary measure of crowd-free games for continuous variables capturing total stadium attendance and the share of the stadium that was full, respectively. While these values are always zero for 2020 contests, they vary considerably for 2017–19 contests. Neither variable registers a significant effect on home team performance, meaning that the existence, size, or density of crowds did not appear to aid home teams over the course of 8,188 games played during 2017–20.
Our full model produces other notable findings. Predictably, team quality is highly significant of a home team’s performance (p<.01). First and second place teams are significantly more likely to enjoy large run differentials at home than lesser-ranked teams. Conversely, fourth and fifth place teams have lower run margins than higher-ranked clubs. The substantive effects are notable. In the second specification, a first place team is expected to have a run differential that is 1.4 runs greater per game than non-first place teams. Meanwhile, fifth (last) place teams are associated with a run differential 0.79 runs smaller than teams ranked higher in their respective divisions.
More surprisingly, we report a negative relationship between games where the home team is advantaged in interleague contests (due to the Designated Hitter rules) and home team run differential. This finding, which is significant with 95% confidence (p<.05), suggests that home teams in interleague games where a DH advantage exists (n=979) are associated with run differentials 0.38 runs smaller than home teams in other settings. While this finding is a bit counterintuitive, it is possible that adjusting to new Designated Hitter rules is less burdensome for teams than we anticipated. Nevertheless, because interleague contests comprise a fairly small share of games in our data set, we encourage more scrutiny in this area.
Notably, we report no significant effects regarding travel in any tests. Home teams hosting non-division opponents see no increased run differential, as we anticipated might be the case. Furthermore, those home teams playing immediately after returning from a road game the day before were not disadvantaged. As a result, we cannot confirm the results of others (Recht, Lew, and Schwartz, 1995; Goumas, 2013) regarding the effect of travel fatigue on home-field advantage.
Interestingly, teams playing “home” games in road stadiums or at neutral sites (e.g. the Toronto Blue Jays) were no less likely to record positive run differentials. We do caution, however, that the sample size of these cases is small. There were only 24 contests requiring home teams to play at a road park in 2020. Regarding neutral sites, cases are limited to all Toronto Blue Jays home games played in Buffalo in 2020 (n=26) and three Houston Astros games played in Tampa Bay in 2017 due to Hurricane Harvey.
Table 4 replicates the previous tests, but substitutes a binary measure of home team victory as the dependent variable.
Table 4. Predicting MLB Home Team Win Likelihood, 2017–20 (Probit Regression)
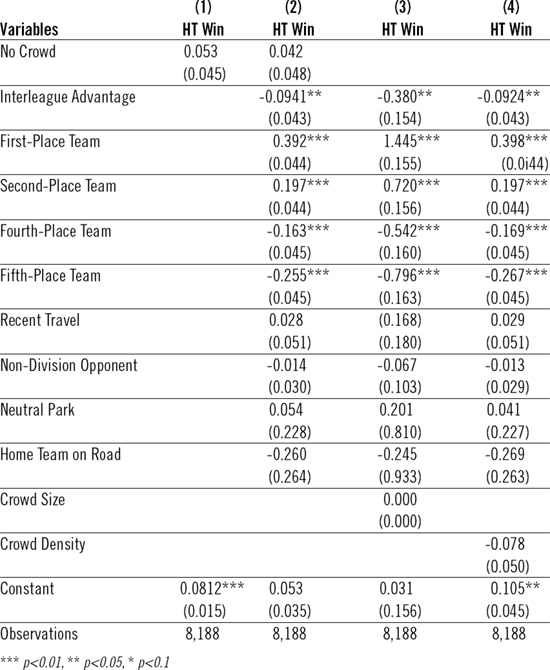
Because of the dichotomous nature of the dependent variable, a Probit regression test is appropriate for each of these tests. Once again, we report no significant effect of a crowd, its size, or its percentage filled on a home team’s success in a given game. Home teams were more likely to win in each of the four years we examined (see Figure 2), but crowds did not increase their likelihood of doing so in a statistically significant way.
We again report significant associations between team quality and home team success. First-place clubs are 39 percentage points more likely to win home games than other clubs, while fifth-place teams are 25 percentage points less likely to win home games than higher-ranked teams. We also continue to find that home teams advantaged in interleague games performed a bit worse than they did in other contests. Mirroring our findings in Table 3, we report no relationship between travel conditions or teams playing away from their home parks and a home team’s likelihood of victory.
CONCLUSIONS AND DIRECTIONS FOR FUTURE RESEARCH
Examining 8,188 MLB games over four years, we find no significant effect of crowds on home team performance. The presence of fans does not predict higher run differentials or likelihood of victory for host clubs. Even in 2020, when crowds were entirely absent from MLB parks, home-field advantage remained strong. Our findings are similar to those reported by Van de Ven (2011), who reported that home-field advantage persisted when crowds were removed in Italian soccer contests. Try as they might, fans may have limited ability to impact their teams’ success by influencing the abilities of players on the field or the impartiality of umpires. Homer Hankeys, Bleacher Bums, Tomahawk Chops, Rally Monkeys, and mascots may increase the baseball fan experience, but our findings shed doubt on their ability to change outcomes.
Our findings suggest, though admittedly do not prove, that home-field advantage may be caused by other factors. These include rule advantages that allow the home team to bat last (as reported by Simon and Simonoff) and to pitch first (as reported by Smith), the familiarity players have with the unique features of their home parks, or the comforts associated with being at home (e.g. having family nearby, sleeping in one’s own bed, etc.). While we report that home teams performed no better or worse when hosting opponents traveling from further distances or returning from a road trip, the simple idea of “being home” may be more powerful than once believed.
While our study may deflate the egos of fans, it does provide a reassuring perspective about the quality of MLB play. Players and umpires are trained professionals who are extremely skilled at their jobs. They have only reached the highest level of their profession because they are able to excel under adverse conditions and they have thousands of hours of practice doing so. The fact that fans can expect such consistent quality of competition should give hometown rooters something to cheer about, even if those cheers do not matter.
Because our findings contradict the conventional wisdom and some previous research, we expect and encourage reinterpretation and revision of our work. For example, with additional time and access to data, it would be possible to replicate the aforementioned PITCHf/x studies conducted by Moskowitz and Wertheim (2011) and Chen, Moskowitz, and Shue (2016) for the 2020 MLB season. This would help provide additional evidence to support or reject their conclusions regarding the importance of social pressure on high-leverage ball-strike calls. Similarly, it would be interesting to investigate the decibel-levels and intensity of artificially produced crowd noises used by some MLB teams in 2020 in their home stadiums. This, however, would require access to proprietary information from the teams that will probably not be forthcoming.
Finally, it is possible that 2020 was simply unique and that games played under similar conditions in later years would not produce the same results. One could argue, for example, that the burdens associated with travel in 2020 were unusually great, perhaps creating additional challenges for road teams. Given that MLB teams travel on private planes and bus charters, we are a bit skeptical of this explanation. It remains possible, however, that other features of the COVID-19-modified season — stress, family concerns, the late start of competitive games — affected players in ways that are unlikely to recur in future years.
J. FURMAN DANIEL III is an Associate Professor in the College of Security and Intelligence at Embry-Riddle Aeronautical University. He is the editor of 21st Century Patton: Leadership Lessons for the Modern Era, a co-author of The First Space War: How Patterns of History and Principles of STEM Will Shape Its Form, and author of Patton: Battling with History. He lives in Prescott, Arizona.
ELLIOTT FULLMER is an Associate Professor of American Politics at Randolph-Macon College. He is the author of Tuesday’s Gone: America’s Early Voting Revolution, as well as numerous scholarly articles on U.S. elections and voting behavior. He is an avid Philadelphia Phillies fan, and is proud to have watched MLB games at 36 different ballparks. He lives in Richmond, Virginia.
Sources
Armatas, V., & Pollard, R. (2013). Home advantage in Greek football. European Journal of Sport Science, 14, 116–22.
Baldwin, B. (2020). Inside the numbers: How empty stands affect home-field advantage? The Athletic, posted online Aug 25.
Balmer, N.J., Nevill, A.M., and Williams, A.M. (2003). Modelling home advantage in the Summer Olympic Games. Journal of Sports Sciences, 21, 469–78.
Barry, D. (1995). Dave Barry’s Complete Guide to Guys, New York: Random House.
Boyko, R., Boyko, A., and Boyko, M. (2007). Referee bias contributes to home advantage in English Premiership football. Journal of Sports Sciences, 25, 1185–94.
Carré, J., Muir, C., Belanger, J., and Putnam, S. K. (2006). Pre-competition hormonal and psychological levels of elite hockey players: Relationship to the “home advantage.” Physiology and Behavior, 89, 392–98.
Carron, A. V., Loughead, T. M., and Bray, S. R. (2005). The home advantage in sport competitions: Courneya and Carron’s (1992) conceptual framework a decade later. Journal of Sports Sciences, 23, 395–407.
Chen, D., Moskowitz, T., and Shue, K. (2016). Decision making under the gambler’s fallacy: Evidence from asylum judges, loan officers, and baseball umpires. The Quarterly Journal of Economics, 131, 1181–242.
Courneya, K. S., and Carron, A. V. (1992). The home advantage in sport competitions: A literature review. Journal of Sport and Exercise Psychology, 14, 13–27.
Downward, P., and Jones, M. (2007). Effects of crowd size on referee decisions: Analysis of the FA Cup. Journal of Sports Sciences, 25, 1541–45.
Goumas C. (2013). Home advantage and crowd size in soccer: A worldwide study. Journal of Sport Behavior, 36, 387–99.
Goumas, C. (2014). How does crowd support contribute to home advantage in soccer? Journal of Sport Behavior, 37, 236–50.
Keri, J. (2011). The Extra 2%: How wall street strategies took a major league baseball teams from worst to first. New York: Ballantine Books.
Jones, M. V., Bray, S. R., and Olivier, S. (2005). Game location and aggression in rugby league. Journal of Sports Sciences, 23, 387–93.
Judge, J. (2020). Strike Zones in the Age of COVID-19. Baseball Prospectus, posted online, September 21.
Lewis, M. (2003). Moneyball: the art of winning an unfair game. New York: W.W. Norton.
Moore, J. (2015). “The Washington Nationals try to psych out their opponents with bad music.” GQ, posted online, April 15.
Moskowitz, T., & Wertheim, L.J. (2011). Scorecasting: the hidden influences behind how sports are played and games are won. New York: Crown Publishing Group.
Neave, N., & Wolfson, S. (2003). Testosterone, territoriality, and the “home advantage.” Physiology and Behavior, 78, 269–75.
Nevill, A., Balmer, N.J., and Williams, M. (2002). The influence of crowd noise and experience on refereeing decisions in football. Psychology of Sport and Exercise, 3, 261–72.
Pettersson-Lidbom, P., and Priks, M. (2010). Behavior under social pressure: Empty Italian stadiums and referee bias. Economics Letters, 108, 212–14.
Ranking all 30 MLB Ballparks. (2019). NBC Sports Washington, posted online July 9.
Recht, L. D., Lew, R. A., and Schwartz, W. J. (1995). Baseball teams beaten by jet lag. Nature, 377, 583.
Sawchik, T. (2015). Big data baseball: math, miracles, and the end of a 20-year losing streak. New York: Flatiron Books.
Schwartz, B., and Barsky, S. F. (1977). The home advantage. Social Forces, 55, 641–61.
Shanks, B. (2005). Scout’s Honor: The Bravest Way to Build a Winning Team. New York: Sterling and Ross Publishers.
Simon, G., and Simonoff. J. (2006). “Last Licks:” Do they Really Help? The American Statistician, 60, 13–18.
Smith, D. W. (2015). Home Team Scoring Advantage in the First Inning Largely Due to Time. Presented at the annual convention of the Society for American Baseball Research, June 24–28, 2015.
Sports Reference LLC. Baseball-Reference.com – Major League Statistics and Information. https://www.baseball-reference.com. Sept. 15, 2020.
Thayer, E. L. (1888). Casey at the Bat. The Daily Examiner, June 3.
Thirer, J., and Rampey, N. (1979). Effects of abusive spectator behavior on the performance of home and visiting intercollegiate basketball teams. Perceptual and Motor Skills, 48, 1047–53.
Unkelbach, C., and Memmert, D. (2010). Crowd noise as a cue in referee decisions contributes to the home advantage. Journal of Sport & Exercise Psychology, 32, 483–98.
Van de Ven, N. (2011). Supporters are not necessary for the home advantage: Evidence from same-stadium derbies and games without an audience. Journal of Applied Social Psychology, 41, 2785–92.
Notes
1. Home-field advantage is highest in the NBA (60.5%), followed by the NFL (57.3%), the NHL (55.7%) and, finally, MLB (53.9%).
2. For a self-critical but illustrative example of how fans can believe that they have a direct impact on the outcome of games, see: Dave Barry’s Complete Guide to Guys (1995), 181–83.
3. For excellent narrative accounts of how baseball teams were particularly resistant to data analytics, see: Michael Lewis’s Moneyball (2003), Jonah Keri’s The Extra 2% (2011), and Travis Sawchik’s Big Data Baseball (2015). For a somewhat contrarian account of how one franchise, the Atlanta Braves, found success by matching traditional scouting approaches with analytical principles, see: Bill Shanks’ Scout’s Honor: The Bravest Way to Build a Winning Team (2005).
4. Some, such as Armatas and Pollard (2013), have found that crowd density (i.e. the share of a stadium that is full) is most important, while Goumas (2014) reports that total crowd size has the largest effect on home-field advantage.
5. In contrast, the effect of crowd noise appears to be less in sports without judgment calls, such as weightlifting and short-track speed skating (Balmer, Nevill, and Williams, 2003).
6. The one exception to this was the 2020 Bundesliga games, which showed no significant home-field advantage for games played without fans. For extensive data on the European Soccer Leagues, see: https://github.com/lbenz730/soccer_hfa.
7. One study (Judge, 2020), applying PitchInfo data from Baseball Prospectus, reported that the strike zone did not appear to advantage home teams more in the first two weeks of the 2020 MLB season when compared to the 2019 season.
8. MLB ballpark capacity data is provided by NBC Sports Washington (2019).
9. Our full data set is available upon email request.
10. Interestingly, in 2015, the Washington Nationals admitted to playing sad songs during visiting teams’ batting practices in order gain an advantage. See: Moore, J. (2015). “The Washington Nationals try to psych out their opponents with bad music.” GQ, posted online April 15.