

Who Belongs In The Baseball Hall of Fame?
This article was written by Richard Kendall
This article was published in 1989 Baseball Research Journal
My purpose in this study is to make an objective determination of players who belong in the Hall of Fame by comparing them to Hall of Famers at their position.
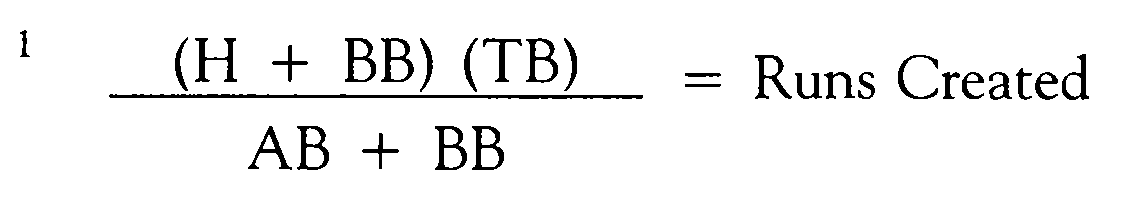
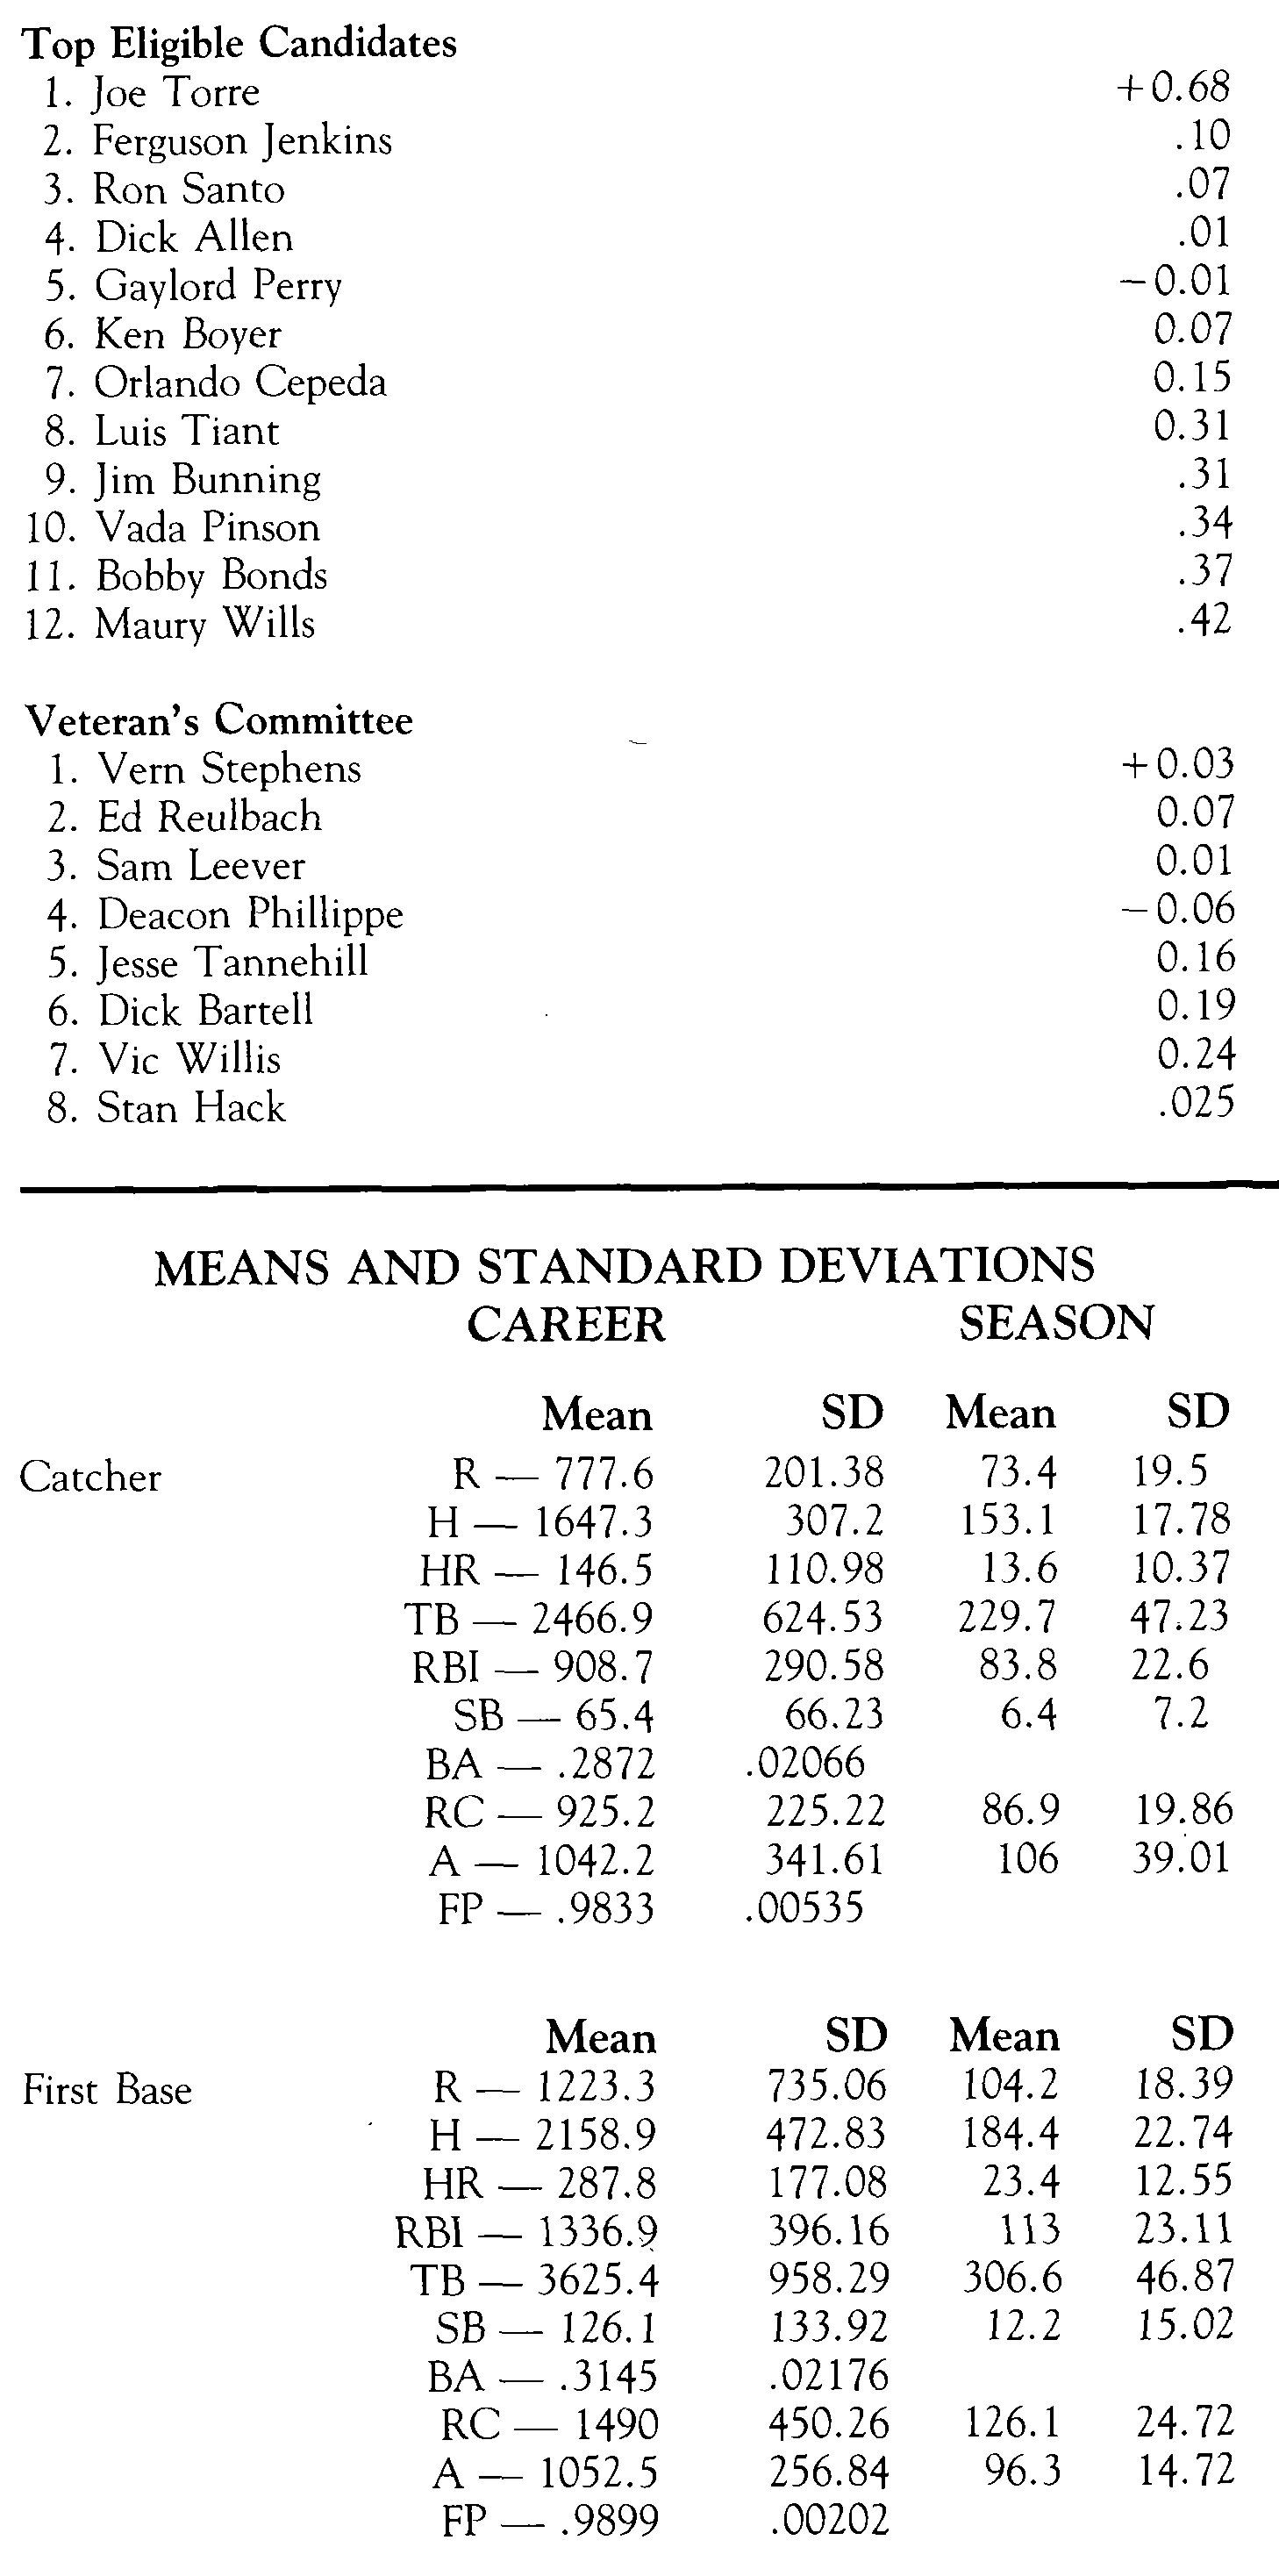
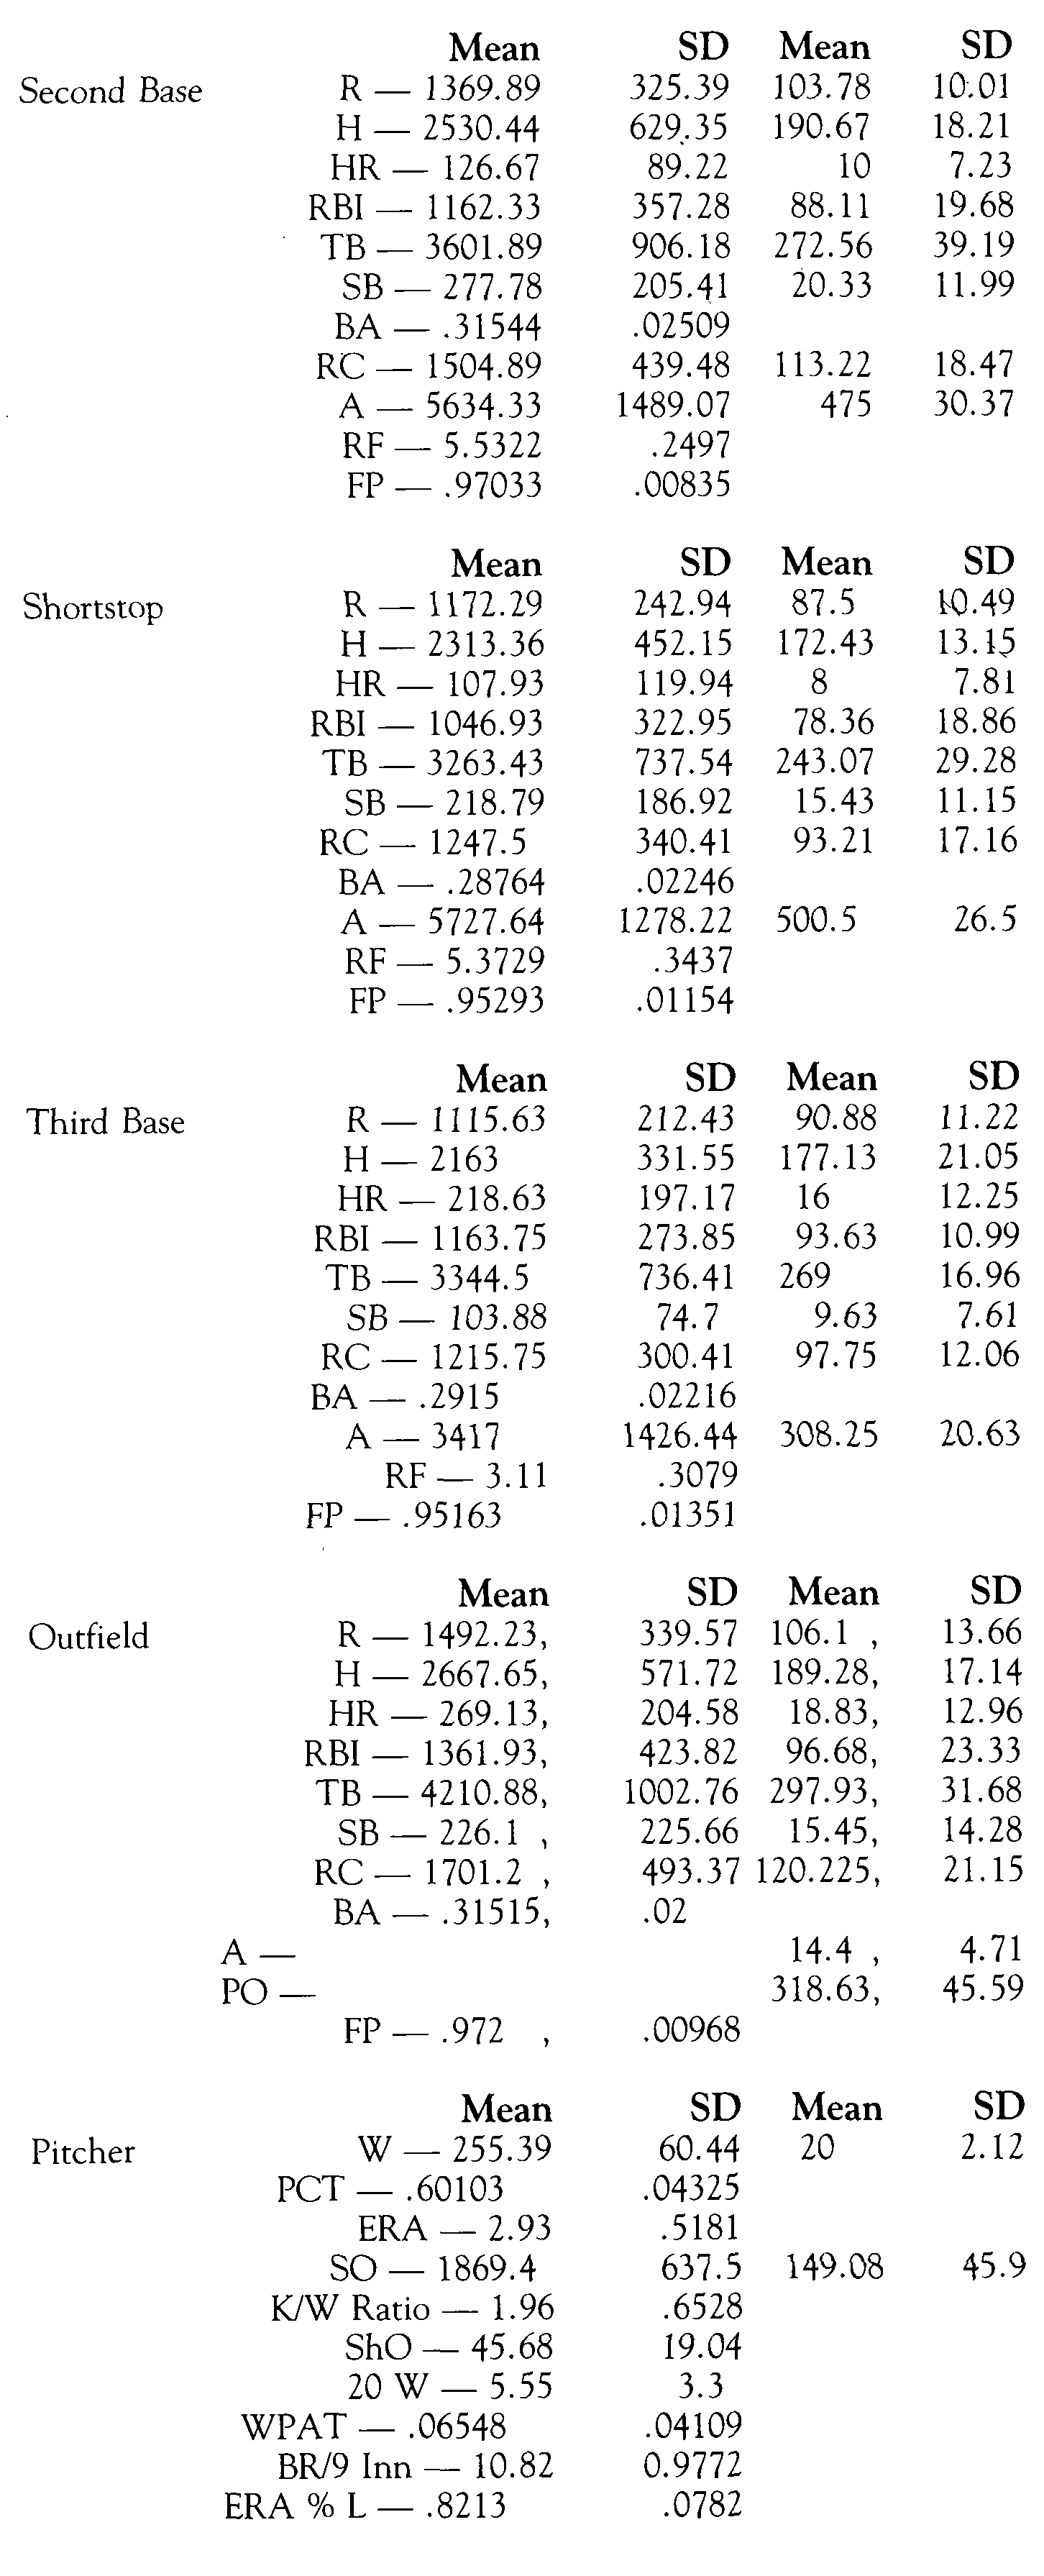
All Hall of Famers were classified by position and their career totals in eleven hitting and fielding categories (runs, hits, home runs, runs batted in, batting average, total bases, runs created1, stolen bases, assists, range factor,2 and fielding percentage) were listed. Then for the players at each position a mean and standard deviation for each of the eleven categories was computed.3 Each player was rated by how many SDs each of his career totals were from the mean of that category for that position.
An equivalent season4 for those eleven categories for each player was computed. Each player was ranked according to his mean and standard deviation for each seasonal stat; this was compared to the mean and SD for Hall of Famers at that position. This moderated some extremes found when rating players by career totals only. Players who had relatively short but brilliant careers ranked somewhat lower than would be expected because their career totals were not especially high. Joe DiMaggio, Roy Campanella, and Hank Greenberg are good examples. On the other hand, a player who compiled large totals because of a long career will rank higher than his equivalent seasons would suggest. Carl Yastrzemski and Pete Rose are good examples of these. Combining career stats and equivalent seasons gives a total of a player’s career and peak value.
The positive and negative career and seasonal SDs for each player were added and divided by 22, (the total number of SDs5 from the mean). This gives a rating of a player relative to the average Hall of Famer at his position. This was computed for players at that position who are not in the Hall. For example-Mike Schmidt’s career run total was 1.09 SDs above the mean for Hall-of-Fame third basemen, his seasonal run total was 1.17 SDs above the mean, but his BA was 1.06 SDs below the Hall-of-Fame third basemen’s mean, and so forth. Considering those SDs above the mean as positive numbers and those below the mean as negative, Schmidt’s total SDs were + 12.65. Divide that by 22 and his overall SD is + 0.58, the highest among third basemen past or present.
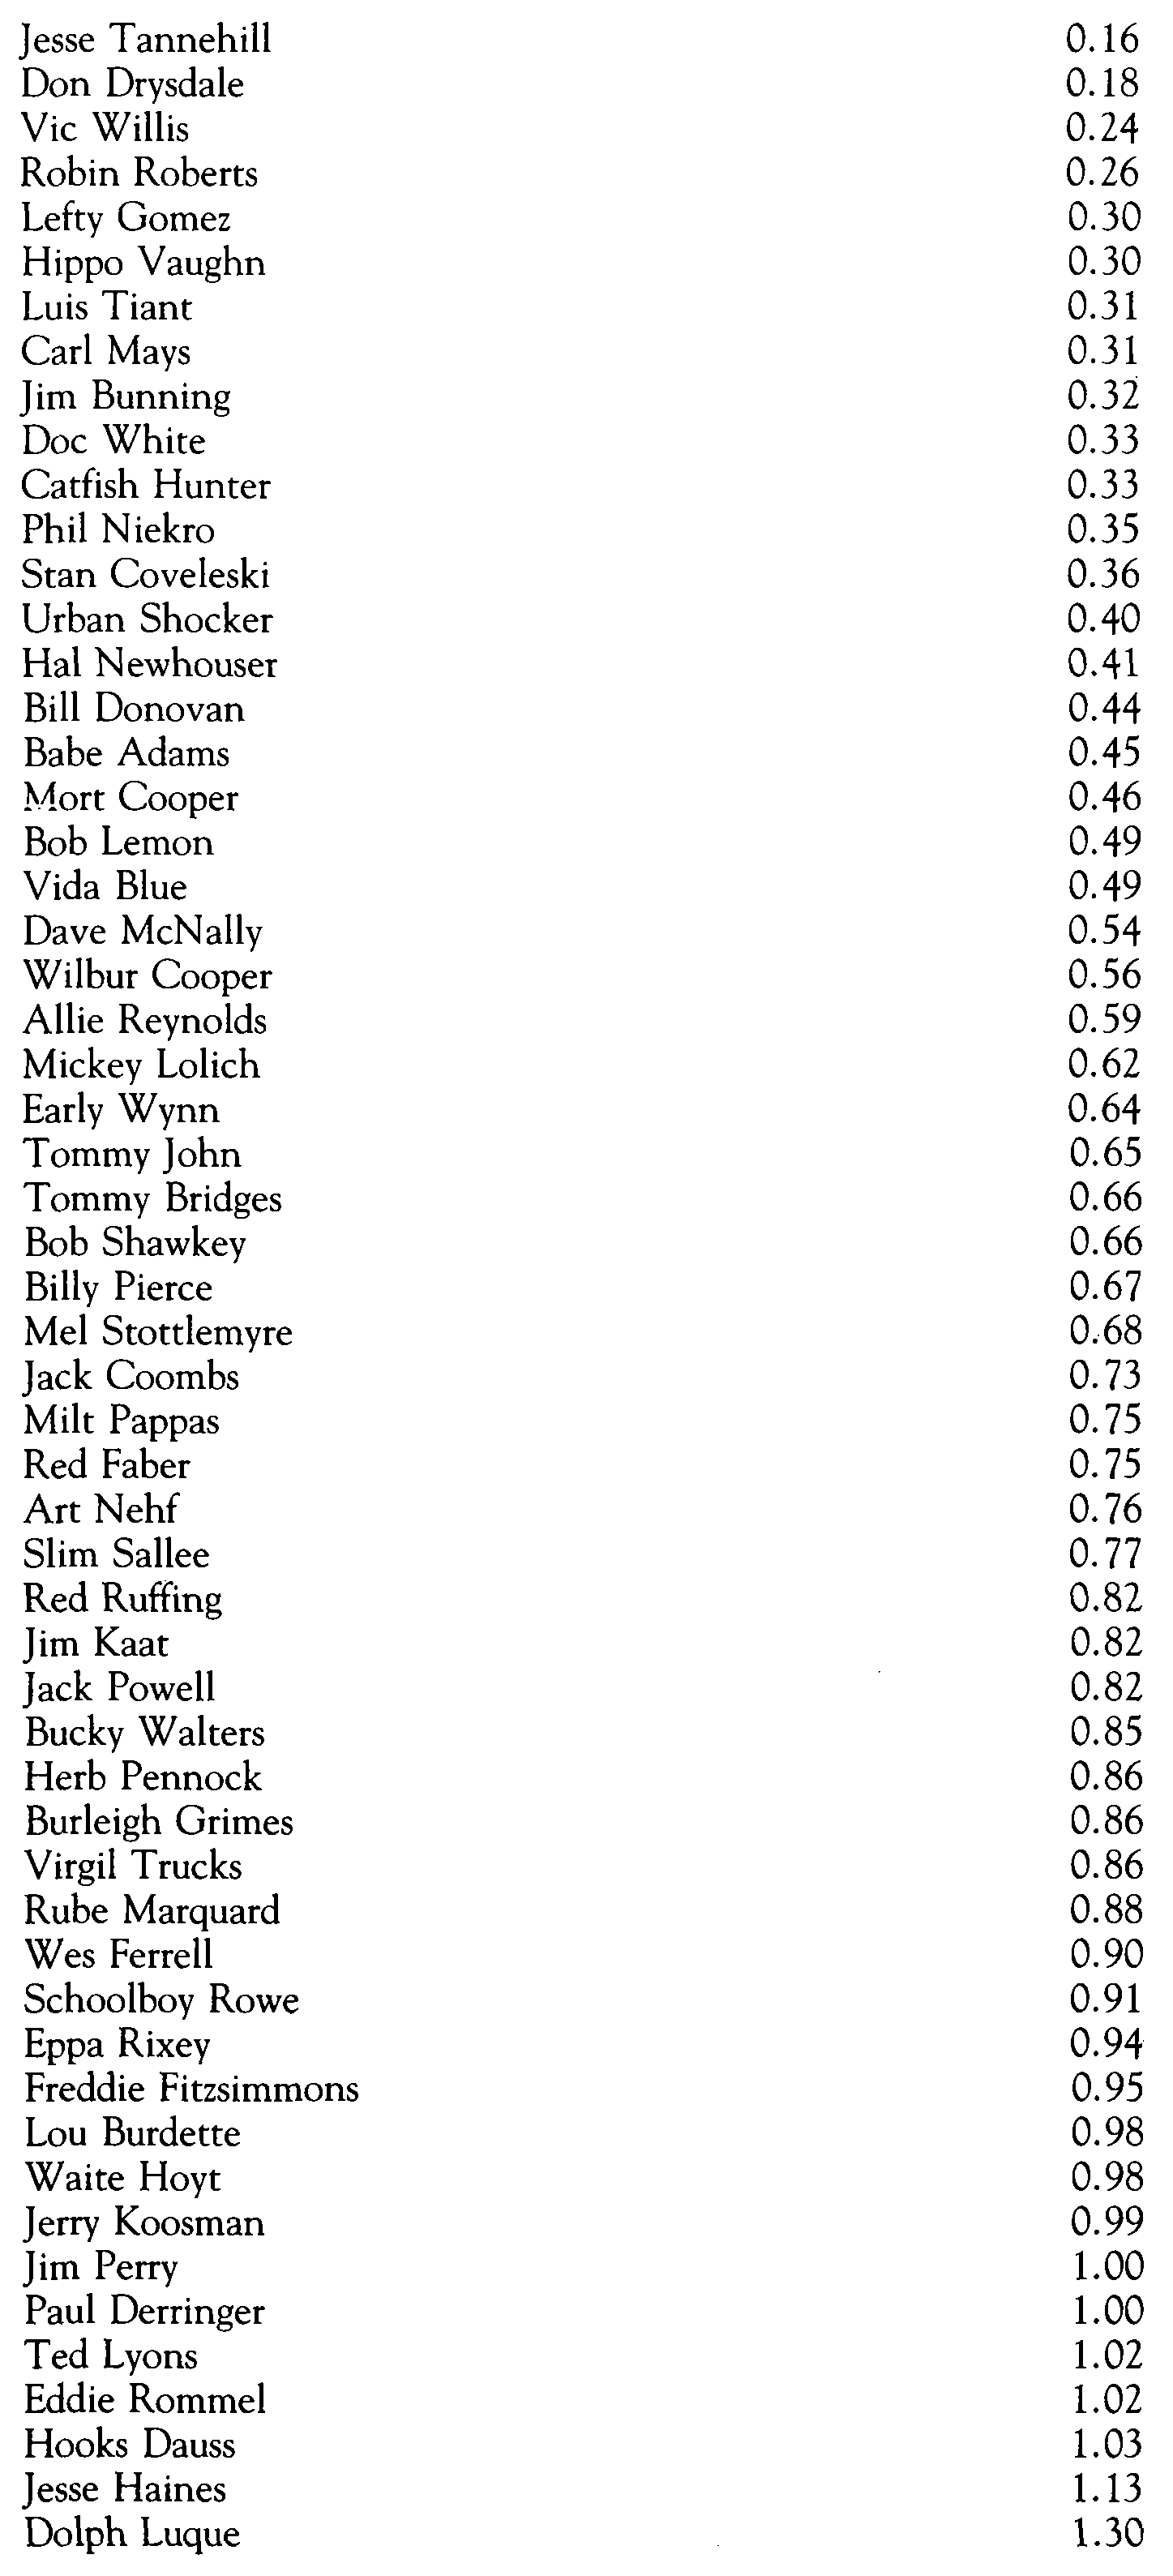
Pitchers were rated in regard to career and seasonal wins, winning percentage, earned run average, and strikeouts as well as strikeout-to-walk ratio, career shutouts, number of 20-win seasons, winning percentage compared to team’s winning percentage minus their own (some pitchers with modest winning percentages did so while toiling for teams with low winning percentages), and lastly, career ERA as a percentage of the league’s ERA (this adjusts the rather high ERAs of lively-ball eras and the extremely low ERAs of certain dead-ball eras).
Among Hall of Famers I did not consider players who spent the majority of their careers in the nineteenth century. Seasons were shorter, rules differed, and the statistics for these players skewed the means and SDs rather extremely. I also left out certain players who were elected to the Hall as managers.
2 Range Factor equals assists plus putouts divided by games at that position.
3 Mean is the average for the category. Standard Deviation is the average variance from the mean. The number of standard deviations above or below the mean is a measure of how far above or below the average player a player places in a category: If a player is one SD above (or below) the mean, he is better (or worse) than about two-thirds of all players in that category. If he is two SD above (or below) the mean, he is about 95 percent better (or worse) than all players in that category.
4 Equivalent seasons are determined by dividing the player’s career total of games by 162. You then divide this number of equivalent seasons into each of the player’s career stats to find out what his stats would be if he played a 162-game schedule. Runs Created, Range Factor, and Equivalent Seasons are courtesy of “Bill James Baseball Abstract,” the source of much of my statistical ideas and information.
5 I had only 20 SDs to divide by for catchers and first basemen, because I did not include a range factor for them since range is not especially important at those positions. For outfielders I also had only 20 SDs because I only had four fielding stats as compared to six for 2B, SS, and 3B (the most important fielding positions). Outfielders were rated on seasonal assists, seasonal putouts, season and career FP.
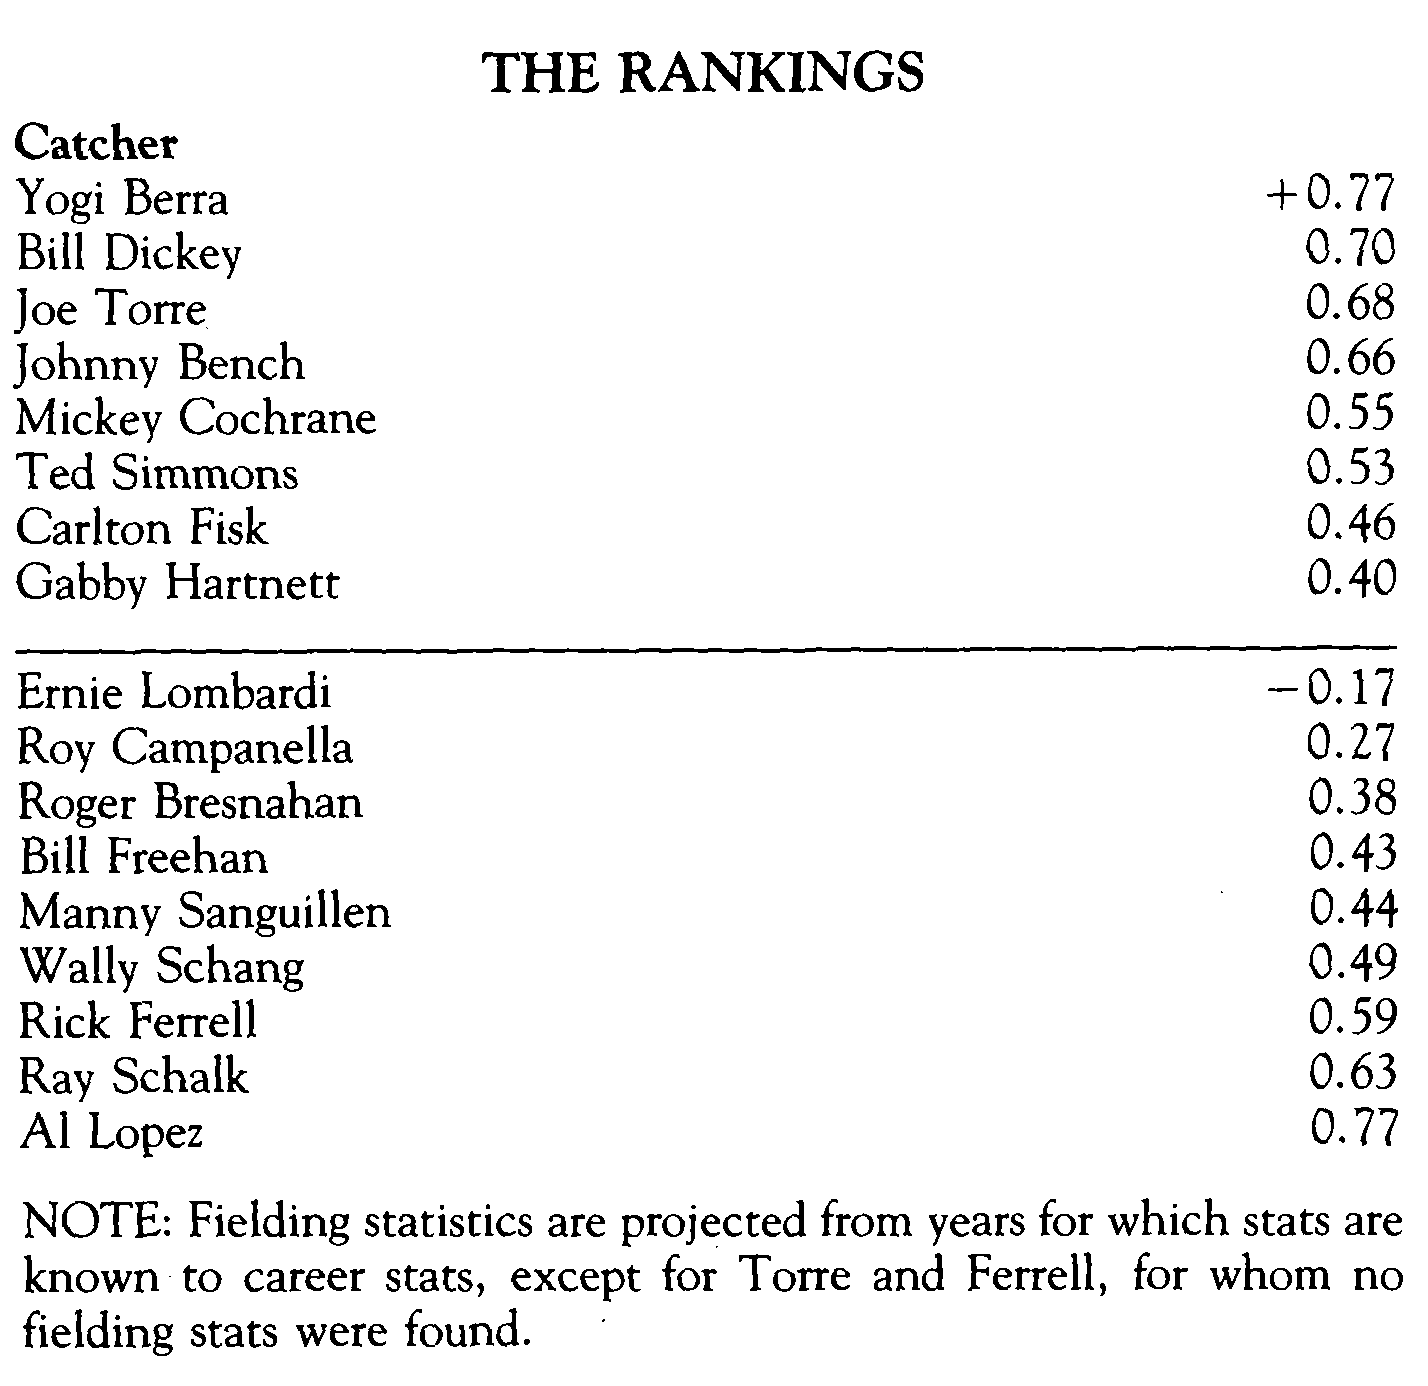
Joe Torre, Ted Simmons, and Canton Fisk ranked high among catchers. Torre and Simmons were heavy hitters, but neither was considered a strong catcher and each spent a lot of time playing other positions. How much this will reduce their support for the Hall of Fame remains to be seen. Fisk, on the other hand, has been a fine all around catcher, entirely deserving of election to the Hall.
On the negative side, was Al Lopez elected to the Hall as a manager or simply because he had caught more games than any other catcher? There don’t seem to be any flagrant omissions among eligible catchers.
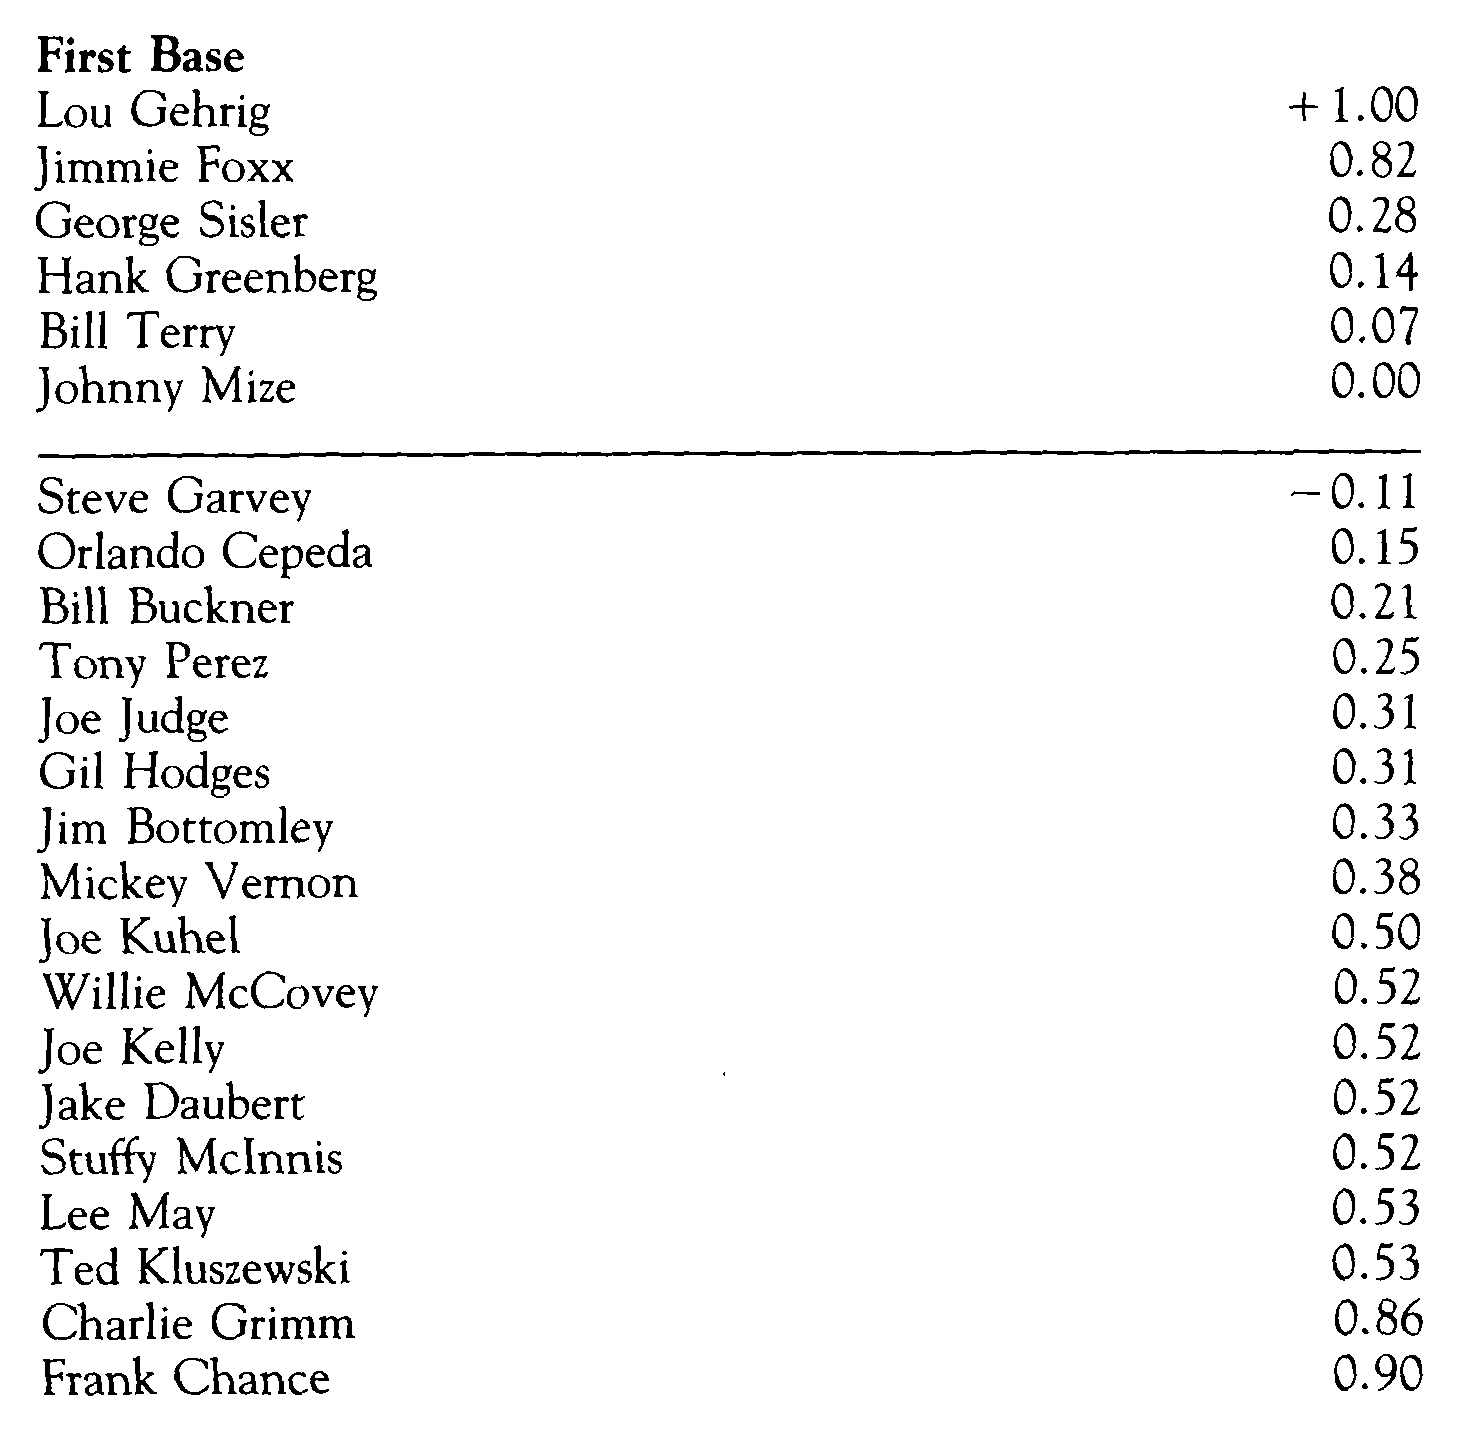
It took a long time for Johnny Mize to be elected. Why? It looks like Steve Garvey has had a Hall-of-Fame career. Will Orlando Cepeda’s baseball pluses outweigh his criminal minuses? Joe Judge and Gil Hodges did not rank very high but they out-ranked four Hall of Famers. Willie McCovey ranked surprisingly low. Frank Chance is the first of the Tinker to Evers to Chance infield to rank at the bottom of the rankings.
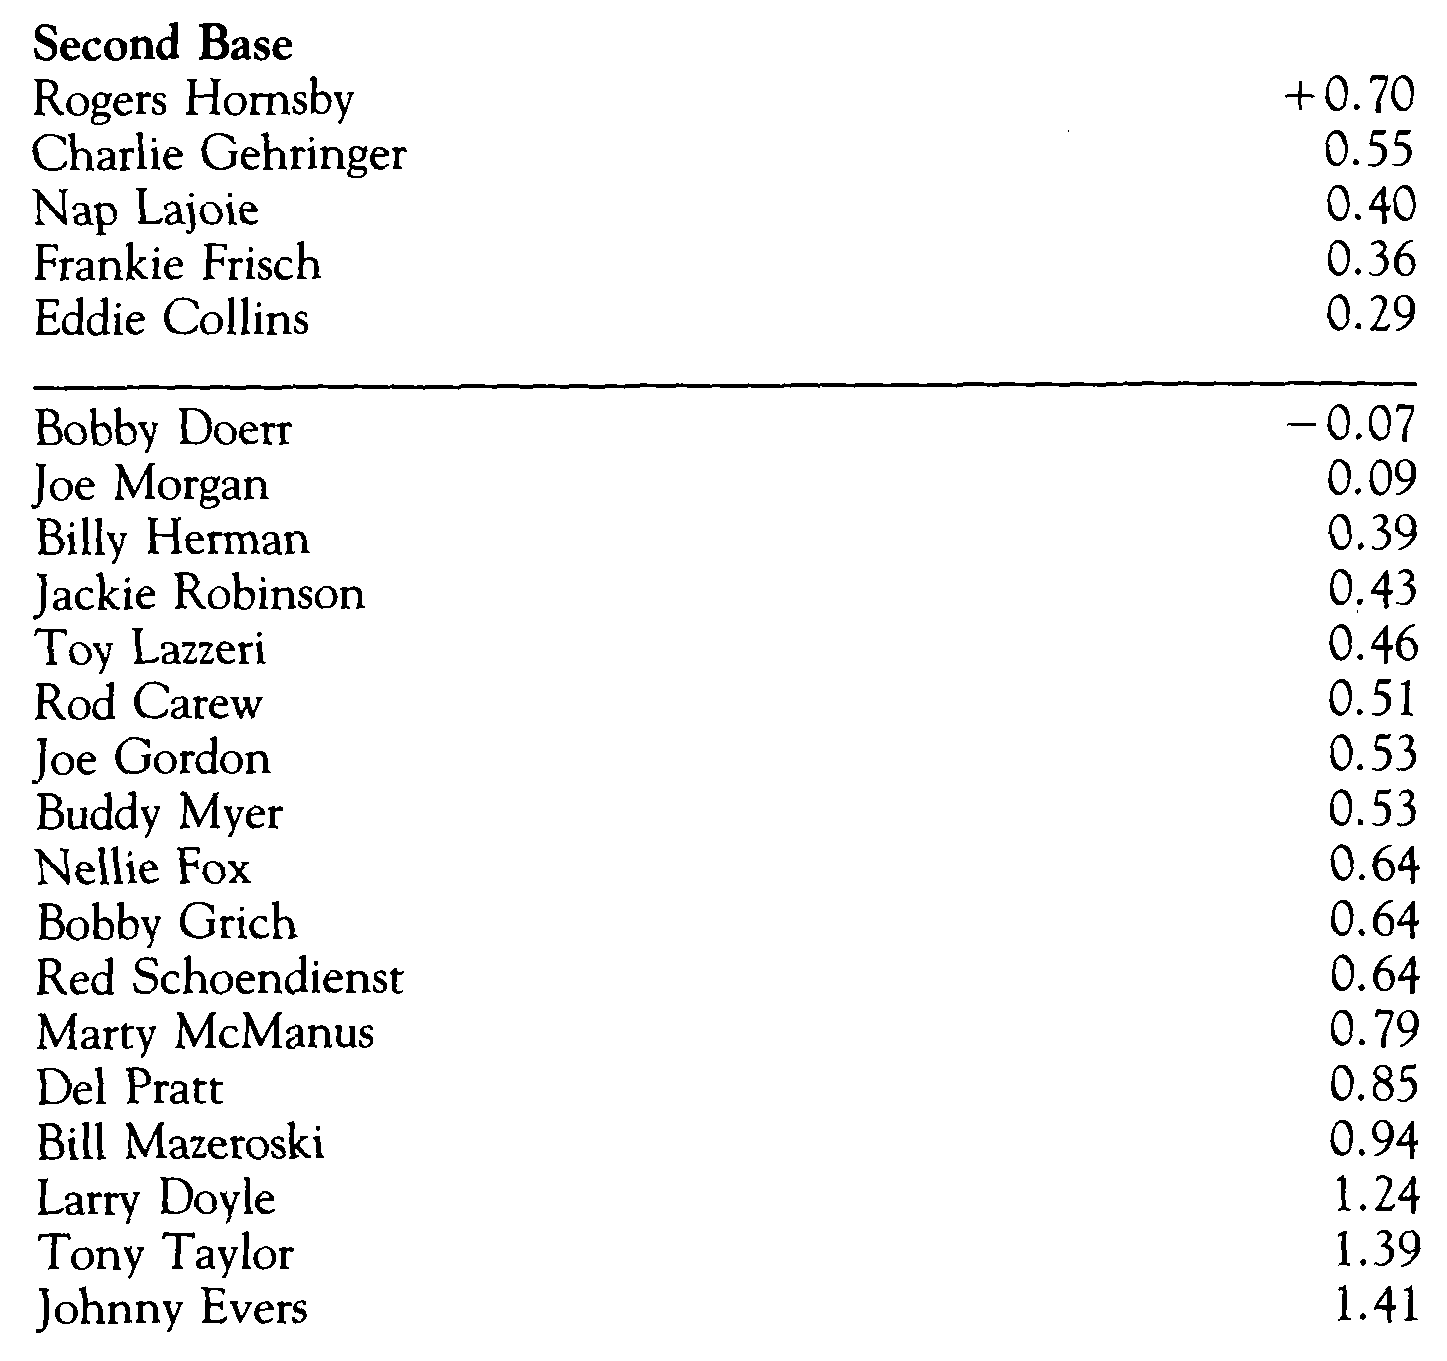
The difference in the ranking of Bobby Doerr and Joe Gordon is a surprise. Doerr has been underrated. Tony Lazzeri and Nellie Fox seem to be marginal Hall-of-Fame candidates at best and Bill Mazeroski seems to be completely out of consideration.
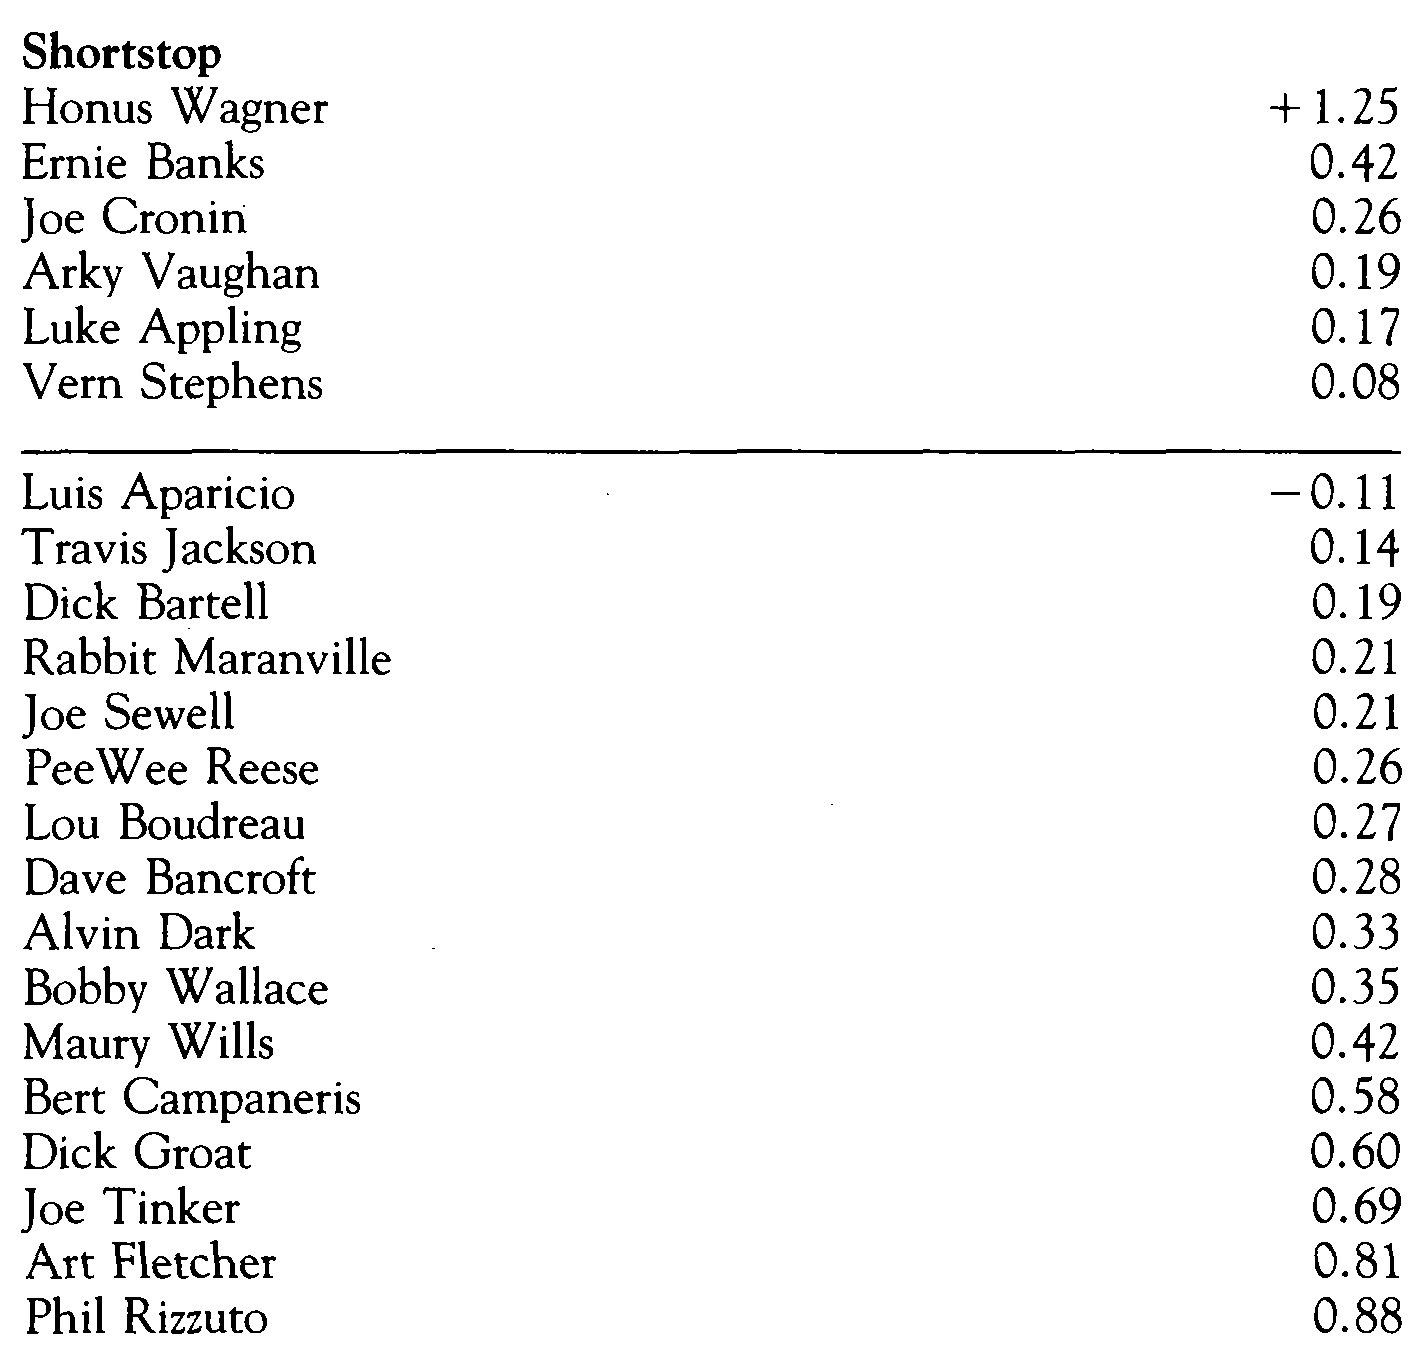
The biggest surprise here is Vern Stephens, never given much credit as a potential Hall of Famer. But there he is, at or above the mean for shortstops. Only five had a higher ranking.
Let’s give Rowdy Dick Bartell some credit for being a top shortstop. It was extremely hard to accept Phil Rizzuto’s low ranking. His career offensive stats were low but he would be expected to rise in the ranks when fielding stats and seasonal offense were included. But that was not the case. Subjectively he was one of the top shortstops of his era but the numbers don’t show that. Tinker, Evers, and Chance still make one ask, Why?
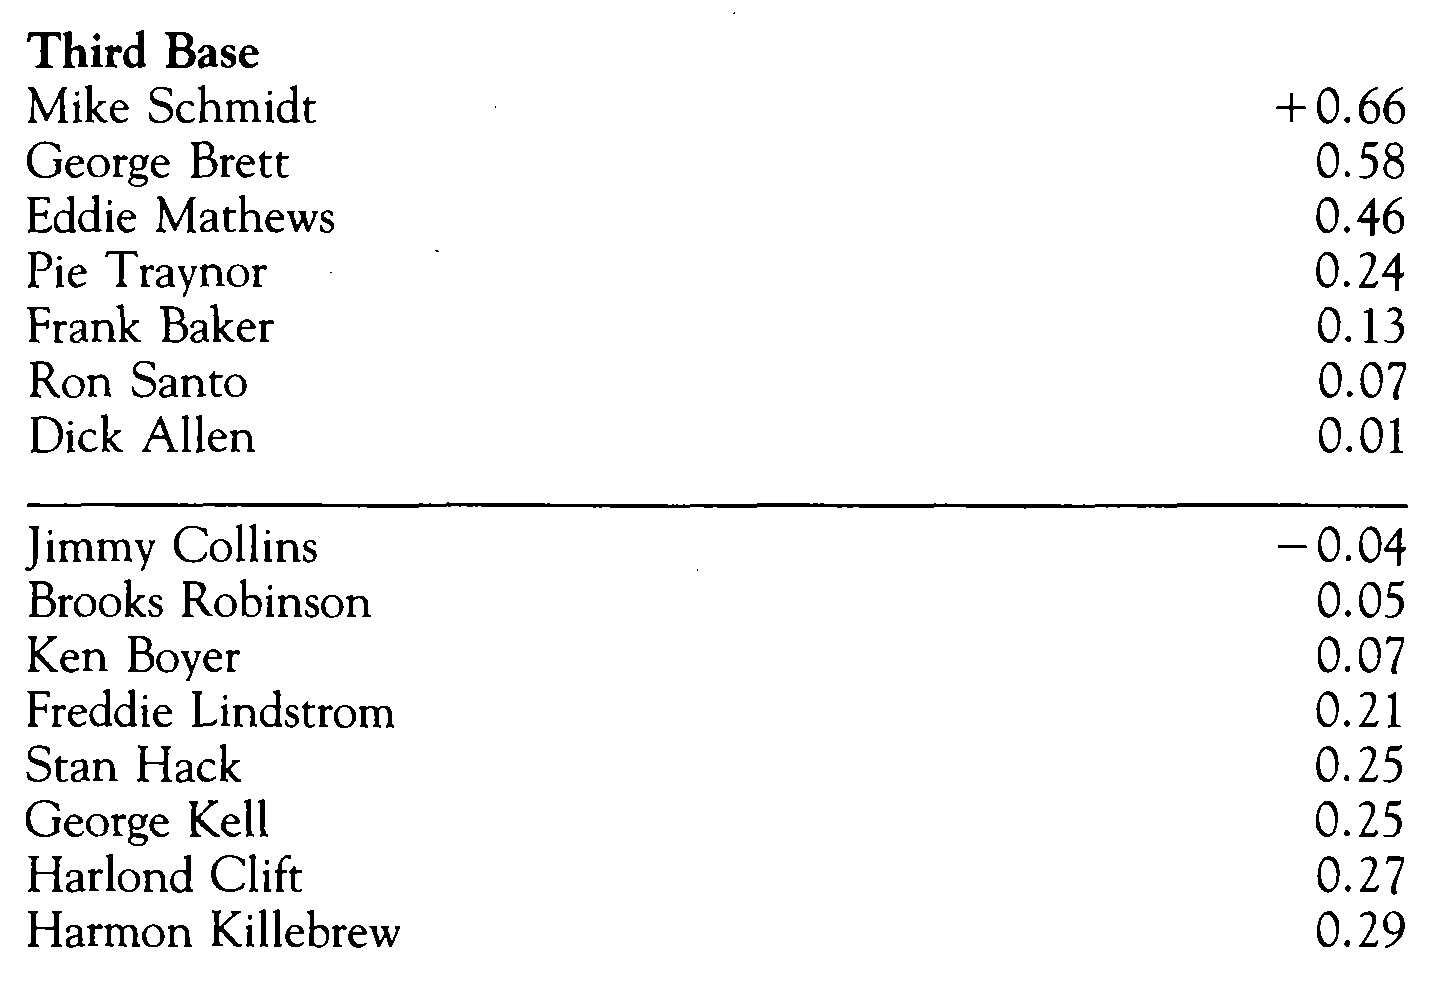
Wow! Mike Schmidt, Eddie Mathews, and George Brett ahead of the great Pie Traynor. Well, get used to the idea. Ron Santo has certainly been overlooked, as well as Dick Allen, Ken Boyer, Darkie Clift, Bob Elliot, and yes, Graig Nettles. Sure, Graig has a low batting average, but he was top-notch in power and fielding.
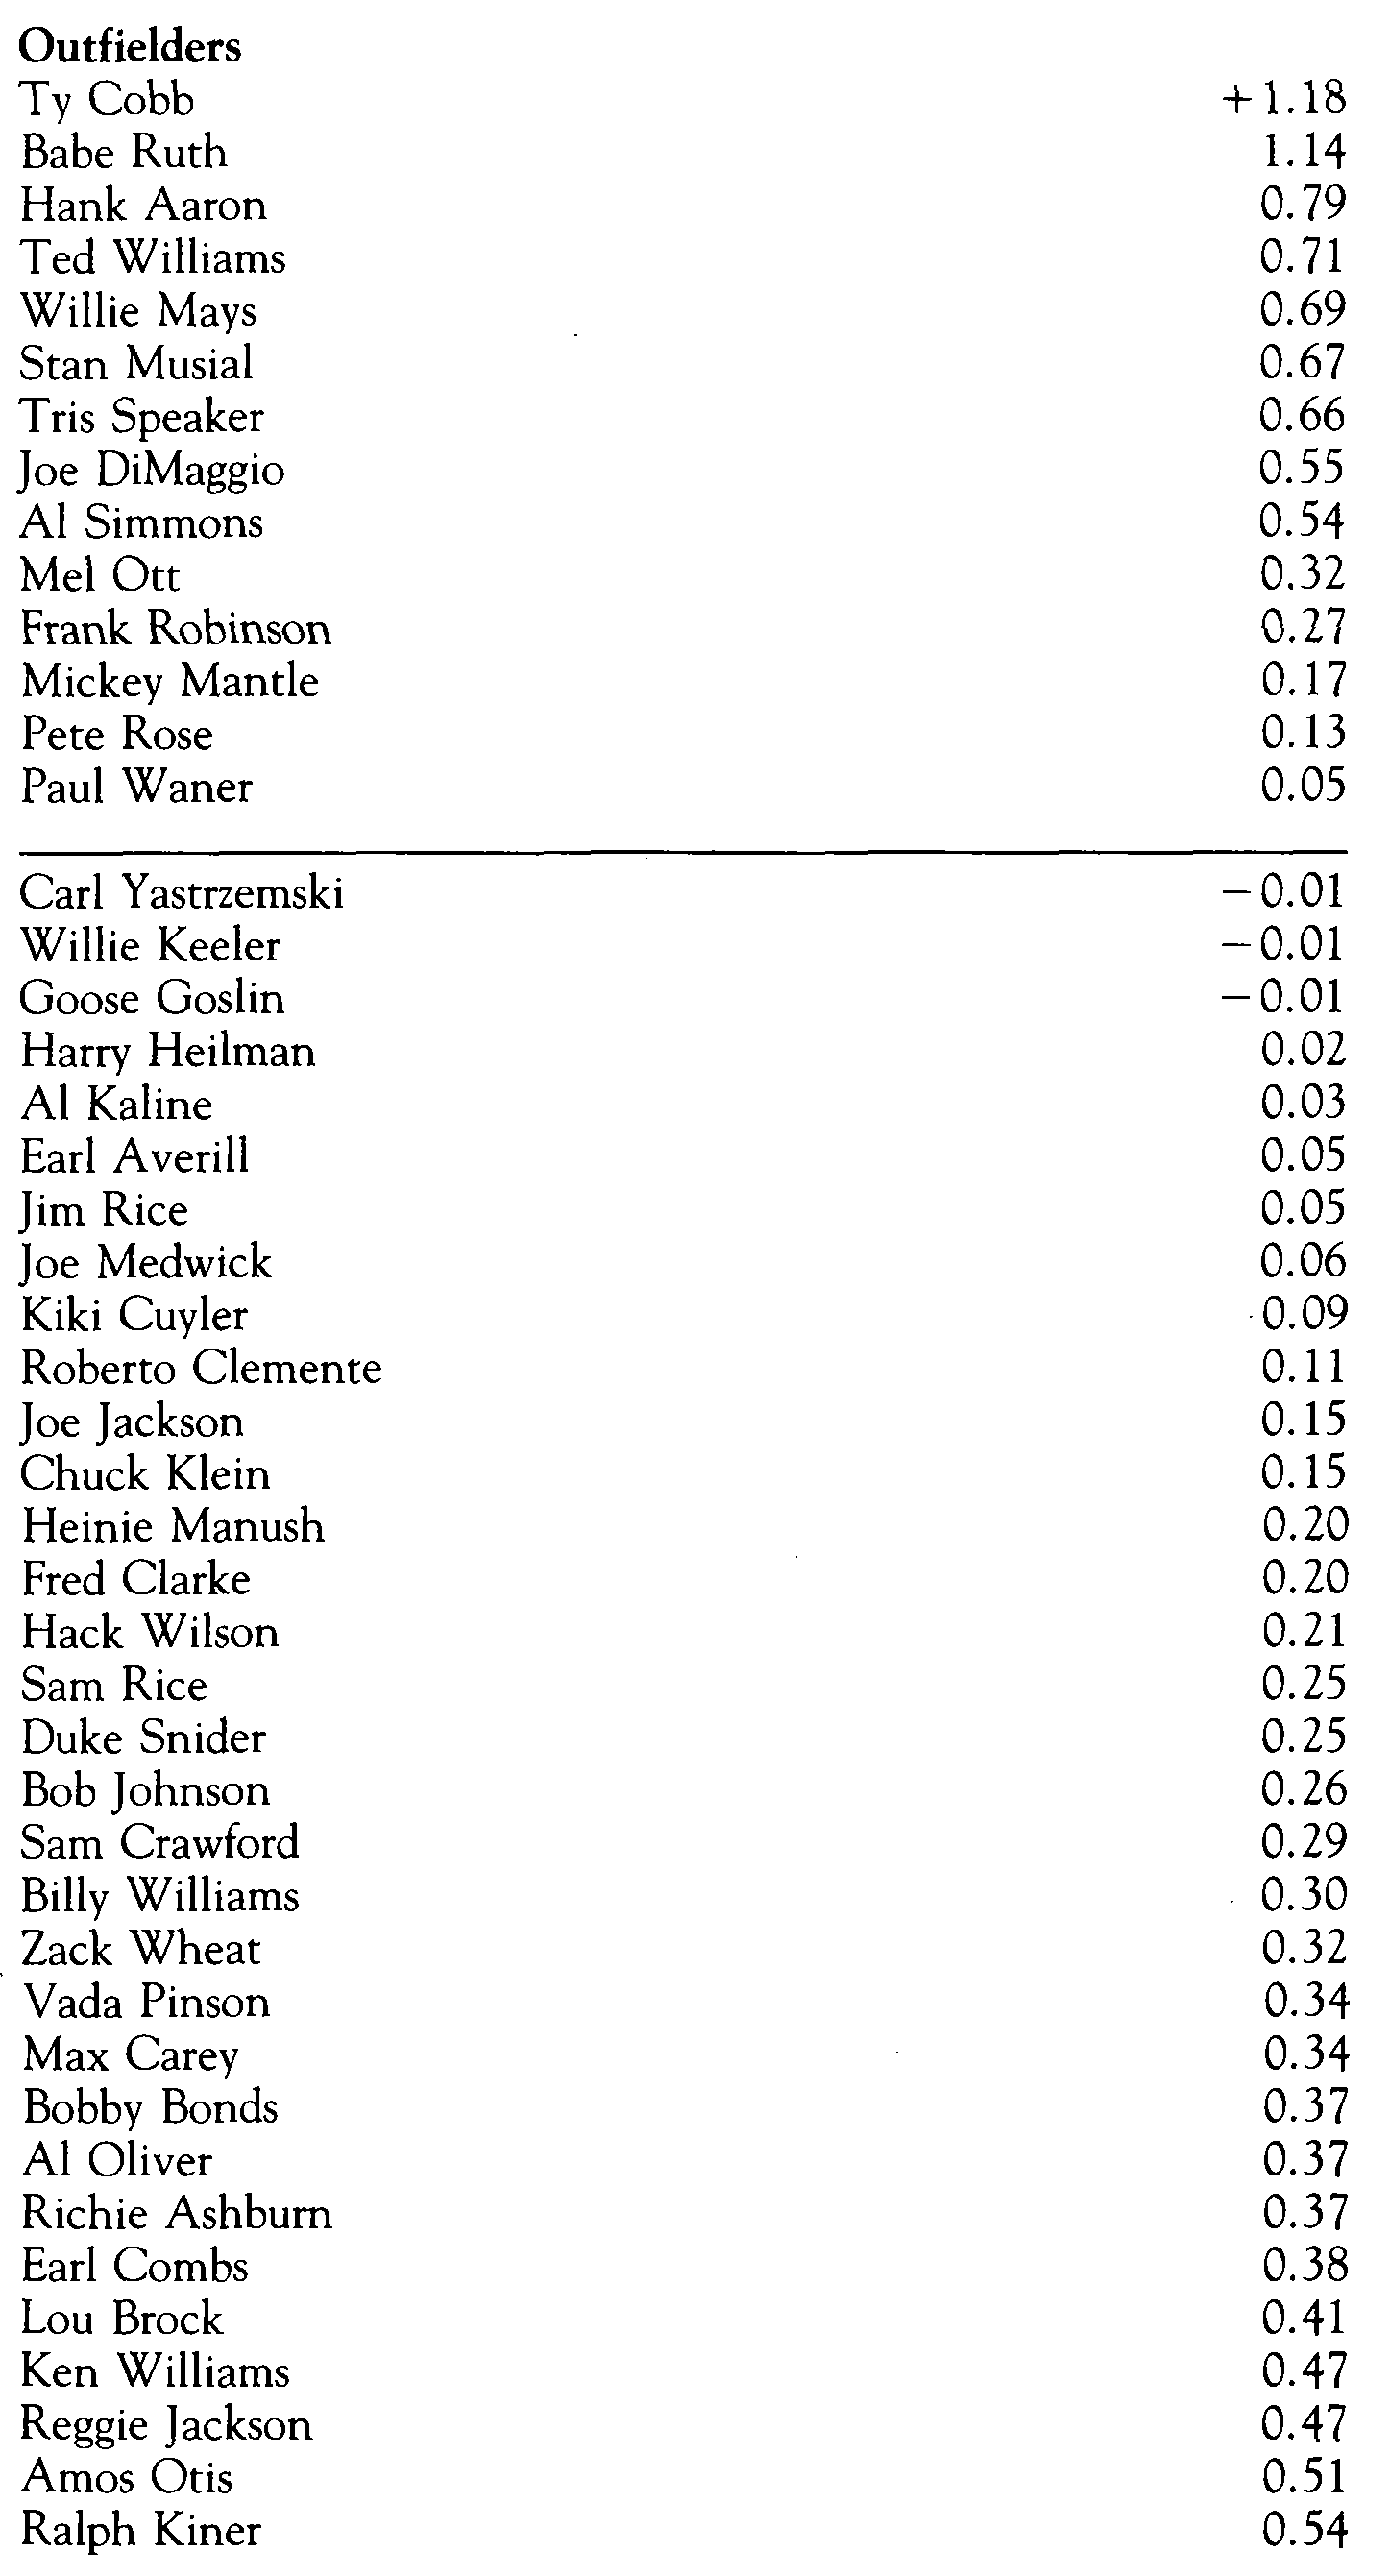
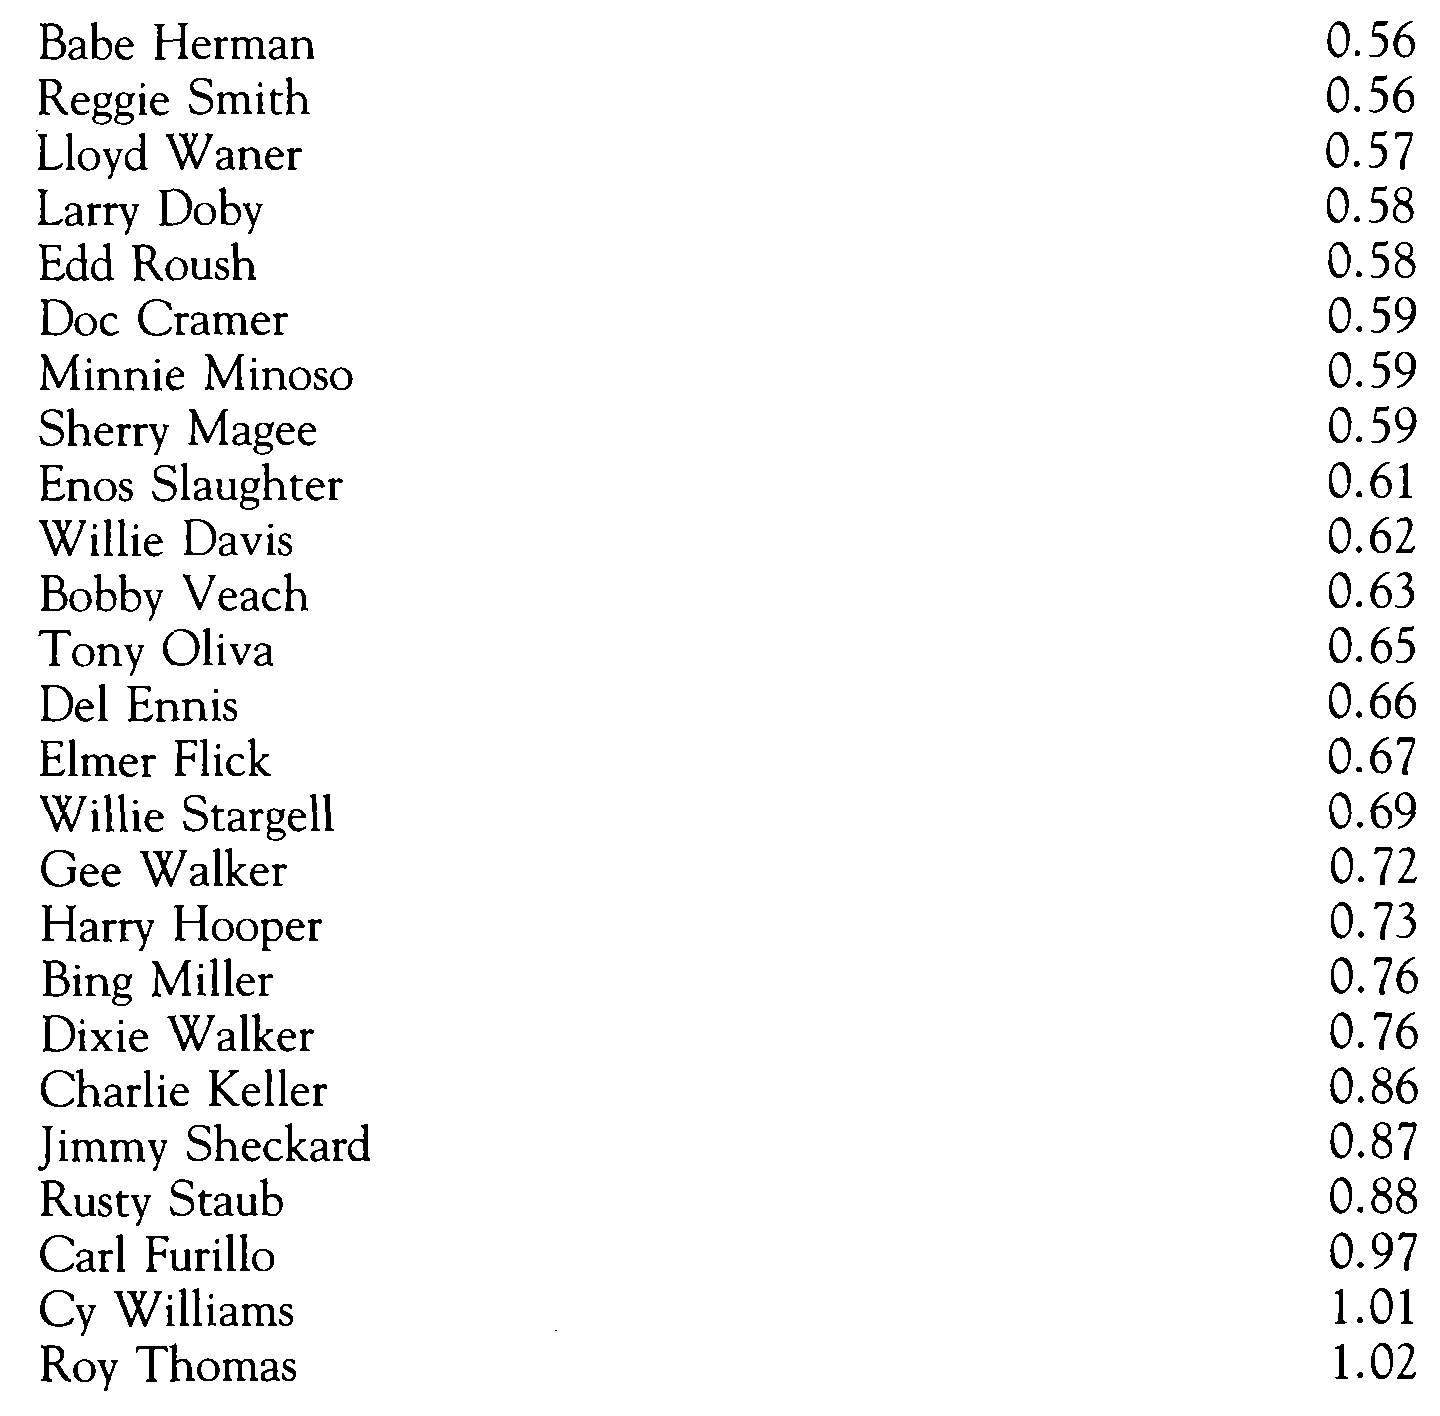
Well, the traditional favorites still come out on top:
Cobb, Ruth, Speaker, Aaron, Mays, Williams, Musial, and DiMaggio. What took them so long to elect Earl Averill? Jim Rice should be a shoo-in. Why not Indian Bob Johnson? How about my old favorite, Vada Pinson?
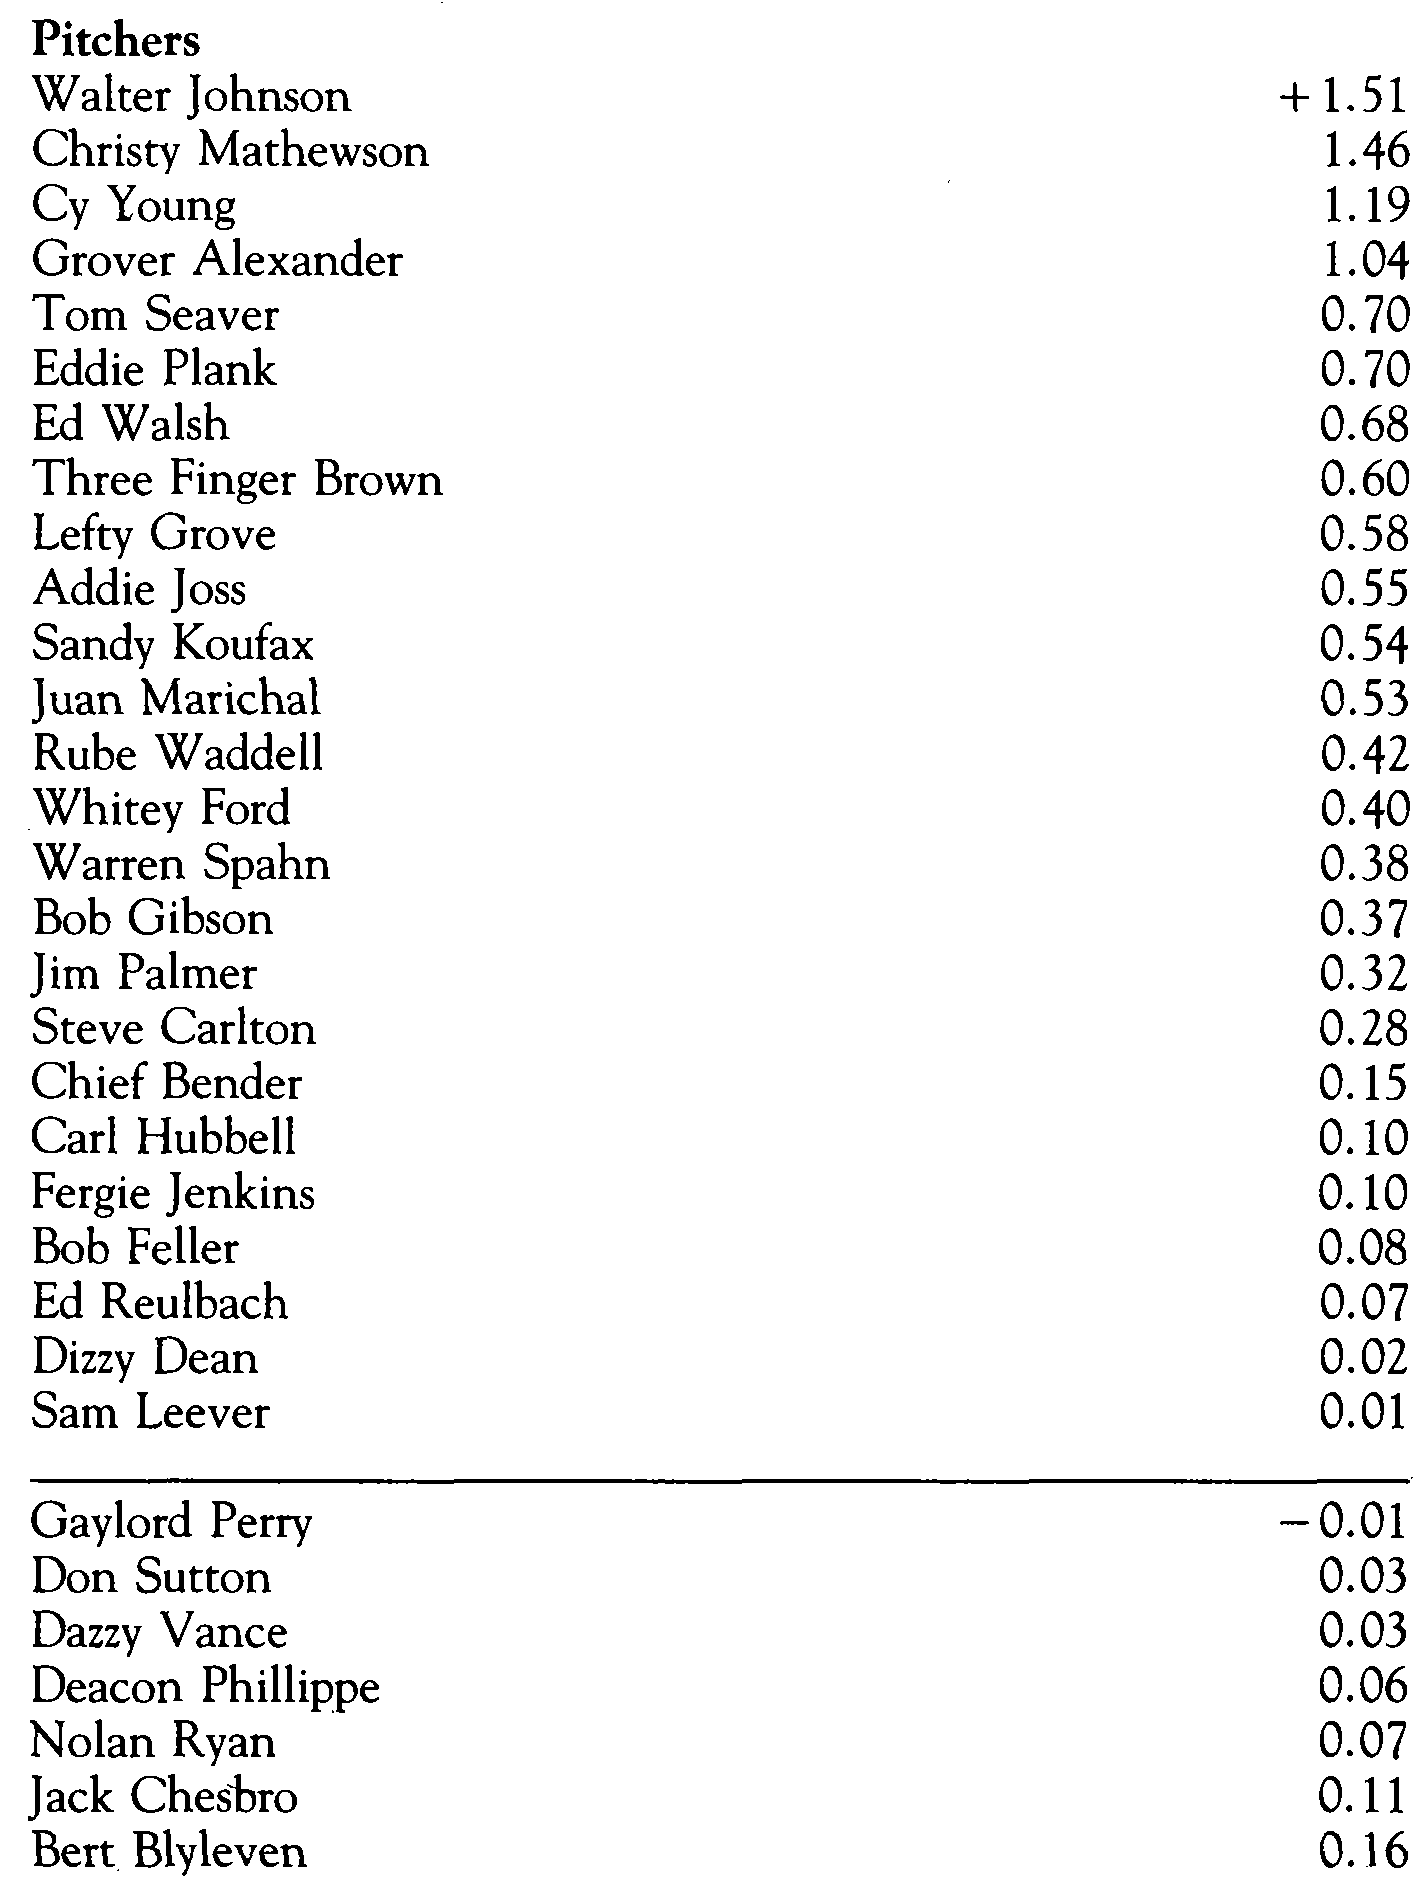
Walter Johnson’s + 1.51 SDs was the highest of any player at any position. Anyone could have predicted
Johnson, Mathewson, Young, and Alexander topping the list. But who would have guessed Eddie Plank? Notice how many pitchers of the last twenty years ranked very high: Seaver, Gibson, Koufax, Marichal, Ford, Carlton, Palmer, Jenkins, Perry, et al. Someone must have for gotten about Ed Reulbach and Sam Leever and Deacon Phillippe and Jesse Tannehill.
Then you look at the bottom of the list and wonder what Pop Haines and Ted Lyons and Waite Hoyt and Eppa Rixey and Herb Pennock and Red Ruffing and Marquard and Grimes and Faber are doing down there. They’re Hall of Famers, aren’t they?
RICHARD KENDALL is a middle-school social studies teacher in Buffalo, Wyoming.