

Who Were the Real Sluggers? Top Offensive Seasons, 1900-1999
This article was written by Eugene E. Heaton Jr. - Alan W. Heaton
This article was published in 2000 Baseball Research Journal
When Mark McGwire handily surpassed Roger Maris’s single-season home run record during his incredible 1998 season, it raised a good bit of discussion about where his stellar season ranked among the game’s greatest individual performances. Indeed, rankings of this kind are frequent, as the Baseball Research Journal articles by Bill Szepanski, in 1996, and Joe D’Aniello, in 1999, show.
Here we present a different view, using our own previously documented offensive statistic — Total Production Average — and a new derivation of that statistic, Relative Total Production Average. We use total production average (TPA) to identify the league-leading American and National League offensive seasons for every season from 1900-1999,1 and Relative Total Production Average (TPA+) to develop a list of the 100 best offensive seasons during that time.
We introduced TPA in our 1995 Baseball Research Journal article, and discussed it further in the 1997 and 1999 issues. Briefly, it is computed by summing the total number of bases resulting from the batter’s hits; adding bases on balls, runs scored, and runs batted in (minus home runs, to avoid double-counting), and dividing this sum by number of at-bats plus bases on balls.2 It represents an advance over the more widely used on-base plus slugging average (OB+SA) because OB+SA double-counts base hits and does not include runs scored or runs batted in. TPA takes into account the best aspects of on-base average, slugging average, and run production average and combines them into a single statistic that is easy to calculate and easy to interpret.
Our original paper examined career TPAs. For that paper, we painstakingly entered lifetime statistics from Total Baseball by hand into an Excel file. It would have been too laborious to calculate single sea- son TPAs for thousands of offensive seasons. However, the online database created by Sean Lahman (http://baseball1.com/statsf) now makes it possible to perform such calculations with relative ease.3 We used the Lahman database to help us calculate AL and NL TPA leaders for every season from 1900-1999, and to determine which were the 100 best seasons during that time, using relative total production average (TPA+).
To calculate single-season TPA leaders, we first downloaded the Lahman database into an Excel spreadsheet, then calculated each player’s TPA. To qualify, players had to have 3.1 plate appearances per game that their teams played. We did not attempt to adjust the TPA data for home park fluctuations.
Table 1 presents the AL and NL single season TPA leaders for each season from 1900-1999.


(Click images to enlarge)
As you can see, the game’s greatest stars make frequent appearances on the list of single season TPA leaders. Babe Ruth tops the list, with eleven league-leading seasons. Next are Ted Williams and Ty Cobb with nine apiece, followed by Rogers Hornsby (eight), Honus Wagner (seven), Mickey Mantle and Mike Schmidt (six), and Barry Bonds (five).
The highest TPA recorded from 1900-1999 was Ruth’s 1.301 in 1921. This is the only TPA over 1.300, and one of only four over 1.200. But was it the greatest offensive season ever? And where does McGwire’s record-breaking season rank? To answer these questions, we needed to create a new statistic that would let us compare offensive performance across different eras. Therefore, we developed the relative TPA, or TPA+.
The logic of the TPA+ is that each player’s offensive performance must be compared with that of the other hitters in his league that season. This same logic is employed in Total Baseball’s relative measure of offensive production, PRO+ and of earned run average, ERA+.4 To calculate TPA+, we used the Lahman database and Excel to calculate TPAs for each major league AL and NL season, 1900-1999. We simply summed up league totals for runs, singles, doubles, triples, home runs, runs batted in, bases on balls, and at-bats, then plugged the results into the TPA formula. We then divided each player’s single season TPA by his league’s TPA to come up with each player’s relative TPA, or TPA+.
The two other recent BRJ papers that examined baseball’s best offensive seasons both take interesting approaches. We naturally prefer ours, but there is something to learn from all three papers.
Szepanski examined how close players came to equalling each of eleven twentieth century single-season offensive records in a single season: runs scored, hits, doubles, triples, home runs, runs batted in, walks, batting average, on-base percentage, slugging average, and stolen bases. If the player equaled a record, he received a score of 100. If he got only halfway there, he received a score of 50, and so on. Thus, hypothetical total scores ranged from 0 to 1,100.
We see this as a “dream season” approach rather than as an index of overall offensive performance. We don’t think that all eleven categories should be considered equal, and believe that some are overweighted because the range of scores a player could get depends on the category. A player certainly could not score half of Ted Williams’s record OBP of .551 and still be in the majors. Most scores fall between 60 and 75 for this category. However, the same player could easily reach twenty-five percent of Rickey Henderson’s stolen base record (thus earning a score of 25) and still be considered a base stealing threat. In other words, the range of scores in the stolen base category is likely to be much greater than for the OBP category. Finally, Szepanski’s analysis is not relative — no one’s performance is adjusted by his peers’ performance.
D’Aniello’s analysis does take relativity into account. In his paper, he focuses on four offensive statistics: runs, home runs, runs batted in, and batting average. Although his analysis is much more complicated than this, what it basically does is to compare each of these statistics with the league average for that season and assign players a relative score for each category. The four relative scores are then combined into an overall score. The analysis is unwieldy because these scores must undergo a series of adjustments before being combined into an overall score.
First, D’Aniello’s analysis attempts to compensate for games missed by a player during the season by imputing how well his replacements would have done in his absence and adding those statistics to the player’s total to create an index of the player’s value to his team for a full season. While we agree that a player should be rewarded somehow for playing in all 162 games (rather than, say, 145 games), we also feel that if a player has made enough plate appearances to qualify for his league’s batting title, then his season should “count” as being eligible for consideration as one of the greatest offensive seasons of all time. In addition, the notion of appending imputed statistics from his teammates to a player’s own statistics seems somewhat counterintuitive and unnecessary to us.
D’Aniello also performs a logarithmic transformation on home runs in order to address one of the concerns that we had with Szepanski’s paper — the notion of different available ranges for different categories. This is one of the difficulties involved in combining ratios, and, we believe, one of the things that makes the TPA+ appealing by comparison — the TPA+ is composed of a single overall ratio, and is easy to compute. Further, by considering only runs, home runs, runs batted in, and batting average, D’Aniello’s analysis treats singles, doubles, and triples as equivalent, and does not address bases on balls, nor do his four categories deal with the double counting inherent in combining runs, home runs, and runs batted in.
That said, we now present the Top 100 Offensive Seasons from 1900-1999 ranked by TPA+. For purposes of comparison, we also show where our Top 100 seasons rank among Szepanski’s and D’Aniello’s, and also among Total Baseball’s PRO+ rankings (shown in Table 2 as “Sz”, “DA”, and “TB”, respective1y).5 As Table 2 shows, these are very impressive offensive seasons. Even Ken Williams’s hundredth-ranked TPA+ was over 1.5 times the league average.


(Click images to enlarge)
According to our analysis, the single greatest offensive season of the 1900s was Babe Ruth’s unbelievable 1920. His TPA+ of 1.914 was almost twice the league average. The Bambino’s 1920 season was also ranked first by Total Baseball, third by D’Aniello, and fourth by Szepanski. That 1921 season mentioned above was a close second. McGwire in 1998? The 24th best season of the twentieth century.
The TPA+ provides a clear indication as to who were the most dominant hitters of the 1900s. Not surprisingly, Babe Ruth appears a whopping thirteen times in the Top 100 seasons, including five of the top seven. Showing how the greatest batting ability was concentrated among a very few players during the twentieth century, fifty of the Top 100 seasons were compiled by eight players: Ruth, Williams, Cobb, Gehrig, Mantle, Foxx, Hornsby, and Wagner. Twenty players appear on the list two or more times, totaling seventy-five of the Top 100 seasons. At the right is the list of the players with two or more seasons in the Top 100. Of the retired players on this list, all but Dick Allen are in the Hall of Fame. Of the two active players, Barry Bonds and Larry Walker look like good Hall of Fame candidates.
Players with two or more appearances on the TPA+ Top 100 list
- 13: Babe Ruth
- 8: Ted Williams
- 7: Ty Cobb
- 5: Lou Gehrig, Mickey Mantle
- 4: Jimmie Foxx, Rogers Hornsby, Honus Wagner
- 3: Frank Robinson
- 2: Hank Aaron, Dick Allen, Barry Bonds, Joe DiMaggio, Hank Greenberg, Harmon Killebrew, Chuck Klein, Nap Lajoie, Mike Schmidt, Willie Stargell, Larry Walker
The players with the best offensive seasons as measured by their TPA+ are also the best hitters of the twentieth century.
An interesting and significant outcome of this analysis is that the Top 100 seasons are fairly well spread across the 1900s, without any complicated adjustments to the data other than comparing one’s TPA with his league peers. Here is the distribution of Top 100 scores by decade:
- 1900-1909 — 9
- 1910-1919 — 8
- 1920-1929 — 16
- 1930-1939 — 17
- 1940-1949 — 10
- 1950-1959 — 5
- 1960-1969 — 16
- 1970-1979 — 6
- 1980-1989 — 4
- 1990-1999 — 8
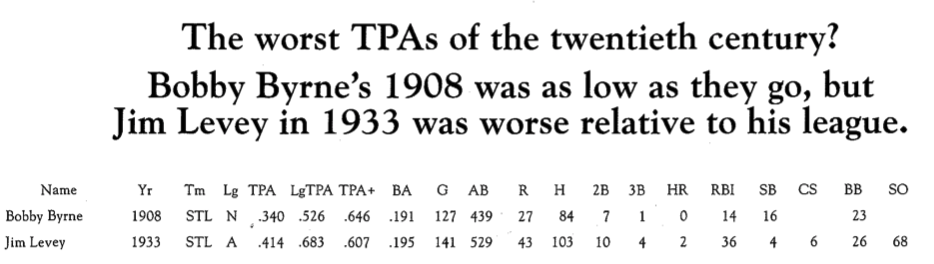
The TPA + can also be used to answer less “noble” questions. For example, we have spent considerable time trying to determine the best offensive seasons of the century, but what about the worst offensive seasons of the century? The TPA and TPA+ can provide insight into this, too. The single worst TPA compiled during the 1900s was the .340 racked up by third baseman Bobby Byrne for the 1908 St. Louis Cardinals. His line, below, is truly awful, but is it the worst relative season of the 1900s? You have to take into account the context in which Byrne’s statistics were compiled. In 1908 the TPA for the NL was an anemic .526, the second-lowest league TPA during the 1900s. The dubious honor for the worst relative offensive performance goes to shortstop Jim Levey and his 1933 season for the St. Louis Browns. While the rest of the AL was hitting to a relatively high .683 TPA, Levey compiled a TPA of .414 and a TPA+ of only .607. His line is shown with Byrne’s below.
Of course, it is frequently the case that a player having a season this bad will never get the chance to rack up enough plate appearances to qualify for his league’s batting title. The last-place 1933 Browns apparently did not have a better alternative than Levey, who played 138 games at shortstop in what was to be his final big league season.
In sum, the TPA+ allows for easy comparison of offensive seasons — good and bad — across eras. It is a useful tool in evaluating just where a given player’s season fits into the history of the game. We have had a great deal fun creating the TPA+ database and look forward to using it to answer all sorts of baseball questions. We hope that a hundred years from now, someone will take the time to perform our analysis using twenty-first century baseball statistics. Only time will tell how the Top 100 offensive seasons of the twentieth century will fare against those compiled in the twenty-first century.
ALAN W. HEATON is a consumer research manager at Merck & Co. EUGENE E. HEATON JR. is a retired market and opinion researcher. Father (Eugene) and son (Alan) have always shared a love of baseball, especially for the Baltimore Orioles, and earnestly hope for the resurgence of their once-proud franchise.
Notes
1. The American League in 1901 is not considered to have been a major league.
2. Ideally, hit-by-pitches, sacrifice flies, and catcher’s interference would be part of the TPA as well. There are several reasons why they are not included. First, they are not easily obtainable. Part of the goal of the TPA was to develop a statistic that was easy to compute given readily available statistics. Second, these statistics were not always kept. Finally, and most important, we analyzed over 5,000 offensive seasons including hit-by-pitches and sacrifice flies and found that their inclusion made very little difference — approximately .004 — in one’s TPA.
3. We would like to express our sincere thanks to Sean Lahman for creating the database and for allowing us to use it here. (“The Baseball Archive,” Sean Lahman’s “Baseball Database”).
4. PRO+ is defined as on-base average plus slugging average divided by league on-base average plus slugging average, with an adjustment for home park. While we applaud the adjustment for league performance, we feel this measure has the same limitations as OB+SA.
5. This list was taken from Total Baseball, 5th edition, which presents the top 100 single season PRO+s through 1996. The numbers in Table 2 are slightly different from Total Baseball‘s, because we removed pre-1900 seasons.