
The .700 Club: Blessedly Good Baseball
This article was written by Douglas Jordan
This article was published in Fall 2016 Baseball Research Journal
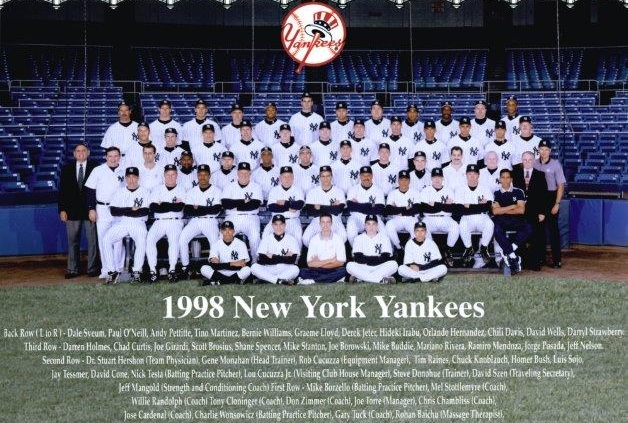
The New York Yankees have finished with a .700 winning percentage three times, most recently in 1998 when they went 114-48 and swept the World Series against the San Diego Padres. (NATIONAL BASEBALL HALL OF FAME LIBRARY)
The inspiration for this article was the play of the St. Louis Cardinals at the start of the 2015 season. Well into May, the Cards’ winning percentage was over .700. They were 24-10 (.706) after their game of May 14, which meant they had played over 20 percent of the season with a winning percentage above .700. I wondered: How many teams have played .700 ball for the whole season?
That’s a tall order — win seven of every ten games for an entire baseball season — so I assumed it would be a small number. Preliminary investigation confirmed my assumption. The following season, when the Cubs were playing over .700 ball into June, I took it as a sign I should look into the question seriously. But what is the best way to discuss these teams? Since some of the teams are among the most revered and written about in baseball history, I decided that rather than looking at the players on these teams, I would closely examine their statistical accomplishments in order to see if there were commonalities among them.1
The math is simple: 70 percent of 162 is 113.4, which means a team has to win 114 games to be over .700 on the season. For a 154-game season the same calculation results in 108 wins. Those are very impressive win totals, so it is not surprising that only nine teams after 1902 have managed to win that many games. The year 1903 is arbitrarily selected as a cutoff. (Apologies to the 1902 Pirates who played .741 ball but are not included in this analysis). All of the data presented in this article are from Baseball-Reference.com.
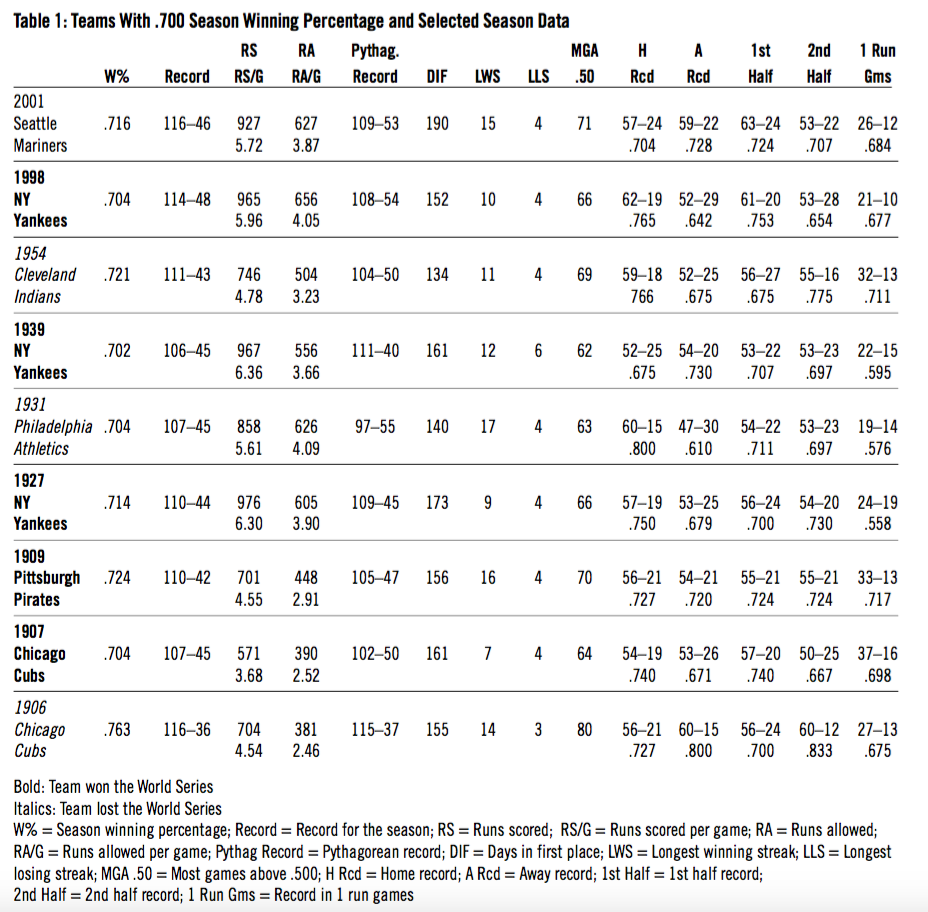
.700 Teams and Selected Season Data
Nine teams since 1903 have accomplished the impressive feat of winning over 70 percent of their games in a season. Table 1 lists them in reverse chronological order, along with some data associated with those seasons. Given the difficulty of winning that frequently, it’s not hard to find people who will say these are among the best teams of all time. About the 1906 and 1907 Cubs, Bryan Soderholm-Difatte writes, “…[F]rom 1906 to 1910 the Chicago Cubs had the best team in National League history.”2 Many people argue that the 1927 Yankees are the greatest team of all time, such as Harvey Frommer: “Yet eighty years after their spectacular season and thrilling World Series victory, the 1927 New York Yankees are still widely recognized as the greatest team in Major League Baseball history.”3 And although they didn’t win the World Series, the 1954 Indians are often argued to have had an all-time great pitching staff. For example, Gary Webster says, “The Indians rode the right arms of Bob Lemon, Early Wynn and Mike Garcia, still one of the best starting pitching staffs ever assembled, and boasted of the American League batting champion in second baseman Bob Avila.”4 Similar commentary can be found about all of the teams listed in Table 1.
(Click image to enlarge)
The data presented in Table 1 lead to a few general observations about these great teams. Seven of the nine teams played in the 52 seasons from 1903 to 1954, and three of those seven occurred between 1906 and 1909. Only two teams have played at least .700 ball in the 61 full seasons played starting in 1955, and there were 43 consecutive seasons after the Indians’ campaign in 1954 without any .700 MLB team. This suggests the overall competitive balance in baseball has improved over time, while the relatively capricious nature of playoff baseball is demonstrated by the fact that only five of these nine outstanding teams won the World Series. The Yankees appear on the list three times (1927, 1939, and 1998). The Cubs are the only other team with more than one .700 season and are also the only team to accomplish it in consecutive seasons (1906 and 1907). The 1906 Cubs also have the highest winning percentage at .763, and are tied with the 2001 Mariners for the most wins in a season with 116. The Cubs won more than three out of every four decisions in 1906.
The 1927 Yankees scored the most runs (976), although the 1939 Yankees outscored them on a per-game basis. And there is an interesting coincidence about the 1927 Yankees. The team had a season-winning percentage of .714, and Babe Ruth hit 714 career home runs. The two Cubs teams allowed the fewest runs per game. This is a reflection of the Deadball Era in which they played.
Pythagorean win expectation records are a function of runs scored and runs allowed.5 The only team on the list with more Pythagorean wins than actual wins is the 1939 Yankees. This suggests that they should have had more (rather than fewer, as the rest of the teams) actual wins, given their run production and prevention. The longest winning streak that any of these teams had was 17 games (the 1931 Athletics), while the longest losing streak was six games (the 1939 Yankees). The 1906 Cubs finished the season an astounding 80 games above the .500 mark.
Table 1 also presents the records for home, away, first half, second half, and one-run games for these teams, along with the winning percentages for those subsets of the season. Six of the nine teams had better home records, including the 1931 Athletics, who won 80 percent of their home games that season. Three of the teams played better on the road, including the 1906 Cubs, who won an amazing 80 percent of their away games. Those same Cubs also went 60–12 over the second half of the season, winning an incredible 84 percent of their games over that time period. Performance in close games does not appear to have a big impact on the overall winning percentage for these teams as only two of them played over .700 ball in one-run games and three of them played under .600 ball in one-run games.
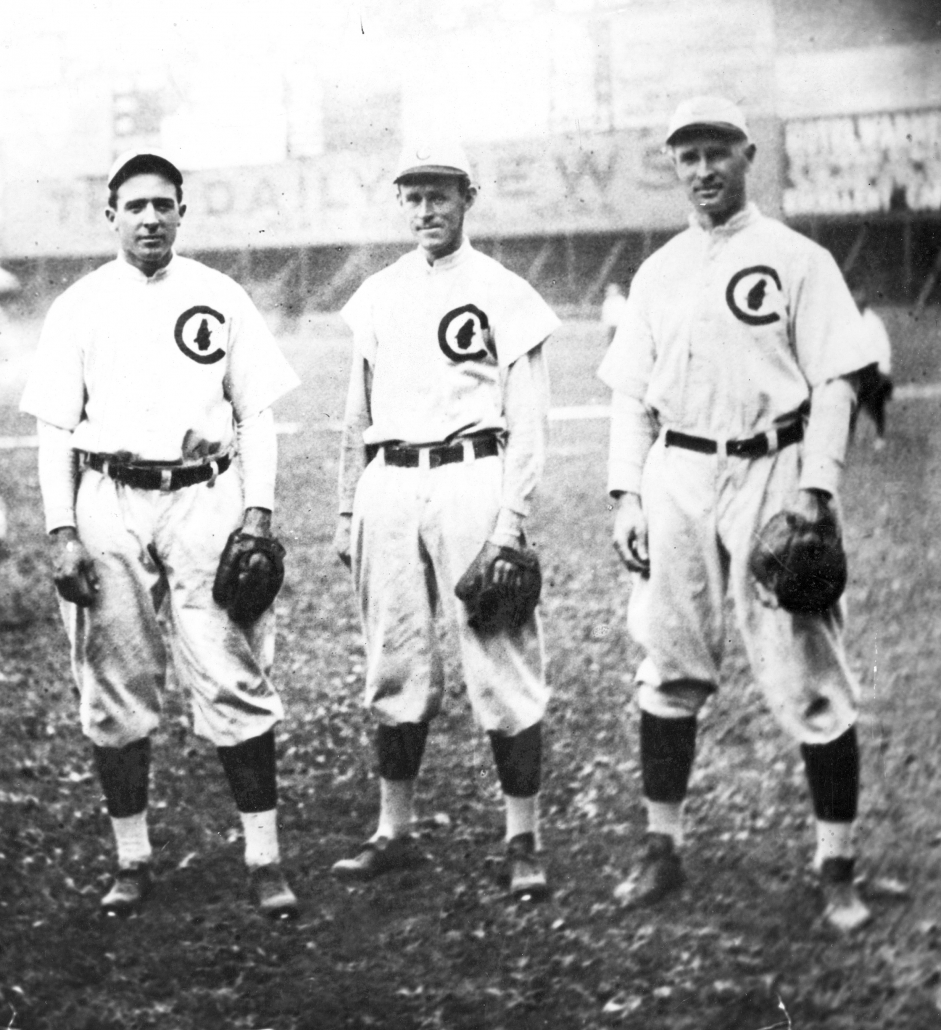
Shortstop Joe Tinker, second baseman Johnny Evers, and first baseman/manager Frank Chance led the Chicago Cubs to four pennants and two World Series championships between 1906 and 1910. (NATIONAL BASEBALL HALL OF FAME LIBRARY)
Team Batting and Team Pitching Data
The data in Table 1 are interesting, but we can gain still more insight into the accomplishments of these teams by looking at team batting and team pitching data and how these teams ranked in their league those seasons. A team is going to need to be strong in both hitting and pitching in order to win 70 percent of its games. However, it’s not obvious if one or the other is more important. The data in Table 2 can help us answer that question.

(Click image to enlarge)
Comparing the season totals in Table 2 for these teams is problematic because of changes in the game over the century or so between teams on the list. For example, the 1998 Yankees hit ten times as many home runs (207) as the 1906 Cubs (20) but those Yankees also struck out (1025) over twice as many times as the 1907 Cubs (449). On the pitching side, the three lowest ERA numbers are the two Cubs teams and the 1909 Pirates, who all played in the Deadball Era. That’s apples and oranges compared to the 2001 Mariners and the 1998 Yankees. Given these kinds of issues, the teams will be compared using rank in the league in order to try to draw conclusions across eras. That said, two of the offensive numbers in Table 2 stand out. The 1927 Yankees batted .307 as a team and had a team on base percentage of .384. The team got on base just under 40 percent of the time.
Which of the batting categories shown are least important? The rankings suggest home runs and strikeouts. Three of the teams in Table 2 are ranked fourth or worse in the league in home runs, so you don’t have to be a home run hitting team to win a lot. Avoiding strikeouts doesn’t seem to matter either, as only one team on the list (the 1907 Cubs) had the fewest strikeouts in the league while the 1927 Yanks had the most strikeouts that year.
What are the most important categories? Readers who are familiar with sabermetrics will not be surprised that runs scored is very important. Every team on the list with the exception of the 1931 Athletics (who were third) is ranked first or second in runs scored. In terms of both batting average and on base percentage, six of the teams are ranked first or second in both categories while three of the teams are third or fourth.
Which of the pitching categories are least important? Strikeouts. Only one of the teams (the 1906 Cubs) led the league in strikeouts. It’s clear the pitching staff does not need to generate big strikeout totals for the team to win a lot of games. Not giving up home runs isn’t that important either, as only three teams led the league in that category. In terms of bases on balls, five of the teams finished first or second in fewest walks allowed, three teams finished third while the ninth team (the 1906 Cubs) was fifth. These figures suggest that not walking too many batters is important. You don’t have to lead the league in fewest walks to win a lot but you cannot be leading the league in walks allowed if you want win a lot of games.
Which pitching categories are most important? The statistics for these teams clearly show that ERA and WHIP are crucial. Every one of the teams on the list with the sole exception of the 1909 Pirates (who were second in both categories to the Cubs) led their league in both ERA and WHIP. Those Pirates are a special case because the majority of the pitching staff for the 1909 Cubs was the same as the great staff of the 1906 and 1907 Cubs ballclubs. The 1909 Cubs did win 104 games (for a .680 winning percentage) but offensively the Pirates generated about one half run per game more than the Cubs. This allowed them to win six more games than that still excellent 1909 Cubs team.
Now we are in a position to answer the question: Is excellent hitting or excellent pitching more important to teams that win 70 percent of their games? The data in Table 2 strongly suggest that the answer is pitching, in particular having a low ERA and WHIP. A team almost has to be leading the league in those two categories if it is going to have a chance to play .700 ball. The same statement cannot be made of any offensive category. The team cannot be weak offensively but it doesn’t have to lead the league in runs scored, batting average, or on base percentage.
Table 2 shows the team batting and pitching statistics and their ranking against the rest of the league. But we can also look at these statistics compared to the league average for the category that year. This will give us an idea of just how much better a team has to be than the league average in order to win a high percentage of their games. The data are presented in Table 3.

(Click image to enlarge)
The numbers in Table 3 were calculated as follows, using the runs scored by the 2001 Mariners as an example. The Mariners scored 927 runs in 2001, while the league average for runs scored was 787. The ratio of 927/787 is 1.18. The 1.18 figure in Table 3 shows that the Mariners scored 18 percent more runs than average. For the pitching data where the ratio is below 1.0, you must subtract the ratio from 1.0 to see how much better the team was than average. For example, the Mariners ERA in 2001 was .79 compared to the league, so 1.0 minus .79 yields .21, or the Mariners were 21 percent better than average in terms of ERA. So what do the data in Table 3 tell us?
First, the most astounding number in Table 3 is the 2.87 home run figure for the 1927 Yankees. That means the Yanks hit almost three times as many home runs as the average club that year. Amazing. Of course, they also struck out 44 percent more times than the league average to accomplish the home run feat. Almost as impressive is the 0.67 ERA figure for the 1906 Cubs. That club’s ERA was 33 percent lower than the league average. Combine that accomplishment with the club scoring 28 percent more runs than average and it is no wonder the team won 116 games out of 152. The other datum that stands out is the average age for these teams’ pitching staffs. With the sole exception of the 1906 Cubs, who were slightly younger than average, every other club had a pitching staff that was older than average. Experience matters when it comes to pitching more so than hitting, where four of the nine clubs were younger or equal to average age.
In terms of individual statistics, Table 3 says that on average, teams use about ten percent fewer batters and pitchers than the league average, so stability in the lineup correlates with success. In runs scored, the 1927 Yankees tied the 1906 Cubs with 28 percent more runs scored than average, and the average for the nine teams is 19 percent better. These teams drew 13 percent more walks on average, while the 1927 Yankees were again the leader with 27 percent more bases on balls. All of the teams were slightly better than average in terms of batting average and on base percentage. Teams that hit worse than average are not going to win 70 percent of their games. On the pitching side, all of these teams have an ERA between 18 percent and 33 percent better, with an overall average of 24 percent better. They allow an average of 23 percent fewer runs and issue 12 percent fewer walks. The WHIP for these teams are all between 11 percent and 14 percent better than average.
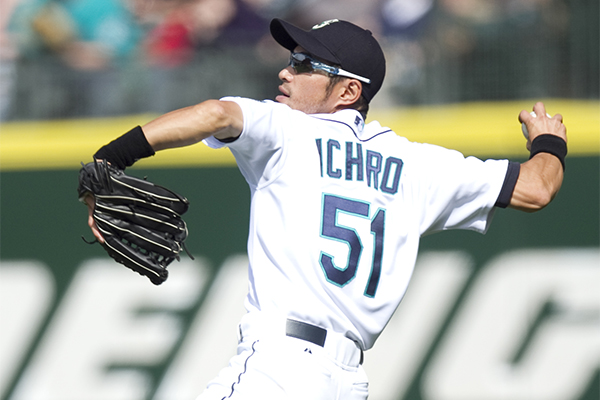
Ichiro Suzuki won MVP and Rookie of the Year honors in 2001, when his Seattle Mariners won a record-tying 116 games. (NATIONAL BASEBALL HALL OF FAME LIBRARY)
Comparison With Out-of-Sample Teams
The numbers shown in the top portion of Tables 2 and 3 shed some light on the accomplishments of these nine teams. However, we can gain a better appreciation of the excellence of this group by comparing them to other teams with good records that didn’t reach the .700 winning percentage standard. The teams with the best records in 2013–2015 were arbitrarily chosen for comparison. In 2015 the Cardinals had the best record in baseball with 100 wins (.617 winning percentage). The Los Angeles Angels had the best record with 98 wins (.605) in 2014, and the Red Sox and Cardinals both led with 97 wins (.599) in 2013. The Red Sox numbers are used in the tables since the Cardinals numbers are used in 2015 and the two Cardinals teams were similar in pitching and hitting abilities.
The last three lines in Table 2 show the offensive and pitching numbers of these three teams (and their league rankings) for easy comparison with the nine .700 teams. The 2015 Cardinals had very strong pitching and led the league in ERA and fewest runs allowed. But their offense was mediocre, being in the bottom half of the league in runs scored and home runs, and in the middle of the pack in batting average and on base percentage. The team won 100 games with excellent pitching and roughly average hitting. The 2014 Angels and 2013 Red Sox took the opposite approach. Both teams led their leagues in runs scored and ranked high in both batting average and on base percentage. But the pitching on both teams was mediocre. They both were in the middle of the pack in ERA and fewest runs allowed.
We can gain a little more insight into the performance of these three teams compared to the nine teams that won .700 ball by comparing their results to that of the league average. These results are shown in the last three lines of Table 3. The Table 3 numbers show that the Cardinals’ pitching in 2015 was not just good, it was historically good. Their ERA and runs allowed numbers are as good as those of the nine great teams. Similarly, the Angels and Red Sox runs scored numbers compare favorably to the nine great teams. But as their rankings in Table 2 suggest, their pitching was only slightly better than average.
So what can we conclude from these comparisons in Tables 2 and 3? This (admittedly small) sample suggests that teams can win a lot of baseball games (roughly sixty percent) by having either a very strong offense or very good pitching even if the weaker half of the team is merely average. This is actually not very surprising as it is quite common for teams to be stronger in one facet of the game than the other. But the interesting fact that these tables also show is that to improve the winning percentage from .600 (about 100 wins) to .700 (about 114 wins) requires a team to be one of the best in the league (and substantially above average) in both pitching and offense. It’s so rare for a team to have both of these strengths at the same time that only nine teams after 1902 have managed to be strong enough in both areas to get to the .700 winning percentage threshold.
The Greatest Teams Discussion
The topic of the greatest teams of all time is a perennial discussion among baseball fans. Rob Neyer and Eddie Epstein’s offering, Baseball Dynasties, discusses each of their 15 candidates in great detail and then ranks them with an extended discussion of the reasons for the rankings.vi But it is interesting to note that only four of their 15 teams (1906 Cubs, 1927 Yankees, 1939 Yankees, and 1998 Yankees) are on the list of teams that played .700 ball for an entire season. Why aren’t all of the .700 teams at least in the discussion? Neyer and Epstein admit to a bias against teams that only perform well for a single season. They write, “What do we look for in a great team?…It’s also important that a team be something more than a one-year wonder. Those teams, even if they have great numbers all the way around, are more likely to have been the beneficiary of some out-of-context seasons by some of their players and thus are not fundamentally as excellent as their one-season record might suggest.”7
Neyer and Epstein are not the only ones who slight single-season achievements. Another is Phil Birnbaum. In his 2005 SABR convention in Toronto presentation, Birnbaum argued that the 2001 Mariners and the 1998 Yankees were the two luckiest teams since 1960.8 He discounted position players and pitchers who had career years and compared the team’s actual record to its Pythagorean record.
But this kind of reasoning doesn’t really make sense. The teams won the games. Does it matter if some of the players on a team had a career year in order for that to happen? Players do have career years. In fact, it’s often argued that at least a few players on a team must have a career year if a team is to win the World Series. Those teams are not called lucky, so why should it matter if a .700 ball club had some career year players? It’s likely that this bias has its source in Hall of Fame standards. A single great year (or even a few) is not enough for a player to be considered Hall of Fame caliber. Longevity is an important consideration for the Hall of Fame.
But why should that standard be applied to overall team performance? Playing .700 ball for a full season is not the same thing as having a ten-game winning streak. Many teams have gotten hot and won ten in a row, but that in itself is clearly not enough to consider them a great team. If the discussion is great baseball dynasties, a single year’s performance certainly does not qualify, but if the discussion is simply great teams, why does that performance have to last more than one season? I don’t think it does, and therefore believe that these teams are all among the greatest teams ever. (Which team among the nine is best is very subjective. That exercise is left to the reader.)
Parting Thoughts
Humans draw lines. Lines between states, between countries, between fair and foul balls, and between balls and strikes. But the distance from one side of the line to the other can be very small. In this paper the line is a .700 winning percentage for a full season. The teams that finished above that line since 1903 are discussed here, but three teams that came within one win of that standard should be recognized. Those teams are the 1929 Philadelphia Athletics, the 1932 New York Yankees, and the 1995 Cleveland Indians. One more win in the same number of games and these three teams would have made the list.
A little elaboration on the 1995 Indians is in order. That Indians team won 100 games, so the wins total does not look impressive by the standards discussed here. But what is often forgotten is that the 1995 season was strike-shortened, so the 1995 Indians played 144 games instead of 162. It’s very likely their win total would have been the best since the 1954 Indians (who won 111) had they played an additional 18 games, and it’s possible they would have finished above .700 for the season. The accomplishments of this Indians team are under- appreciated today because of the deceptively low win total, and their loss to the Braves in the World Series.
DOUGLAS JORDAN is a professor at Sonoma State University in Northern California where he teaches corporate finance and investments. He’s been a SABR member since 2012. This article is his third contribution to the BRJ. He runs marathons when he’s not watching or writing about baseball. Email him at douglas.jordan@sonoma.edu.
Acknowledgements
I sincerely thank two anonymous peer reviewers for their comments and suggestions. Their input resulted in a much better paper.
Notes
1 Thanks to Cecilia Tan, SABR Publications Director, for her suggestions in this regard.
2 Bryan Soderholm-Difatte, “The 1906-10 Chicago Cubs: The Best Team in National League History,” Baseball Research Journal, 40 (Spring 2011)
3 Harvey Frommer, Five O’Clock Lightning; Babe Ruth, Lou Gehrig and the Greatest Baseball Team History, The 1927 New York Yankees, John Wiley and Sons, 2008.
4 Gary Webster, .721: A History of the 1954 Cleveland Indians, McFarland & Company, Inc., 2013.
5 Baseball-Reference.com uses 1.83 rather than 2 for the exponent in Bill James’s original “pythagorean” win expectation formula. For more information see http://www.sports-reference.com/blog/baseball-reference-faqs/)
6 Rob Neyer and Eddie Epstein, Baseball Dynasties: The Greatest Teams of All Time, W.W. Norton & Company, N.Y., 2000.
7 Neyer and Epstein, 12.
8 Phil Birnbaum, “Were the 1994 Expos Just Lucky?” Presentation at the 2005 SABR convention in Toronto. The PowerPoint slides are available at: http://www.philbirnbaum.com/ and click on “Were the 1994 Expos Just Lucky?”