

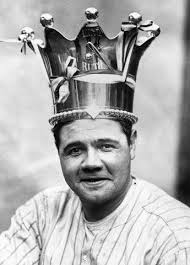
Babe Ruth in 1921: Recrowning Baseball’s Greatest Slugging Season
Editor’s note: This article was originally published in 2021 as part of the SABR Century 1921 Project.
 What was the greatest season by a hitter in major-league history? In his book with the provocative title The Year Babe Ruth Hit 104 Home Runs, Bill Jenkinson argues the case for the Babe’s 1921 season. The impressive home-run total in the title, rather than his actual tally of 59 that year, comes from Jenkinson’s analysis of Ruth’s batted-ball data: If Ruth had played in modern stadiums (with closer outfield walls), under modern rules (in 1921, foul poles were shorter and a ball was judged fair or foul based on where it landed), and with other modern conditions such as travel and training, he would have cracked triple digits in home runs, the author argues, shattering Barry Bonds’ single-season record of 73.1
Jenkinson’s book, published in 2007 just as Bonds had surpassed Ruth for second place all-time on the home-run list and was about to break Hank Aaron’s career record, also comes in on the heels of Bonds’ run of four consecutive National League MVP seasons from 2001-04, in which he set the all-time single-season records for home runs, walks, and on-base percentage (.609 in 2004). In that same year, Bonds also set the record for highest OPS in a season (1.422), and his 2002 season is the highest ever in the AL or NL in league-adjusted OPS+ (268).2
Moreover, with Negro League statistics now included among the majors, Josh Gibson in 1937 holds the record for OPS (1.474) and OPS+ (272), albeit in only 39 league games.3 Other strong seasons from hitters such as Ted Williams, Jimmie Foxx, and even some nineteenth-century players also provide an argument against crowing the Bambino as having the greatest year.
Yet the Babe’s 1921 campaign remains the benchmark in other statistical categories: total bases (457), runs scored (in the modern era, 177), and extra-base hits (119). These classical statistics show Ruth ahead of everyone else,4 but how does he stack up against the competition when modern sabermetric statistics are used as the measuring rod? Who had the greatest batting season by metrics such as weighted on-base average (wOBA), or Wins Above Replacement (WAR)? In this analysis, I will show that the Babe once again comes out on top, and that his 1921 season from 100 years ago was the greatest of all time when measured by the counting statistic of weighted runs created (wRC).
Babe Ruth in His Prime
Before performing any sabermetric analysis, let us first turn to the raw numbers from Babe Ruth’s 1921 season, as well as others in which he set records that still hold today. After breaking into the majors as a left-handed pitcher for the Boston Red Sox, Ruth switched to the outfield full-time in 1919 and was dealt to the Yankees the following season, in which he shattered his own single-season record for home runs of 29 by hitting 54 that year. His wOBA from that 1920 season, .598, remains the highest of all-time (minimum 300 at-bats), and he logged his career highs in slugging percentage (.847) and adjusted OPS+ (255).
Yet the following season was even more prolific, mainly because the Babe played in 10 additional games and came to the plate 78 more times. In 1921 Ruth broke his home-run record again by hitting 59, and set his career high of 171 RBIs, in addition to the aforementioned runs, total bases, and extra-base hits, as he led the Yankees to their first-ever American League pennant (his injury during the World Series arguably prevented the team from winning it all).5
He improved his batting average from .376 to .378, even though his wOBA dropped to .575, and even amassed his highest totals in triples (16) and stolen bases (17). Since he came to bat more times in 1921 than in 1920, the Babe’s WAR total improved as well: from 11.8 to 12.8 bWAR and 13.3 to 13.9 fWAR.
After a down year in 1922, the Babe put up another impressive season in 1923, with career highs in hits (205), walks (170), batting average (.393), and on-base percentage (.545). These figures led to his WAR total of 14.1 according to Baseball-Reference and 15.0 by FanGraphs, in each case the highest ever for a single season by a position player.6 That year as the Yankees moved into their own ballpark and won the World Series for the first time, his wOBA was .571, and it marked one of 11 seasons with a wOBA over .500, the most of any player. One of those seasons, 1927, is also notable for the Babe’s 60 home runs, although as our analysis will show, he was not even the most prolific player on his team that year in terms of wRC.
Yet any one of three of the Bambino’s seasons could be argued to be the greatest of all time: 1920 (by wOBA), 1921 (by total bases or other counting statistics), or 1923 (by WAR). By applying the algorithm to calculate wRC, we will see that the 1921 season gives Ruth the crown.
The Analysis
 The main source of information with which we operated was the Lahman baseball database, 2018 edition, and we analyzed it by writing a program in RStudio, as the R computer language is well suited to working with large data sets.
First, we filtered the “Batting.csv” file of the database to include only seasons in which the batter logged at least 300 official at-bats; this number seems arbitrary but works out to approximately two at-bats per team game, and assures that only full seasons, rather than stints, are counted. (As impressive as Manny Ramirez’s “Mannywood” stint with the Los Angeles Dodgers after the 2008 trade deadline was, in which he hit .396 with an OPS of 1.232, he did not keep up that pace for the whole season.) We then calculated the OPS for each batting season with the readily available data. While OPS is flawed in that it simply adds two rate statistics (on-base average and slugging percentage) with different denominators, and gives more weight to extra-base hits compared with how they actually increase the batting team’s run expectancy, it is easily calculated from the database. From this, we identified the highest 1,000 batting seasons based on OPS.
We then calculated wOBA and wRC for each of the top 1,000 seasons, using the linear weights noted for each season on the FanGraphs site.7 The first of these, weighted on-base average, measures the expected outcome of a player’s plate appearance, as calculated by multiplying the number of times a batter attains each outcome by the corresponding linear weights, then dividing by the total number of plate appearances. These weights vary from year to year, based on how much each event (walk, hit batter, single, double, triple, or home run) increased the number of runs that the team at bat would expect to score until the end of the inning, on average. Naturally, these values would be lower in higher-scoring seasons, so wOBA is an effective tool for normalizing a hitter’s performance as compared to the league’s run-scoring environment.
This measure is a rate statistic, however, and if we are to measure how prolific a batter’s season was, we would be better served by a counting statistic that sums up all of his contributions at the plate into one number. Fortunately, the metric of weighted runs created (wRC) does just that, converting wOBA into units of runs by a linear transformation that involves multiplying by a player’s number of plate appearances. (This is comparable to weighted runs above average (wRAA) but with a lower baseline.) We then ranked these top 1,000 batting seasons in descending order of wRC, to examine at a glance which players produced the most runs for their teams in a single season.
One difficulty that we found, however, concerned the recording of certain statistics across various eras of the game. The strict definition of wOBA (and in turn, wRC) removes intentional walks and sacrifice bunts from the set of a batter’s plate appearances, since they do not represent a confrontation between the pitcher and batter (either the pitcher decides not to face the batter, or the batter gives up his time at bat to attempt to advance a baserunner).
However, intentional walks were not recorded as such until the 1950s, and even sacrifice bunts and hit batsmen are missing from parts of the nineteenth century. If we were to exclude intentional walks for the more recent hitters, such as Barry Bonds, who set records for most free passes during his run of MVP seasons at the start of the twenty-first century, we would skew the results in favor of earlier hitters such as Babe Ruth, whose intentional walks have simply been counted as walks. In order to make a fair comparison across all eras, therefore, we decided to include intentional walks (counting them as ordinary walks) and sacrifices as plate appearances while calculating wOBA and wRC; this is why our values may differ from those found on some statistical websites.
The Results
The following chart shows the top 20 batting seasons by wRC:
|
Player |
Year |
Team |
OPS |
wOBA |
wRC |
|
Babe Ruth |
1921 |
New York Yankees |
1.356 |
.572 |
212.4 |
|
Babe Ruth |
1923 |
New York Yankees |
1.307 |
.568 |
209.2 |
|
Billy Hamilton |
1894 |
Philadelphia Phillies |
1.039 |
.490 |
207.5 |
|
Barry Bonds |
2001 |
San Francisco Giants |
1.379 |
.546 |
205.1 |
|
Barry Bonds |
2004 |
San Francisco Giants |
1.422 |
.570 |
201.9 |
|
Hugh Duffy |
1894 |
Boston Beaneaters |
1.187 |
.518 |
199.3 |
|
Jimmie Foxx |
1932 |
Philadelphia Athletics |
1.218 |
.522 |
193.1 |
|
Barry Bonds |
2002 |
San Francisco Giants |
1.381 |
.561 |
192.3 |
|
Lou Gehrig |
1936 |
New York Yankees |
1.172 |
.510 |
190.7 |
|
Tip O’Neill |
1887 |
St. Louis Browns |
1.180 |
.525 |
190.6 |
|
Lou Gehrig |
1927 |
New York Yankees |
1.226 |
.524 |
190.2 |
|
Babe Ruth |
1924 |
New York Yankees |
1.247 |
.544 |
190.1 |
|
Babe Ruth |
1920 |
New York Yankees |
1.377 |
.593 |
189.0 |
|
Babe Ruth |
1927 |
New York Yankees |
1.248 |
.534 |
188.9 |
|
Joe Kelley |
1894 |
Baltimore Orioles |
1.089 |
.487 |
186.4 |
|
Lou Gehrig |
1930 |
New York Yankees |
1.182 |
.494 |
185.2 |
|
Babe Ruth |
1930 |
New York Yankees |
1.209 |
.501 |
182.4 |
|
Ted Williams |
1949 |
Boston Red Sox |
1.141 |
.511 |
182.2 |
|
Lou Gehrig |
1934 |
New York Yankees |
1.172 |
.511 |
181.6 |
|
Mark McGwire |
1998 |
St. Louis Cardinals |
1.222 |
.502 |
181.5 |
This analysis shows that Babe Ruth did, in fact, have the most prolific season at the plate in 1921, the year described in detail by Jenkinson, as well as more recently by Father Gabriel Costa and Lt. Col. Kevin Cummiskey as the season with the greatest OPS and home-run rate relative to the league.8 Ruth’s 1923 season, in which he set the record for WAR, follows closely behind. Barry Bonds is the only other modern player to have reached 200 wRC in a season, having accomplished this during each of his record-setting seasons (for home runs in 2001 and walks in ’04), and another of his MVP years (2002) appears in the top 10. Ruth and his teammate Lou Gehrig combine for half of the top 20, with Gehrig even outperforming Ruth in the 1927 and 1930 seasons.
Other well-known heavy hitters appear near the top of the list: Jimmie Foxx (#7, 193.1 in 1932 and #30, 177.8 in 1938); Ted Williams (#18, 182.2 in 1949 and #25, 179.0 in 1941); Hack Wilson (#22, 180.7 in 1930, the year he set the record with 191 RBIs); and Rogers Hornsby (#23, 179.7 in 1922). Among active players, Albert Pujols has the highest wRC, with 163.0 in 2003 (#62 on the list); when he retires, that mantle will go to Joey Votto (#106, 154.7 in 2017).
Perhaps the most curious find, however, is that three of the top 20 seasons occurred in 1894: Billy Hamilton at #3, the year he set the all-time record for runs scored in a season with 198 (the Babe’s 177 in 1921 is tied for second); Hugh Duffy at #6, as he set the record for batting average with .440; and Joe Kelley at #15 as he led the Orioles to the National League pennant. All this happened in a comparatively shorter season; no team played more than 137 games, but the year was unusually high-scoring: the league average OBP was .379, the highest ever, and the run-to-wins factor that year was 14.483, the highest since 1873. For comparison, those values for 1930 (which also featured some top slugging seasons) were .356 and 11.453 respectively.9 As these nineteenth-century players had less impressive power numbers than Ruth, Bonds, and Foxx, and played in a higher run-scoring environment, we ought to consider a few other metrics for the sake of argument.
First, let us examine the 20 best seasons by wOBA, the rate statistic directly related to wRC. As mentioned before, this list counts intentional walks to apply a uniform standard across all eras of the game:
|
Player |
Year |
Team |
wOBA |
wRC |
Rank (wRC) |
|
Babe Ruth |
1920 |
New York Yankees |
.593 |
189.0 |
13 |
|
Babe Ruth |
1921 |
New York Yankees |
.572 |
212.4 |
1 |
|
Barry Bonds |
2004 |
San Francisco Giants |
.570 |
201.9 |
5 |
|
Babe Ruth |
1923 |
New York Yankees |
.568 |
209.2 |
2 |
|
Ted Williams |
1941 |
Boston Red Sox |
.568 |
179.0 |
25 |
|
Barry Bonds |
2002 |
San Francisco Giants |
.561 |
192.3 |
8 |
|
Barry Bonds |
2001 |
San Francisco Giants |
.546 |
205.1 |
4 |
|
Babe Ruth |
1924 |
New York Yankees |
.544 |
190.1 |
12 |
|
Babe Ruth |
1926 |
New York Yankees |
.542 |
179.4 |
24 |
|
Ted Williams |
1957 |
Boston Red Sox |
.535 |
152.9 |
126 |
|
Babe Ruth |
1927 |
New York Yankees |
.534 |
188.9 |
14 |
|
Rogers Hornsby |
1924 |
St. Louis Cardinals |
.526 |
169.6 |
45 |
|
Rogers Hornsby |
1925 |
St. Louis Cardinals |
.526 |
166.1 |
51 |
|
Barry Bonds |
2003 |
San Francisco Giants |
.525 |
158.4 |
82 |
|
Babe Ruth |
1931 |
New York Yankees |
.525 |
180.9 |
21 |
|
Ted Williams |
1946 |
Boston Red Sox |
.525 |
166.4 |
50 |
|
Tip O’Neill |
1887 |
St. Louis Browns |
.525 |
190.6 |
10 |
|
Lou Gehrig |
1927 |
New York Yankees |
.524 |
190.2 |
11 |
|
Ted Williams |
1942 |
Boston Red Sox |
.524 |
167.6 |
47 |
|
Jimmie Foxx |
1932 |
Philadelphia Athletics |
.522 |
193.1 |
7 |
Again, Babe Ruth takes the top two spots, but this time, the 1920 season wins out over 1921. Barry Bonds with his record numbers of intentional walks is once more close behind (although he would still occupy multiple spots on the list without them), but noticeably, Ted Williams and Rogers Hornsby rank more highly, because they did not log as many at-bats in their seasons as some of the players at the top of the list for wRC. Since the rate statistic wOBA measures what a batter is likely to do in any given time at bat (more so than OPS or batting average), it serves as an accurate metric for a player’s intrinsic ability to produce runs. Thus, the players who appear on the list multiple times can be considered the greatest hitters of all time: Rogers Hornsby, Ted Williams, and Barry Bonds: but the one who tops them all is still Babe Ruth.
Since wRC is a counting statistic, we can compare it to WAR, which similarly summarizes a player’s contributions over a full season. The following list of the top 20 seasons for position players by WAR comes from Baseball-Reference, and the figures include baserunning and defense, although most of the wins come from batting.
|
Player |
Year |
Team |
bWAR |
wRC |
Rank (wRC) |
|
Babe Ruth |
1923 |
New York Yankees |
14.1 |
209.2 |
2 |
|
Babe Ruth |
1921 |
New York Yankees |
12.6 |
212.4 |
1 |
|
Babe Ruth |
1927 |
New York Yankees |
12.5 |
188.9 |
14 |
|
Carl Yastrzemski |
1967 |
Boston Red Sox |
12.5 |
145.5 |
216 |
|
Rogers Hornsby |
1924 |
St. Louis Cardinals |
12.2 |
169.6 |
45 |
|
Barry Bonds |
2001 |
San Francisco Giants |
11.9 |
192.3 |
4 |
|
Lou Gehrig |
1927 |
New York Yankees |
11.8 |
190.2 |
11 |
|
Barry Bonds |
2002 |
San Francisco Giants |
11.7 |
192.3 |
8 |
|
Babe Ruth |
1920 |
New York Yankees |
11.7 |
189.0 |
13 |
|
Babe Ruth |
1924 |
New York Yankees |
11.7 |
190.1 |
12 |
|
Cal Ripken |
1991 |
Baltimore Orioles |
11.5 |
129.0 |
– |
|
Honus Wagner |
1908 |
Pittsburgh Pirates |
11.5 |
121.0 |
651 |
|
Babe Ruth |
1926 |
New York Yankees |
11.4 |
179.4 |
24 |
|
Ty Cobb |
1917 |
Detroit Tigers |
11.3 |
134.2 |
397 |
|
Mickey Mantle |
1957 |
New York Yankees |
11.3 |
160.4 |
72 |
|
Stan Musial |
1948 |
St. Louis Cardinals |
11.3 |
173.9 |
32 |
|
Mickey Mantle |
1956 |
New York Yankees |
11.2 |
164.9 |
57 |
|
Willie Mays |
1965 |
San Francisco Giants |
11.2 |
137.6 |
343 |
|
Willie Mays |
1964 |
San Francisco Giants |
11.0 |
132.2 |
444 |
|
Joe Morgan |
1975 |
Cincinnati Reds |
11.0 |
129.5 |
490 |
Unlike the wOBA figures, these WAR totals vary wildly from the wRC leaderboard. Part of this is that they include contributions from baserunning and defense, not just batting, and another part is that bWAR includes a positional adjustment, which explains how middle infielders like Joe Morgan, Honus Wagner, and Cal Ripken shot up the chart.10 The WAR numbers also measure a player’s performance relative to the league’s baseline, which is why the Triple Crown seasons of Carl Yastrzemski and Mickey Mantle appear higher. Yet once again, Babe Ruth appears at the top, taking the top three positions and finally gaining the upper hand against his 1927 teammate, Lou Gehrig. As with wOBA, the 1921 season ranks second all time, but a different season (1923 rather than 1920) tops the list, suggesting that 1921 was a stronger season as it appears closer to the top of the list for more statistics.
Another figure that can be examined is the classical counting statistic of total bases, for which the Bambino’s 1921 campaign is also the best. This chart shows the top 10 (with Gehrig and Gonzalez tied for 10th), and in this category, Ruth does not dominate as he does with the sabermetric measures, but still holds the top spot nonetheless. He next appears on the list at #13, with 417 total bases in 1927.
|
Player |
Year |
Team |
Total Bases |
wRC |
Rank (wRC) |
|
Babe Ruth |
1921 |
New York Yankees |
457 |
212.4 |
1 |
|
Rogers Hornsby |
1922 |
St. Louis Cardinals |
450 |
179.7 |
23 |
|
Lou Gehrig |
1927 |
New York Yankees |
447 |
190.2 |
10 |
|
Chuck Klein |
1930 |
Philadelphia Phillies |
445 |
175.6 |
31 |
|
Jimmie Foxx |
1932 |
Philadelphia Athletics |
438 |
193.1 |
6 |
|
Stan Musial |
1948 |
St. Louis Cardinals |
429 |
173.9 |
32 |
|
Sammy Sosa |
2001 |
Chicago Cubs |
425 |
178.5 |
27 |
|
Hack Wilson |
1930 |
Chicago Cubs |
423 |
180.7 |
22 |
|
Chuck Klein |
1932 |
Philadelphia Phillies |
420 |
158.6 |
80 |
|
Lou Gehrig |
1930 |
New York Yankees |
419 |
185.2 |
16 |
|
Luis Gonzalez |
2001 |
Arizona Diamondbacks |
419 |
173.3 |
35 |
A further expansion on the wRC metric is a normalization, known as wRC+, that adjusts for park factors and is scaled so that the league average is 100. We can calculate this value for the Babe’s 1921 season as compared to the rest of the league. While the Polo Grounds had short fences to left and right field, the park deepened considerably in the power alleys and especially in center field, so that the park factor that season was 101, only slightly favoring hitters. The scaling factor for wOBA that year was 1.234 with a league average of .348, and the number of runs per plate appearance was 0.125 with wRC/PA of 0.1381.11 This results in a wRC+ value of 221 for the Babe, close to FanGraphs’ value of 224. However, the same site lists higher values for Ruth’s 1920 (239) and 1923 (231) seasons, and Barry Bonds’ 2002 season (244) is even higher.
Since wRC+ is a rate statistic that measures performance based on the league average, its comparable counting statistic would be WAR (or, strictly speaking, Wins Above Average). Going by the counting statistic, then, Babe Ruth would return to the top of the list, and the studies by Costa and Cummiskey on the Babe’s home-run rates as compared to the rest of the league would cement his place at the top; for Barry Bonds never out-homered any entire teams.12
A word must be said about some seasons from the Negro Leagues. After Major League Baseball decided in December 2020 to recognize statistics from seven Negro Leagues from 1920 to 1948 as equivalent to the American and National Leagues, some of the greatest African American sluggers of the era may be expected to join the list. Josh Gibson comes to mind, as he posted OPS figures of 1.474 in 1937 and 1.427 in 1943, both higher than any AL or NL batter. Other impressive seasons belong to Oscar Charleston (1.299 OPS in 1925), and Buck Leonard (1.264 in 1939).
However, only official league games count as major-league games, and a typical Negro League team would play fewer than 60 games in the league each year, with the rest of the schedule filled out with exhibition and barnstorming games. Therefore, none of these seasons would compare to those in the table as far as counting statistics are measured, and very few of them would even contain enough at-bats to make the list for rate statistics; in fact, Gibson’s only season with 300 at-bats was in Mexico in 1941, and the Mexican League was a completely different entity.
The Seamheads database does include wOBA figures for the Negro Leagues, and Gibson’s two aforementioned seasons (.622 and .595 respectively) outrank the Babe in his prime, but without any play-by-play data available, we cannot construct the run expectancy matrix that is necessary for linear weights. One would expect some regression toward the mean in a longer season, but given Gibson’s career numbers, it is perfectly plausible that he could have sustained an OPS above 1.300 over a 154-game season, as Ruth and Bonds have done, and possibly broken 200 wRC in such a season – but we cannot know for sure. The smaller sample size for Gibson thus lends a more direct comparison to Mannywood.
As sabermetrics is the search for objective knowledge about baseball, it will be fascinating to develop a method to make a fair comparison between the Negro Leagues and the AL and NL. However, casting the at-bat minimum aside, an integrated Top 20 list for OPS, the best rate statistic available, would look like this:13
|
Player |
Year |
Team |
OPS |
|
Josh Gibson |
1937 |
Homestead Grays |
1.474 |
|
Josh Gibson |
1943 |
Homestead Grays |
1.427 |
|
Barry Bonds |
2004 |
San Francisco Giants |
1.422 |
|
Barry Bonds |
2002 |
San Francisco Giants |
1.381 |
|
Barry Bonds |
2001 |
San Francisco Giants |
1.379 |
|
Babe Ruth |
1920 |
New York Yankees |
1.377 |
|
Babe Ruth |
1921 |
New York Yankees |
1.356 |
|
Josh Gibson |
1939 |
Homestead Grays |
1.315 |
|
Babe Ruth |
1923 |
New York Yankees |
1.307 |
|
Oscar Charleston |
1925 |
Harrisburg Giants |
1.299 |
|
Ted Williams |
1941 |
Boston Red Sox |
1.287 |
|
Barry Bonds |
2003 |
San Francisco Giants |
1.278 |
|
Buck Leonard |
1939 |
Homestead Grays |
1.264 |
|
Josh Gibson |
1936 |
Pittsburgh Crawfords |
1.261 |
|
Ted Williams |
1957 |
Boston Red Sox |
1.257 |
|
Oscar Charleston |
1924 |
Harrisburg Giants |
1.257 |
|
Babe Ruth |
1927 |
New York Yankees |
1.248 |
|
Oscar Charleston |
1921 |
St. Louis Giants |
1.248 |
|
Babe Ruth |
1924 |
New York Yankees |
1.247 |
|
Babe Ruth |
1926 |
New York Yankees |
1.245 |
Conclusion
Every branch of mathematics has its own fundamental theorem; and the following has been whimsically proposed as the “Fundamental Theorem of Sabermetrics”: “If an analysis is conducted to determine baseball’s greatest all-time player and Babe Ruth does not emerge as the greatest, then something is wrong with the analysis.”14 In these lists of the greatest hitting seasons of all time, no matter what metric is chosen, no one appears quite as often as Babe Ruth.
While some metrics such as OPS show him trailing players with a smaller sample size or who suddenly increased their power later in their careers, other sabermetric statistics, especially those that consider the player’s accumulated performance over the entire season, show the Bambino at the top. Even when intentional walks are counted toward wOBA and wRC, so as not to give the Babe a selective advantage over Barry Bonds based on which data are available, the Sultan of Swat still ends up ahead. In particular, his 1921 season was the most prolific as measured by weighted runs created, in addition to more traditional measures like total bases. As we reach the 100th anniversary of this spectacular season, let us remember how in the history of the game of baseball, no one player left quite an impact like Babe Ruth.
Notes
1 Bill Jenkinson, The Year Babe Ruth Hit 104 Home Runs: Recrowning Baseball’s Greatest Slugger (New York: Carroll & Graf, 2007).
2 All quoted statistics come from either Baseball Reference or FanGraphs, unless otherwise noted. In particular, wOBA, wRC, and wRC+ are found on the player’s page on FanGraphs.
3 Seamheads, “Negro Leagues Database,” accessed January 11, 2021, seamheads.com/NegroLgs/index.php.
4 Father Gabriel B. Costa, personal correspondence, January 5, 2021.
5 Jenkinson, 152. Despite the postseason injury, he refers to the 1921 campaign as “The Ultimate Season.”
6 Some pitchers of the nineteenth century and early twentieth century, who pitched far more innings than modern-day pitchers, have higher WAR totals, mainly because of their volume of innings pitched.
7 FanGraphs. “Guts!” accessed January 11, 2021, fangraphs.com/guts.aspx?type=cn.
8 Costa, personal correspondence.
9 FanGraphs, “Guts!”
10 Ripken’s 1991 MVP season does not even rate among the top 1,000 seasons by OPS; the wRC figure comes from FanGraphs.
11 FanGraphs, “Guts!”
12 Costa, personal correspondence.
13 Seamheads, “Negro Leagues Database.” Ties are broken by number of plate appearances.
14 Gabriel B. Costa, Michael R. Huber, and John T. Saccoman. Understanding Sabermetrics, 2nd ed. (Jefferson, North Carolina: McFarland, 2019), ix.