
Measuring Defense: Entering the Zones of Fielding Statistics
This article was written by Jeff Zimmerman - Dan Basco
This article was published in Summer 2010 Baseball Research Journal

Doug Glanville in his new baseball memoir notes that many players, “rewarded with huge contracts because of their offensive prowess, . . . have developed a kind of attention deficit disorder when it comes to defense. . . . If you put up tremendous offensive numbers year after year, the game will cut you a little slack when it comes to the glove.”1 But is that still true? Or, rather, is the converse still true—that the compensation to players whose glove is better than their bat is not commensurate with their true value?
In the past year many baseball writers have remarked that “defense is the new on-base percentage,” meaning that it’s an undervalued asset—as the ability merely to get on base was about a decade ago, when driving in runs was thought to be the ticket, or so said Michael Lewis in Moneyball. You would think that, if here and there online and now in the pages of the Baseball Research Journal you’re reading that defense is undervalued in the market, surely it no longer is. Wouldn’t the market have already corrected itself? “We were concerned several years ago that the advantage of the things that we knew could play itself out when you reach the point that everybody knew those things,” Bill James told a gathering of the Boston chapter of the Baseball Writers Association of America earlier this year.2 Haven’t all the front offices caught on by now, so that there are no more bargains for them to sift through in the glovework department?
But knowing where to shop is not the same as knowing what to look for once you get there. If some position players whose good glove more than offsets their weak bat still have a market value below their actual value, how would you know how to identify them? “The reason there are still more inefficiencies on the defensive side is that defense remains hard to quantify,” Jeff Kingston, assistant general manager of the Seattle Mariners, told Sports Illustrated earlier this year. “The metrics have come a long way in the last few years, and clubs go to great lengths to quantify defense, but they simply don’t have the same confidence level as they do in quantifying offense.”3
James agrees with Kingston that a major limitation of the effectiveness of defensive metrics is that our “confidence” in them is shaky. Referring to the quantification of defense, he comments that “we haven’t been doing it all our lives. We’ve had pretty good methods now for five or six years. I’ve been doing the [offensive] stuff all my life. I know what’s a normal gap between two seasons [offensively] and what isn’t. I don’t know the same [defensively].’’ Even so, he thinks that defense “can be evaluated with the same degree of precision and the same degree of agreement among different methods as [can] offense.”4
It’s true that the business of quantifying offense has undergone profound development in the past thirty years, after decades of relative stasis. To the familiar categories of batting average, RBIs, runs scored, and so forth, baseball analysts have proposed countless new metrics, some of which—OPS+, wOBA, linear weights—have stuck. Although Major League Baseball doesn’t recognize them as official statistical categories, they’re computed from the actual statistics in the official record and have proven to be reasonably reliable instruments for evaluating and predicting a player’s offensive performance.
Most of the effort to quantify run prevention, or defense, has been focused on pitching, at least since the late nineteenth century. Sabermetric scrutiny in general has been so abundant, however, that, whether or not fielding has been scrutinized less than pitching, it’s still been scrutinized a lot—more than a lot of people who take a professional interest in the subject can easily keep up with.
The earliest baseball writers used the terms offense and defense in a precise manner that doesn’t match up entirely with twenty-first-century usage. Defense for them was the entire project of preventing runs, and that includes pitching as well as fielding. In this article we use the term defense mostly in the twenty-first-century sense, to mean fielding as distinct from pitching.
Below we’ll look at some of the new, and not so new, defensive metrics that Jeff Kingston alludes to and then at some of the major-league clubs that are mining them for information that might give them insight and an advantage over their competition. First, though, let’s look back at the handful of defensive statistical categories that are familiar and traditional. A brief inquiry into their history might give us a new perspective on defense and on the report that defense is the new OBA.
EARLY FIELDING STATISTICS: REWARD RANGE OR PENALIZE ERROR?
Recent buzz about defense may strike you as a fad that will soon pass, but in some respect it reflects a return to the earliest days of organized baseball. “It’s almost impossible,” writes Alan Schwarz in The Numbers Game, “for the modern baseball fan, conditioned to focus on the battle between pitcher and batter, to appreciate how important fielding was in the early game. … As baseball historian John Thorn notes, ‘Fielding skill was still the most highly sought after attribute of a ball player.’”5
Already by 1876, putouts, assists, and errors were added together to determine chances, and fielding percentage was calculated as it is now. In 1887, the practice of counting wild pitches and passed balls as errors, or “battery errors,” was discontinued. Double plays by individual fielders were added as an official stat in 1922. This was among statistical categories that weren’t included in official records in the early days but that nonetheless were recorded in box scores, from which later researchers have reconstructed season totals. Stolen bases against individual pitchers and catchers began to be recorded more reliably, and catchers began to be credited for “caught stealing.” Otherwise the system of measuring defense remained fairly static until Bill James began to publish his groundbreaking work in the late 1970s.
As for fielding percentage, Henry Chadwick was not alone in thinking that range was more important than sure-handedness. In his Beadle guide following the 1872 season, fielding statistics did not include errors.6 In 1875, Al Wright, following a similar philosophy, took the sum of putouts and assists and divided that by games—a metric that rewarded players for how often they got to a batted ball. Errors didn’t figure into it at all. This method of quantifying fielding didn’t catch on—not, that is, until about a hundred years later, when James introduced Range Factor. Wright had called it “fielding average.”7
What is the primary criterion by which the performance of a fielder ought to be evaluated? Chadwick represented the school of thought, which perhaps was more traditional, that fielders should be rewarded for range, but the opposing school of thought, that the emphasis should be on penalizing them for errors, was winning the day. The debate was captured, and the case for the reward-range doctrine nicely made, in a poem in a New York newspaper in 1917.8
Chances
When the fielder loves his record
More than victory for his team
Doubtful chances miss his glances
For his caution is extreme.
Going after every grounder
Means a slip-up here and there,
And in terror of an error
He will choose the chances fair.
Spotless records are enticing
In a ball game as in life,
And the cunning pick their running
To avoid the stony strife.
Many a mortal swaggers slowly
Down the years in proud parade,
Boasting to the meek and lowly
Of the slips he never made.
Well it is that wise commanders,
When they call for sterling men,
Place the workers o’er the shirkers
Though they err and err again.
Men who try and fall when trying
Try again and win at last,
Never brooding, never sighing
O’er the errors of the past.
— William F. Kirk
Kirk went on to say that managers prefer that their players go after everything even if it means they make more errors, as long as they’re not mental errors.
We often hear that 90 percent of baseball is pitching. Addie Joss first said that, in 1906, according to Bill James, who adds that, when Joss was criticized for it, he tried to explain that he meant that pitching was 90 percent of defense. John McGraw divided it up this way—batting is half of baseball, pitching is one-third, and fielding is one-sixth.9
Hugh Fullerton, a baseball writer, came up with a different formula in 1921. He gave more weight to offense and fielding than McGraw did and less to pitching. First he divided the game into offense and defense (fielding plus pitching) and gave roughly twice as much weight to the former—his exact ratio was 64 to 36. Then he subdivided defense into each of the nine positions. Of that 36 percent of the total, it was 36 percent for the pitcher, 14 percent for the catcher, 6.5 percent for the second baseman, 6 percent for the first baseman, and less than 6 percent for each of the remaining positions.10 All this, of course, was pure conjecture—as is the assumption that fielding counts for less now than it did back then. That assumption, however speculative, is hardly groundless, though: There are more strikeouts and home runs now and consequently fewer balls put into play.
In 1954, Allan Roth and Branch Rickey, at that time general manager of the Pittsburgh Pirates, developed an “efficiency formula” for quantifying run-creation and run-prevention performance. Unable to figure out how to measure fielding, they set their metric for it at 0—that is, they threw up their hands and just assumed that its overall effect on the game’s outcome was neither positive nor negative. Rickey was resigned to the idea that “there is nothing on earth anyone can do with fielding.”11
GOLD GLOVE AWARD
In 1957, Rawlings, the baseball-glove manufacturer, established the Gold Glove Award for the player who would be voted the best fielder at his position. The inaugural All-Star Fielding Team, as it was called, was voted on by a committee of sportswriters and was drawn from players in both leagues. Since 1958, the Gold Glove has been given to nine players in each league. From 1958 through 1964, they were voted on by players. In 1965 the vote came instead from managers and coaches (they could not vote for players on their own team), and this practice has continued to the present day.12
Everyone understands that the basis for selection is ultimately subjective. It depends on the judgment of voters, whose impressions will be influenced by a given player’s reputation and will vary according to how much of his performance, and which moments of it, they’ve witnessed, either live or on TV. The dearth of familiar statistical categories that can serve as a common criterion that all voters can take into account makes the Gold Glove Award even more susceptible to being discounted by skeptics than are, for example, the Cy Young and Most Valuable Player awards.
Moreover, no minimum number of games or innings at each position is stipulated, making it possible for Rafael Palmeiro in 1999 to become the “first DH to win the Gold Glove,” which he was awarded for his work at first base, where he’d played a grand total of 28 games.13 It’s true that a given Gold Glove winner is likely to have already been more high-profile than the average player—to play for a winning team, to have been selected to the All-Star Game, to have won the Gold Glove previously—and this raises the question whether voting is biased against the player who arguably was the better fielder but lacks marquee status.14
As a data point, then, that we can use when plotting the fielding quotient of a player who has won it, the Gold Glove Award is of limited value, but neither should it be ignored or outright dismissed. Judgment calls based on seeing, on empirical evidence, do count for something, as any scout will tell you, and when joined to statistical analysis the two modes of evaluation taken together may produce a higher confidence level than either of them taken only by themselves. Still, the usefulness of the Gold Glove Award in evaluating defensive talent across MLB would be greater if the details of the vote were made public—only the winner is announced, so we don’t know by how much he won or who else was in the running.
SABERMETRIC STATISTICS
The statistical measurement of defensive performance has undergone profound development in the past forty years. Most innovations in defensive metrics during this period fall into one of two flavors—metrics that can be derived from the established statistical categories (putouts, assists, errors, total chances) and metrics that require batted ball information, including hit locations. One metric, Total Zone, incorporates the best of both approaches.
Statistics Based on Box-Score Statistics
The first proposals to reassess fielding statistics involved adjustments to the defensive statistical categories that have existed since 1876. The newer metrics—Range Factor, Relative Range Factor, Adjusted Range Factor, Defense Efficiency Record, Fielding Runs, and Fielding Wins—are generated from calculations based on these simple box-score statistics. A big advantage of these metrics is that they can be calculated for any year from 1876 to the present.
Range Factor (RF) and Relative Range Factor (RRF). In 1976, Baseball Digest ran “Fielding Statistics Do Make Sense!” an article wherein the author, one Bill James, introduced Range Factor, a reincarnation of Al Wright’s fielding average (putouts added to assists and divided by games). Later James acknowledged that Range Factor could not adequately capture the fielding performance of pitchers, catchers, and first basemen. Moreover, he explained, it was liable to be skewed by the following:
The number of a player’s defensive innings is not necessarily the number of games he played in multiplied by the number (in most cases, nine) of innings in that game. (James would later propose that defensive innings be recorded. They would have to be estimated for games before 1952.)
A player is likely to get more opportunities if he plays on a team whose pitchers have a low strikeout rate.
A pitching staff with a high ratio of groundballs to fly balls is likely to increase the number of chances for infielders and to decrease the number of chances for outfielders.
A pitching staff that is more left- or right-handed than average will affect the number of fielding opportunities for the various position players, with a left-handed pitcher, for example, likely to increase the number of opportunities for the left fielder, third baseman, and shortstop and to decrease the number of opportunities for the right fielder and first and second basemen.
It does not adjust for team defense. “Every team makes 27 outs,” James explained in The Fielding Bible (2006), “whether they field like a team of Adam Everetts or a team of Jason Giambis. The overall range factor of a bad team is the same as the overall range factor of a good team.”15
James adjusted for these wrinkles in Relative Range Factor (RRF), which he introduced in a chapter in The Fielding Bible, twenty years after his original article on plain Range Factor.16 Using Defense Efficiency Record (see below), he also adjusted for team defense to compensate for the fewer opportunities that a given fielder is likely to have if he plays on a team with good defense.
An important advantage of RRF is that can it be used for seasons as far back as 1876. A practical advantage that plain Range Factor has over Relative Range Factor is that it can be generated entirely from the data in box scores (you don’t consider, for example, whether the pitchers the fielders are playing behind are groundball or fly-ball pitchers), although the reliability of plain Range Factor is inferior to that of RRF.
Adjusted Range Factor. In the 1980s, Tom Tippett developed Adjusted Range Factor.17 A variation on Range Factor, it’s based on the number of balls in play (other than home runs) while each fielder is at his position. It’s adjusted for the strikeout and groundball rates of the pitching staff and for the handedness of batters. It tracks only meaningful putouts and assists—for example, when a second baseman fields a groundball and throws to first to retire the runner, the assist is considered meaningful, whereas the putout executed by a first baseman catching the thrown ball is not. However, like Range Factor, Adjusted Range Factor yields an estimate, not an exact measure of the opportunities presented to a fielder. For historical data, this provides a better estimate than does plain Range Factor, although it’s still an estimate.
Defense Efficiency Record (DER). James went on to develop DER (defense efficiency record), a defensive metric applicable to teams. DER is a measure of the percentage of batted balls that become outs. For example, a team that records outs on 72 of 100 balls put into play has a DER of .720. DER can be applied to historical data. Roughly, it’s an inverse of batting average (roughly in that neither strikeouts nor home runs affect DER). It varies from era to era, so that it fails to measure a team’s defense relative to the league average at the time, and it does not do a great job of distinguishing pitching effectiveness from fielding.18 Still, DER is highly correlated with winning. From 2008 to 2009, for example, the Tampa Bay Rays went from worst to first in DER and from worst to first in the American League East standings.19
Fielding Runs and Fielding Wins. Pete Palmer in Total Baseball introduced Fielding Runs, a formula for estimating how many runs a fielder saves.20 A player’s Fielding Runs number is either positive or negative, unless it’s zero; an average fielder at any position would save zero runs. For double plays, additional credit is given beyond the putouts and assists the fielders are credited with. For first basemen, assists are counted but not putouts, which are considered to be not meaningful in most cases, resulting in the anomaly that the first baseman fielding the ball and throwing it to the pitcher covering first is rated more highly than the first baseman who fields the ball and runs to the bag himself.
James in Win Shares concurs that fielding statistics don’t easily lend themselves to the evaluation of first basemen.21 In his initial attempt to arrive at a single number for the defensive value of a player to his team, James used a complex formula. The match between James’s Win Shares defensive values and Pete Palmer’s Fielding Runs was only about 50 to 60 percent, whereas their different methods for arriving at runs created “gets essentially the same answers,” according to James, about 99 percent of the time.22
Like Range Factor, Fielding Runs does not take into account the handedness of batters or how a pitching staff’s strikeout and groundball rates affects how many opportunities a fielder gets.
A player’s Fielding Runs number is used to estimate his Fielding Wins, an estimate of the number of games a team won above or below what it would have won with an average fielder (with zero Fielding Runs) at the player’s position.
Statistics That Require the Tracking of Batted Balls Metrics
In contrast to the set of newer defensive metrics discussed up to this point are defensive metrics that involve zone charts and require the tracking of batted balls to the precise points where they land on the field. These metrics are beyond the ability of the typical fan or researcher to calculate on his own; he must simply trust the work of private data-gathering services—for the most part, STATS, LLC (formerly STATS, Inc.) and Baseball Info Solutions (BIS)—and rely on the numbers they report. Another limitation of zone-based defensive metrics is that they can’t be used for seasons before 1989. For the seasons for which they can be used, however, these metrics have proven to be more reliable indicators of a player’s fielding ability than are the box-score-based metrics. How do we know the numbers are more reliable? The numbers correlate better year to year. Many of these metrics measure very specific observations (ability to field balls to his right, ability to handle bunts, etc.). These metrics give results that conform well to our impression. They also give us insight into abilities of players who through conventional scouting methods may have been overlooked.
Tracking by Eyeballing. In the late 1970s, James proposed that the location of every batted ball be tracked for the purpose of evaluating defensive performance. From the beginning, this project involved dividing up the field into zones. Below is an example of a STATS zone chart.
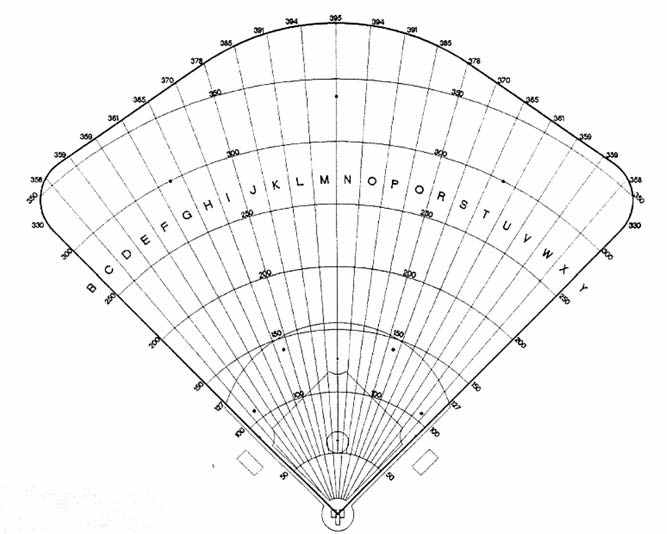
Zone Rating (ZR). In 1989, STATS, Inc., developed Zone Rating (ZR). How is ZR calculated? They divide the field into zones. Each fielder is responsible for one or more of them. Some zones, representing “gaps,” are not assigned to any defensive position. STATS “reporters” sit in the press box and, “eyeballing” the course of batted balls, record which zone every ball put into play falls into. If it falls into a zone for which the shortstop, for example, is responsible, he’s credited with an opportunity. If he makes a play on the ball, he’s credited with the opportunity plus the play. His zone rating is simply plays divided by opportunities; in this way, zone-rating numbers are numerically similar to fielding percentage.
If a fielder makes a play on a ball in a zone he’s not responsible for, he’s credited, but the form of credit varies according to the system of Zone Rating, that of STATS or that of BIS. In the original Zone Rating from STATS, players get extra credit for fielding a ball out of their zone. In Revised Zone Rating (described below), no extra credit is given for them, they’re merely tallied separately.23
Defensive Average (DA). In the 1990s, Pete DeCoursey and Sherri Nichols used play-by-play data from Project Scoresheet and The Baseball Workshop, a research company that produced baseball databases, in their development of Defensive Average. The concept is the same as that of Zone Rating. The field is divided into zones that are assigned to positions. The number of plays a given fielder makes is compared to the number of balls into the zones he’s responsible for. Some baseball analysts have found DA to be useful, but it has not been adopted across the industry to the degree that the various flavors of ZR have.
Significant differences between DA and ZR mean that a given fielder may look better in ZR than in DA or vice versa. In DA, every zone is assigned to at least one fielder—no gaps in the outfield, for example, are recognized, as they are in ZR, and every ball put into play is deemed to be at least possibly fieldable. In ZR, a ball that drops in for a hit in a zone that no fielder is considered responsible for is not counted as an opportunity for anyone, whereas in DA, if the ball is hit into the gap between short and second, for example, each infielder is charged with half an opportunity. This tends to penalize a fielder who plays next to a fielder with poor range.24
Tracking by Pixel. “But none of these [defensive metrics],” Alan Schwarz wrote back in 2004, “have gained any real currency, because they all basically derive from the same specious input: putouts, assists, and errors. To really assess the skill of a fielder, many more factors must be considered: How hard was the ball hit? Where was the fielder stationed at the moment of contact? How quickly was he able to close the gap between his glove and the ball? Would a stronger throw have beaten the runner, and how fast was the runner moving?”25
The first item, at least, in Schwarz’s list of questions is addressed with the help of Baseball Info Solutions and the availability of new kinds of data, which are used for Revised Zone Rating, Plus/Minus, Ultimate Zone Rating, and Probabilistic Model of Range (all described later). BIS tracks the direction, speed, type, and distance of every batted ball. Speeds of batted balls are classified as soft, medium, or hard. Types are classified as groundball, liner, fly ball, “fliner” (balls considered halfway between a fly ball and line drive), or bunt.26 High infield pop-ups are grouped with fly balls. After this breakdown, there are two specific splits: distance (in feet) and direction (indicated by a vector).
For direction and distance, the manner in which the batted balls are tracked by BIS video scouts is entirely different from how balls are tracked by STATS for Zone Rating. BIS video scouts do not determine which zone a batted ball falls into. Rather, they plot a hit location on a field diagram for the given ballpark. BIS software enables the video scouts to simply click on the computer image of the field to plot the hit location. This displays a one-pixel-by-one-pixel hit location where a ball lands or is fielded. In contrast to the tracking method of ZR, this method does not involve the assignation of zones to specific fielders. Video scouts’ opinions of the degree of difficulty are never considered; the video scouts simply watch game film and plot the data points. Each hit location is plotted by at least two video scouts to ensure accuracy.
Revised Zone Rating (RZR). In The Fielding Bible, John Dewan expands on the original Zone Rating system he developed at STATS, his former company. Revised Zone Rating (RZR) involves two major improvements over plain Zone Rating.
First, in RZR, the hit locations by pixel, described above, are used to plot batted balls; balls hit in specific directions and at specific distances are predetermined to fall in a player’s zone or “out of zone.” BIS video scouts plot hit locations, and then an automated code determines whether the ball landed (or was caught) in a particular RZR zone.
Second, Baseball Info Solutions, in using RZR, tallies separately the number of plays made outside a player’s zone. These are designated Plays Out of Zone, or OOZ. Revised Zone Rating is simply a percentage of the balls fielded successfully in a player’s zone; it lists Out of Zone plays separately. This is slightly different from the original Zone Rating, where balls fielded out of a player’s zone as well as in it counted toward a player’s Zone Rating.
In RZR for outfielders, different zones are used depending on batted-ball type. For example, the zone for line drives is much smaller than that for fliners or fly balls. This is an improvement on Zone Rating in that a 6-second fly ball, for example, is treated differently from a 3-second line drive or a 4.5 second fliner.
When viewed simultaneously, Plays Out of Zone (OOZ) and percentage of plays in zone (RZR) prove to be a significant measure of a player’s fielding performance, as they indicate whether a player is a standout fielder at routine plays, difficult plays, both, or neither.27
Plus/Minus. Plus/Minus, another metric that John Dewan developed using BIS data, is designed to answer the question “How many plays did this player make above or below what an average player at his position would make?”28 Adam Everett, for example, had a Plus/Minus of +33 at shortstop in 2005. That is, he made 33 more plays than the average shortstop. Conversely, in 2005, Derek Jeter had a Plus/Minus of –34, despite his Gold Gloves and his reputation for making web-gem plays.29
Plus/Minus offers more nuance than other defensive-rating systems—the harder the play that is made, the greater the credit to the fielder. Conversely, the fielder is penalized more harshly for missing a routine play than for missing a hard one. But this begs the question: What exactly is a hard play, what is an easy play, and what are the various shades of difficulty between the two ends of the spectrum? This is determined from BIS data on the direction, speed, type, and distance of every batted ball. All plotted hit locations that match these four criteria are compared to each other.
For example, each hard fliner hit 350 feet at vector 180 (the vector representing straightaway center field) is compared only to other hard fliners hit 350 feet at vector 180. So if only two out of 25 fielders caught hard fliners hit 350 feet at vector 180, those two would be rewarded significantly; the players who missed the play would be penalized, but not much. Conversely, if 23 out of 25 fielders caught hard fliners hit 350 feet at vector 180, the 23 fielders would receive a small credit to their Plus/Minus score, and the two fielders who missed the play would be penalized harshly.
Plus/Minus values are calculated purely on the fielders’ success at all exactly unique plotted hit locations. This effectively minimizes subjectivity. Credits and debits are assigned to the fielders according to the difficulty of a play made or not made.
Infielders are rated on their ability to handle balls hit straight at them and, to determine if they’re weaker or stronger on one side, they’re rated on their ability to handle balls hit to their right and then to their left. In The Fielding Bible, team defense for the thirty MLB clubs is rated in 19 different locations on the field where balls enter play.30
Defensive Runs Saved. In The Fielding Bible, Volume II, John Dewan takes the defensive metrics in the first volume and translates them into runs—into runs saved, that is, or Defensive Runs Saved.31 They’re the mirror image of Runs Created, the metric Bill James developed to estimate how many runs that are scored a hitter can be credited for.
The most important ingredient in Defensive Runs Saved is the Plus/Minus system. A fielder’s Plus/Minus number reflects how often a play is made for a batted ball with a given trajectory and hit location. For the outfielders and corner infielders, it is adjusted to reflect the number of bases saved (on plays that could be or were extra base hits)—the result is an Enhanced Plus/Minus number. A constant multiplier is applied for all players at a given position, but it varies by position. At the high end are the infielders and the pitcher. Each one saves .73 to .76 runs per Plus/Minus point. At the low end are the three outfielders, whose numbers are .56 to .58. For second basemen, shortstops, and pitchers, their positional value is multiplied by their Plus/Minus, and the result is their Plus/Minus Runs Saved. For outfielders and corner infielders, their Plus/Minus Runs Saved number is calculated by taking their positional value and multiplying that by their Enhanced Plus/Minus. Plus/Minus Runs Saved is the largest component of Defensive Runs Saved for all positions except catcher.
DEFENSIVE MISPLAYS AND GOOD FIELDING PLAYS
The category Defensive Misplays was introduced in The Fielding Bible, Volume II.32 The official scorer’s decision to charge a fielder with an error is broadly based on his judgment that the play could have been made with ordinary effort, whereas the decision to charge a fielder with a Defensive Misplay is based on a long list of criteria—54 of them—that are spelled out with some specificity. Here are some examples:
- Outfielder fails to anticipate the wall when making a catch.
- Infielder makes a poor throw.
- Infielder lets the ball roll under his glove.
- Players attempt to catch a fly ball or popup and it drops between them.
- Outfielder takes a bad route to a ball.
- Outfielder misses the cutoff man, allowing the runner to advance.
Conversely, fielders are credited for plays they’re not expected to make. These are appropriately named Good Fielding Plays. There are 27 criteria. Some examples:
- Outfielder steals a home run from a batter.
- Catcher picks off a runner.
- Fielder holds a runner to a single on a ball that was a likely double or a triple.
- First baseman handles a difficult throw.
- Middle infielder turns a double play despite an aggressive slide by the baserunner.
Both the Defensive Misplays and Good Fielding Plays can be tracked per Touch. A Touch is counted if a fielder touches the ball with his hand or his glove at any point during a play or if he is the first fielder to handle a ball that falls in for a hit. He can’t get more than one Touch per play.33
First Base and Third Base
The main ingredients in the Defensive Runs for first and third baseman are Plus/Minus Runs Saved and runs saved on bunts.34 The Plus/Minus numbers for the infielders at the corners are adjusted to create an Enhanced Plus/Minus, which reflects the value of bases saved on balls hit down the line. (Some of those balls would have turned into doubles.)35 From 2003 through 2008, Albert Pujols and Mark Teixeira had the best Enhanced Plus/ Minus at first; Mike Jacobs and Richie Sexson had the worst. Adrian Beltre and Scott Rolen led among third basemen.36
Second Base and Shortstop
For middle infielders, the main ingredients are Plus/Minus Runs Saved and runs saved on double plays.37 Double plays and double-play opportunities are tracked, as are pivots and pivot opportunities, where, for example, the second baseman would get credit for a pivot in a 6-4-3 or 5-4-3 double play.38 At shortstop, Adam Everett is the leader in Runs Saved from 2006 through 2008 by a wide margin, 48 to Jimmy Rollins’s 33; Derek Jeter has the lowest Runs Saved, –50. Chase Utley and Mark Ellis lead among second basemen for this period, and Jeff Kent ranks last.39
Outfielders
For outfielders, Defensive Runs involve three main metrics—Plus/Minus Runs Saved, runs saved by the outfielder’s arm, and runs saved by robbing hitters of home runs. For Plus/ Minus Runs Saved, the Enhanced Plus/Minus version is used, because outfielders can take a hit that would have been a double and keep it to a single. Rather than just account for the number of plays made, the Enhanced Plus/ Minus number indicates the number of bases saved.40 In The Fielding Bible, Volume II, separate Plus/Minus values are given for the three categories of distance (shallow, medium, deep).41
Also factored into the formula for Defensive Runs for outfielders is opposition baserunning. The number of bases that runners advance when an outfielder gets the ball is tracked, as it’s a good measurement of how intimidated (if at all) runners are by an outfielder’s arm.
Outfielders are rated on how often runners advance, stay put, or are thrown out in extra-base advancement situations. Baserunner kills are a more direct measurement of an outfielder’s arm than are assists, which include relay throws to an infielder whose own throw may have had more to do with the eventual putout than did the outfielder’s relay.42
Pitchers
Defensive Runs for pitchers is a measurement, of course, of the runs they save with their glove, not with their arm, except when they throw to a base after a ball is hit into play. Because of the location of the mound, the calculation of Plus/Minus for pitchers is similar to that of Plus/Minus for the middle infielders.
The running game does not show up in Plus/Minus Runs Saved, which is combined with Stolen Bases Runs Saved to yield his Defensive Runs. The caught-stealing percentage is tracked for pitchers as it is for catchers. The pitcher’s ability to curb the running game has been shown to impact the running game more than the catcher’s ability to do the same. Attempted steals, caught stealing, and pickoffs factor into a pitcher’s Stolen Bases Runs Saved. Kenny Rogers led major-league pitchers in Defensive Runs in the period 2006–8, when he had 27.43
Catchers
Catchers do not have any Plus/Minus value; their Defensive Runs Saved consists of Stolen Bases Runs Saved and Adjusted Earned Runs Saved. We start with Stolen Bases Saved. How many does a catcher have? From his caught-stealing total, pitcher pickoffs are subtracted. Let’s say the official record is that in 100 attempts the catcher has been credited with throwing out 40 runners but that in ten cases the runner was caught by the pitcher initiating the throw to one of the bases to pick the runner off. That leaves the catcher throwing out 30 runners in 90 attempts.
Each Stolen Base Saved is worth .62 Defensive Runs for Stolen Bases Runs Saved. In The Fielding Bible, Volume II, Dewan also calculates Adjusted Earned Runs Saved. Based on Catcher ERA, Dewan takes the ERA of each catcher with each pitcher and compares that to the ERA of other catchers who caught the same pitchers that year. After adjusting for home ballparks, Dewan applies a “credibility factor,” which, in essence, regresses the total to account for the volume of noise remaining in the data.44
Total Runs
Total Runs is a comprehensive metric based on a variety of other metrics and used to compare position players for their overall contribution in all aspects of the game. (Total Runs does not apply to pitchers.)
Total Runs consists of four components:
- Runs Created
- Baserunning Runs
- Defensive Runs Saved
- A positional adjustment that allows for comparison among different positions (more weight is given to playing the more difficult defensive positions)
Runs Created is an estimation of how many runs a player generates on offense with his bat and basestealing ability. Baserunning Runs, an estimation of how many runs a player generates through extra-base advancements on batted balls (it does not include basestealing).
What is the positional adjustment? It is well known that some positions are widely considered offensive positions or defensive positions. In The Fielding Bible, Volume II, Bill James assumes that 72 percent of Runs Saved are by pitchers and 28 percent by fielders (other than pitchers). He uses the average Runs Created (RC) values for 2005–7 at each of the eight positions (DHs and pitchers are excluded). First base has the highest average RC value, 99, and catcher has the lowest, 70. James also assumes that all positions contribute equally to a baseball game—that the players who contribute more offensively contribute less defensively, and vice versa. So James sets the Runs Saved value of each position equal to a value such that the sum of Runs Created and Runs Saved is equal for each position. After making some minor adjustments for the value of different outs, catchers have the highest Runs Saved component (42), with shortstops (36) and second basemen (32) not far behind. First basemen have the lowest (13), and left field (19) and right field (20) are not much higher.
To determine the weight given to each position, the Runs Saved number is then multiplied by the percentage of possible innings played at that position. For an example, consider John Dewan’s discussion of Chase Utley in The Fielding Bible, Volume II. Dewan explains: “Chase Utley played 96.7 percent of a full season of innings at second base and 0.97 percent at first. Applying the Positional Averages, we get .967*32 + .0097*13 = 30.9 + 0.1 = 31.”
In 2008, Chase Utley of the Philadelphia Phillies led MLB with 192 Total Runs, reflecting not only his good hitting but also his 34 Defensive Runs Saved and his high percentage of innings played at second base. Apparently most of the baseball writers voting on the NL MVP that year didn’t recognize the strength of Utley’s season—he finished only fourteenth in the voting. Utley’s teammate Ryan Howard finished second to Albert Pujols (a worthy choice, as his 171 Total Runs were the highest in MLB after Utley’s 192). But Howard ranked only fiftieth in the major leagues in Total Runs; in fact, three teammates, Utley, Jimmy Rollins, and Shane Victorino, all had more Total Runs than Howard did.45
Ultimate Zone Rating (UZR). While at STATS, Dewan began plans to improve on Zone Rating, introducing what he called Ultimate Zone Rating in STATS 2001 Baseball Scoreboard.46 Soon thereafter, Dewan left STATS and eventually developed Revised Zone Rating, Plus/Minus, and Defensive Runs Saved.
Meanwhile, Mitchel Lichtman independently began efforts of his own to improve on the basic Zone Rating metric. Lichtman’s creation, Ultimate Zone Rating (UZR), was introduced in 2003 in a series of primers on the Baseball Think Factory website.
Mitchel Lichtman took Zone Rating one step further, using a different approach from that in The Fielding Bible. UZR is a measure of the actual number of runs a player saves because of his defense. Like Defensive Runs Saved, UZR is relative to the league average for a player at a given position. And, as with Defensive Runs Saved, the data for UZR is based on video replays available from Baseball Info Solutions (BIS). And UZR is like Defensive Runs Saved in that it’s based on locations of batted balls and not on an observer’s judgment whether a fielder should be able to reach a ball in a given zone.
UZR enables clubs to compare, for any given player, his runs created and his runs prevented. The data collection is imperfect, as Lichtman explains:
First and third base get less than half the opportunities of second base and shortstop. But after a year, most positions get regressed somewhere around 50 percent, so we treat a +10 for a season worth of data as a +5, for example. There is no magic number for the amount of data on a player to be reliable, but after, say, three years, I consider a player’s UZR to be pretty darn reliable. Of course, there are still going to be a small percentage of players that UZR gets “wrong” after three years or even after ten years for that matter. It is just that, the larger the sample, the less the percentage of plays that UZR get wrong.47
For example, in 2009, Franklin Gutierrez generated about four more runs (wRAA from Fangraphs.com) than did the average hitter. He ranked eighteenth among center fielders. Franklin had a UZR value of 29, indicating that, in theory, he saved 29 runs.48 It was by far the league’s best for center fielders and probably can’t be sustained on an annual basis. When his offensive and defensive numbers are combined, he actually becomes the most valuable center fielder in the game last season.
Probabilistic Model of Range. David Pinto of Baseballmusings.com further expanded on Lichtman’s UZR with the BIS data and developed the Probabilistic Model of Range (PMR).49 On his website, he provides breakouts and individual graphs showing specifically where a player fields balls relative to the average player at his position. For example, the graph for second basemen would show how good a second baseman is at fielding balls relative to the second-base bag and also relative to the average major-league second baseman.
PMR adjusts for the direction of the hit, the type of hit, the speed of the batted ball, pitcher handedness, batter handedness, and park factors. All these items are taken into account to arrive at the probability that a batted ball will become an out. From that probability, a value for expected outs is obtained. What makes PMR different from the other metrics is that it builds on team DER, as an expected team DER is calculated and compared to a team’s actual DER. This provides insight into to how much a team’s defense is helping its pitching staff turn batted balls into outs.50
Total Zone
The biggest problem with both the box-score category of metrics and the zone/tracking category of metrics is that they’re not useful for comparing contemporary and more-recent players to players before 1989. The box-score metrics are available back to 1876, but they’re a less precise measure of defensive performance than the zone-based metrics are. The zone-based metrics are more precise, but they don’t exist for seasons before 1989. Between this rock and a hard place there is, however, a defensive metric that can be used to compared the defensive performance of players across the centuries. Welcome to Total Zone.
Total Zone Total Fielding Runs. Sean Smith of BaseballProjection.com developed Total Zone Total Fielding Runs, which is “the number of runs above or below average the player was worth based on the number of plays made.”51 At Baseball-Reference.com, Total Zone Total Fielding Runs is regarded as the best all-inclusive defensive statistic for historical data and more recent data alike. Smith uses different methods to analyze defense depending on the data available.
Limited Play-by-Play Data Available. Data are generally available for determining who made an out in the field. For seasons before 2003, however, data on where balls landed does not exist, and the information is roughly estimated, resulting in a fraction of each hit being assigned to each position player. Smith explains: “Without information on the hits, I have to make an estimate. I look at each batter’s career rates of outs by position. For example, if 30% of a batter’s outs are hit to shortstop, then every time that batter gets a hit the shortstop is charged 0.3 hits. Repeat for every position.”52
Adjustments are made for pitcher handedness. Fractional hits, plays made, and errors are added together to get a Total Zone rating. If there are no play-by-play data (before 1956), the values are similar to an Adjusted Range Factor or a Relative Range Factor.
Extensive Play-by-Play Data Available. In 2003, Retrosheet began recording more-specific play-by-play data. As with Baseball Info Solutions data, hits are classified by batted-ball type (groundballs, flies, line drives, popups), and the fielder who made the out or attempted to make it specified. The data also reflect pitcher handedness and when a runner on first must be held.
A raw Total Zone value is park-adjusted and converted to a value, positive or negative. As with Plus/Minus, the player evaluated by Total Zone is compared to the average player at his position in his league. Since the Total Zone rating is simply a measure of fielding range, additional components must be added, depending on the position. Outfielders get a separate score for their throwing arms. Infielders are scored for their ability to turn double plays, and catchers for their success at controlling the running game and prevent passed balls and wild pitches. The sum of these values produces the Total Zone Total Fielding Runs Above Average, which is similar to Runs Saved in The Fielding Bible.
Some players who have won Gold Gloves and have a reputation for good defense do have high ratings in Total Zone for their career: 1B Keith Hernandez, 2B Frank White and Bill Mazeroski, SS Mark Belanger and Ozzie Smith, 3B Brooks Robinson, LF Carl Yastrzemski, CF Willie Mays, and RF Roberto Clemente. And some players with a reputation for bad defense have some of the worst Total Zone ratings at their defensive positions: 1B Mo Vaughn, 2B Juan Samuel, SS Derek Jeter, 3B Dean Palmer, LF Pat Burrell and Adam Dunn, and RF Danny Tartabull.53
Of all the advanced defensive metrics, only Total Zone has been consistently recorded for minor leaguers, since 2005. Sean Forman at Baseball-Reference.com has begun to update Total Zone for major leaguers daily during the season.54
LIMITATIONS
The data available for new players to the major leagues are limited. They come to the major leagues with a track record, in high school, college, and the minors, full of offensive data, on-base percentage and the like, but for the most part the sabermetric statistical information that a club will have on how many runs they save defensively is limited to Total Zone numbers from the minors since 2005.
Defensive Runs Saved, UZR, and Total Zone have begun to be updated regularly during the season. Their significance over a small number of games is still uncertain and may not be great. A player who gets ten hits in 25 at-bats is having a better week than the one who goes 5-for-25. But is a player who scores +5 in Plus/Minus in the course of a single week really having a better defensive week than the player who scores –5? At this point, it’s hard to say. We do know that, like most statistics, Defensive Runs Saved, UZR, and Total Zone give a more accurate picture of player performance over the course of an entire season or, better, multiple consecutive seasons.55
Another major limitation of advanced defensive metrics is their inaccessibility to the general public, or average fan, and in some cases even to decision makers in front offices. Sitting and watching or scoring a game, any casual fan can deduce that a batter who gets 1 hit in 4 at-bats in a game is batting .250 for the game. However, the average fan attending a game can’t do the equivalent with advanced fielding statistics. If the ball goes between the first baseman and second baseman for a hit, does this count as a missed opportunity for the first baseman, the second baseman, both, or neither? If it’s considered a miss, how significant is the miss? A casual fan (or even the fan who understands sabermetrics, for that matter) would not be able to figure this out simply from watching a live game. After the average fan leaves the ballpark at the end of the game, he wouldn’t be able to say for certain whether a player’s UZR increased or decreased as he would know, for example, if the batting average of a player who got one hit in four at-bats rose or fell.
Clubs rely on their scouting and data-collection agencies to help fill voids that statistics cannot measure and to verify that the statistics are truly showing us the best fielders. One fan-generated scouting source on defensive performance is the Fan Scouting Report collected by Tom Tango. Fans who have seen players in person vote on those players’ abilities.56 It’s a reasonable way to double-check a player’s defensive ability as indicated by the metrics. Steve Sommers has actually gone as far as combining both UZR numbers and the Fan Scout Report to come up with a combined value.57
Even the statisticians and analysts who develop and work with the advanced defensive metrics are constantly referring back to the empirical evidence, what they see a fielder do, as well as to his reputation (how many Gold Gloves has he won?), to check the reliability of their statistical analysis. (See “Fielding Bible Awards: An Alternative to the Gold Glove” below.)
FRONT OFFICES USE DEFENSIVE METRICS—OR DON’T USE THEM
Clubs that are using these or similar defensive metrics have good reason not to divulge the details of their search for undervalued fielding talent, but, at least around the edges of this discussion, a few are fairly forthcoming. Jack Zduriencik, the Mariners’ general manager, is one of them. He was studying the defensive numbers available at FanGraphs and Hardball Times when the line for Franklin Gutierrez jumped out at him.58 Gutierrez’s exceptional range couldn’t be fully leveraged at Progressive Field, which has one of the smallest outfields in MLB. Safeco Field has one of the biggest. Zduriencik traded for Gutierrez after the 2008 season, as part of his larger plan to tighten Seattle’s defense. The Mariners, ranked twentieth in MLB in UZR (–1) in 2008, led all of MLB in that category (+85) in 2009. Their record in 2008 was dismal—they won all of 61 games. In 2009 they won 87, scoring 31 fewer runs than the year before, but the runs they allowed were 119 fewer.
The Red Sox are another club not shy about admitting their attention to statistical analysis. That they’ve been paying special attention to defensive stats is suggested by their offseason acquisition of outfielder Mike Cameron and infielders Adrian Beltre and Marco Scutaro and by the departure of Jason Bay, a defensive liability in the outfield.
“What I’m most curious about in 2010 is how much better we’re going to be defensively,’’ Bill James, who works as special advisor on baseball operations for the Red Sox, said earlier this year, during the offseason. “I don’t think anyone questions that we’re going to have a better defensive team. But are we going to be as much better defensively as we want to believe we are, and is that going to have as much impact on [the pitching staff] as we hope it does?’’(For more on how good defense helps pitching, see “The Hidden Value of Glovework” by Vince Gennaro in this issue.)59
Mitchel Lichtman, who worked for the Cardinals for a few years, 2004 through 2006, says they used UZR back then. He guesses that, in some form or other, it’s still a part of their statistical-analysis toolkit.60 The Tigers, Rays, and Yankees have all been rumored to use defensive stats.
Other clubs let out that they value defense but not necessarily the state-of-the-art statistical instruments for measuring it. On several occasions Royals general manager Dayton Moore has indicated that, when it comes to evaluating defense, he trusts his scouts more than he trusts the numbers. “The defensive statistics,” he said, “I still really don’t understand how some of those statistics are evaluated, I really don’t. When you watch baseball games every single day, it’s very apparent who can play defensively and who can’t.”61
Cubs general manager Jim Hendry agrees. David Laurila of Baseball Prospectus asked him whether “ defensive metrics [are] an important part of your evaluation process or do you rely primarily on scouting?” Hendry replied: “It’s scouting for me. People scout players and they rate their defense, and that’s what I go by—and the personnel that we have in our own dugout.”62
Just as a front office’s attentiveness to the statistical analysis of defense doesn’t guarantee success (the Mariners, for example, have gotten off to a woeful start this year), neither does willful neglect of it necessarily mean a team is doomed to flail around near the bottom of the standings. The Phillies have won the National League pennant the past two years and, despite having great defensive statistics on a team and individual level, apparently have not crunched those numbers much. “I think defensive statistics are the most unpredictable stats out there,” said Charley Kerfeld, special assistant to Phillies general manager Ruben Amaro Jr. “Since I’ve been here, we don’t have an in-house stats guy and I kind of feel we never will.”63
Will any of the high-end defensive metrics ever be embraced by the average fan, for whom quantification of defense means mostly that he looks at errors and occasionally casts a skeptical glance at fielding percentage? The metrics that are available now and that we outlined above may prove useful for evaluating players in a career context or, depending on the metric, over a shorter span, one to three seasons. For the metrics to be routinely tracked and updated on a daily basis for the benefit of the general public, however, the conventions of scorekeeping would have to undergo radical revision. A hit would have to be recorded not only as a hit for the batter and against the pitcher but also as a missed opportunity for the fielder(s).
So it’s unlikely that UZR and its kin will start appearing on scoreboards alongside batting average, home runs, and RBIs any time soon. As for the resistance from some front offices, are they allergic to innovation, or is it that they have a healthy aversion to busyness? About that you can be the judge. Some of us are wired such that we find maps helpful, and some of us not so much. In any case, the maps that the sabermetric effort to quantify defense gives us may never be as subtly delineated as the four-dimensional terrain they represent. The trick is to know not only how to read the maps for what they are, a set of honest if not infallible data points, but how to read them with one eye while keeping the other one on the ball in flight as Franklin Gutierrez takes off to run it down.
DAN BASCO is a graduate student and teaching assistant in the statistics department at the University of Akron.
JEFF ZIMMERMAN writes for FanGraphs, Royals Review, and Beyond the Boxscore.
FIELDING BIBLE AWARDS: AN ALTERNATIVE TO THE GOLD GLOVE
Since 2006, a committee of baseball experts and close observers have been voting for the best player at each position for that season. This is The Fielding Bible Award. Voters have included Bill James, Peter Gammons, Rob Neyer, Hal Richman (of Strat-O-Matic), and fans who vote in a poll conducted by Tom Tango. Many voters have a strong statistical background; others do not. All voting is based on a combination of defensive statistics and visual observation. The ballot is similar to that of the MVP selection: Ten players receive votes; the player who gets the first-place vote gets 10 points, second place is good for 9, and so on. In contrast to the rules governing voting for the Gold Glove Award, the list of eligible players is restricted to players who played a minimum number of innings at a given position. One player at each position receives the award. There is not a separate award to the best in the AL and the best in the NL—it’s only for the best in all of MLB. The three outfield positions are assessed separately. Also in contrast to the Gold Glove Awards, The Fielding Bible Awards are accompanied by publication of the results of the voting—they appear annually in The Bill James Handbook—and so we can see who came close (or not so close) to winning.64 Here is a list of the winners.65
|
|
2006 |
2007 |
2008 |
2009 |
|
C |
Ivan Rodriguez |
Yadier Molina |
Yadier Molina |
Yadier Molina |
|
P |
Greg Maddux |
Johan Santana |
Kenny Rogers |
Mark Buehrle |
|
1B |
Albert Pujols |
Albert Pujols |
Albert Pujols |
Albert Pujols |
|
2B |
Orlando Hudson |
Aaron Hill |
Brandon Phillips |
Aaron Hill |
|
3B |
Adrian Beltre |
Pedro Feliz |
Adrian Beltre |
Ryan Zimmerman |
|
SS |
Adam Everett |
Troy Tulowitzki |
Jimmy Rollins |
Jack Wilson |
|
LF |
Carl Crawford |
Eric Byrnes |
Carl Crawford |
Carl Crawford |
|
CF |
Carlos Beltran |
Andruw Jones |
Carlos Beltran |
Franklin Gutierrez |
|
RF |
Ichiro Suzuki |
Alex Rios |
Franklin Gutierrez |
Ichiro Suzuki |
Notes
1 Doug Glanville, The Game from Where I Stand: A Ballplayer’s Inside View (New York: Times Books, 2010), 24.
2 Peter Abraham, “Calling James’s Number: Stat Guru Senses New Defensive Focus,” Boston Globe, 15 January 2010.
3 Albert Chen, “Feel the Glove,” Sports Illustrated, 1 March 2010.
4 Peter Abraham, “Calling James’s Number: Stat Guru Senses New Defensive Focus,” Boston Globe, 15 January 2010.
5 Alan Schwarz, The Numbers Game: Baseball’s Lifelong Fascination with Statistics (New York: Thomas Dunne Books, 2004), 9.
6 Schwarz, 10.
7 Total Baseball: The Official Encyclopedia of Major League Baseball, ed. John Thorn, Pete Palmer, and Michael Gershman, with Matthew Silverman, Sean Lahman, and Greg Spira, 7th ed. (Kingston: Total Sports, 2001), 519.
8 William F. Kirk, “Strolls Through Sportsville,” New York Evening Journal. March 9, 1917.
9 Bill James, interview with C. Trent Rosecrans, “Talking with Bill James: Part 1,” March 19, 2010, Cincinnati Sports Journalism, cnati.com.
10 Hugh Fullerton, “Defensive Strength Complicated,” New York Evening Mail, October 23, 1921.
11 John Thorn, Pete Palmer, and Michael Gershman, eds., Total Baseball, 7th ed. (Kingston, N.Y.: Total Sports, 2001), 536.
12 Stephen Day, “Deconstructing the Midas Touch: Gold Glove Award Voting, 1965–2004,” January 1, 2005, Allbusiness.com.
13 John Dewan, The Fielding Bible (Skokie: ACTA Sports, 2006), 149.
14 Day, “Deconstructing the Midas Touch.”
15 Dewan, 199.
16 Dewan, 199–209.
17 Tom Tippett, “Evaluating Defense,” 5 December 2002, DiamondMind.com.
18 Scott Gray, The Mind of Bill James: How a Complete Outsider Changed Baseball (New York: Doubleday, 2006), 36.
19 Albert Chen, “Feel the Glove,” Sports Illustrated, 1 March 2010
20 Total Baseball, 7th ed., 2494.
21 Bill James and Jim Henzler, Win Shares (Morton Grove: STATS Publishing, 2002). 80–85.
22 Dewan, 199.
23 Tom Tippett, “Evaluating Defense”; Chris Dial, “What Is Zone Rating?” November 5, 2005, Baseball Think Factory; Colin Wyers, “Introducing WAR for Hitters,” May 10, 2008, Goatriders of the Apocalypse (www.goatriders.org).
24 Tom Tippett, “Evaluating Defense.”
25 Schwarz, 240.
26 Dewan, 1.
27 Dewan, 227–28.
28 Dewan, 1.
29 Dewan, 168.
30 Dewan, 39.
31 John Dewan, The Fielding Bible, Volume II (Skokie, Ill.: ACTA Sports, 2009), 11–4.
32 Dewan, The Fielding Bible II, 27–29.
33 Dewan, The Fielding Bible II, 33.
34 Dewan, The Fielding Bible II, 11-13.
35 Dewan, The Fielding Bible II, 11.
36 Dewan, The Fielding Bible II, 86.
37 Dewan, The Fielding Bible II, 11-13.
38 Dewan, The Fielding Bible II, 217.
39 Dewan, The Fielding Bible II, 86.
40 Dewan, The Fielding Bible II, 11-13.
41 Dewan, The Fielding Bible II, 161-65.
42 Dewan, The Fielding Bible II, 375-76.
43 Dewan, The Fielding Bible II, 63-67.
44 Dewan, The Fielding Bible II, 75-82.
45 Dewan, The Fielding Bible II, 385-94.
46 Don Zminda, Tony Nistler, and STATS, Inc, STATS 2001 Baseball Scoreboard., 10th ed. (Morton Grove, Ill.: STATS Publishing, March 2001).
47 Mitchel Lichtman, interview with Jeff Zimmerman, March 25, 2010.
48 Major League Leaderboards, 2009, All Positions, Fielding Statistics | FanGraphs Baseball (Fangraphs.com).
49 Probabilistic Model of Range Archives (last updated December 9, 2009), Baseballmusings.com.
50 Doug Miller, “Four New Defensive Stats Explained,” January 11, 2010, MLB.mlb.com.
51 Sean Smith, “Total Zone Defense on Baseball Reference,” May 5, 2008, HardballTimes.com.
52 “Total Zone Data,” Baseball-Reference.com / About / Total Zone.
53 Sean Smith, “Measuring Defense for Players Back to 1956,” March 25, 2008, HardballTimes.com.
54 Sean Smith, “Total Zone Defense on Baseball Reference.”
55 “John Dewan (and Research Assistant) Speak!” July 20, 2009, The Book: Playing the Percentages in Baseball (www.insidethebook.com).
57 Steve Somer, “Defensive Projections, Take 2,” Play a Hard Nine, November 21, 2009, http://playahardnine.wordpress.com.
58 Albert Chen, “Feel the Glove,” Sports Illustrated, March 1, 2010.
59 Peter Abraham, “Calling James’s Number: Stat Guru Senses New Defensive Focus,” Boston Globe, January 15, 2010.
60 Mitchel Lichtman, interview with Jeff Zimmerman, March 25, 2010.
61 Dayton Moore, July 13, 2009 interview on AM 810 WHB, Kansas City, www.royalsreview.com/2009/7/13/947719/the-defensive-statistics-i-still.
62 Jim Hendry, interview with David Laurila, Prospectus Q&A, July 12, 2009 BaseballProspectus.com.
63 Doug Miller, “New Defensive Stats Starting to Catch On,” January 11, 2010, MLB.mlb.com.
64 Baseball Info Solutions and Bill James, The Bill James Handbook 2010. (Skokie: ACTA Sports, 2006), 15–16
65 Fielding Bible, www.fieldingbible.com.