

The Single’s Slow Fade: The Diminishing Role of the Single Since the Deadball Era
This article was written by James Musso
This article was published in Fall 2024 Baseball Research Journal
Major League Baseball implemented a package of rule changes for the 2023 season designed to address complaints that the game had become tedious to watch.1 Those complaints centered on pace of play and lack of action, with fans and media noting fewer balls in play and stolen bases and more strikeouts and home runs.2 Some underlying reasons for these developments have been identified as ballparks that encourage slugging; an increase in the number of pitchers used during a game; the increased use of defensive shifts; and players’ widespread participation in offseason training programs that emphasize higher launch angles for hitters and higher velocity and spin rates for pitchers.3
As a result of the new rules, the average length of a game was reduced by 24 minutes to 2:42—a level last attained in 1985—and 2:39 if only counting nine-inning games. The number of stolen bases was the highest since 1987, and the league batting average for left-handed hitters rose 11 points to .247.4 Beyond that, the evidence of progress is murky, especially with regard to the level of action on the field (strikeouts remain very high).
Many observers, including MLB itself, believe the game has yet to be played in a way that achieves its potential as a pastime rooted in the American psyche.5 Each time a batter steps into the box, this pastime, at its best, tells an engaging tale about a man, first fighting off projectiles with only a wooden club, then embarking on an exciting journey down treacherous basepaths, all in the hope that he will overcome whatever obstacles block his way and finally return home. What would such a game look like?
It would display a variety of skills, each of which would be necessary, in varying degrees, to win.6 There would be contact hitters who excelled at advancing baserunners. There would be fast singles and triples hitters who could beat out grounders, take the extra base, and hit for average. There would be agile and athletic players capable of making great defensive plays. And yes, there would be some slow-footed, muscle-bound sluggers, too. There would be oversized power pitchers, of course, but they would be complemented by junkballers and control specialists capable of pitching more than five innings.
All of this is, of course, an ideal, an aspiration that will never be fulfilled. But we need to know if we’re headed in the right direction. We need to know how close we are. There’s always the eye test, of course, based on the belief that fans will know it when they see it. But the eye test isn’t as reliable when one is looking for something that hasn’t been seen much over the course of history. This paper proposes the use of a simple metric, the singles proportion, as an effective tool for understanding how the game of baseball is being played today and, indeed, how the game was being played at any particular point in its history.7 The Live Ball Era was baseball’s most transformative period of the twentieth century. This paper concludes that the period beginning in 2016 and continuing through the 2023 season may turn out to be just as transformative, but in a way that takes us further from our ideal, unless Major League Baseball can reverse the tide.8
1. THE SINGLES PROPORTION
1.1 Definition and Uses
Few observers of Major League Baseball think about singles, at least not much, not anymore. One reason for this is the single’s diminishing role in the game. We can measure this by looking at singles as a proportion of on-base events (hits, walks, and hit-by-pitches) in the American and National Leagues over the course of the leagues’ existence.9 This singles proportion (or singles prop for short) tells us more about how runs were scored in a given time frame than about how many runs were scored. It tells us something about the importance of singles relative to other on-base events.10 When we look at it over the course of many years, it can even be a useful and interesting way to divide the history of major-league baseball into distinct eras. (See section 2.)
1.2 Behavior Over Time
For our purposes, it is enough for now to simply show the decline of the single since 1919, the end of the Deadball Era, when, on average, significantly fewer balls were used per game, compared to the 120 or so balls per game today. The baseballs were often soft from overuse, disfigured by scuff marks, and dark with dirt, tobacco juice, spit, and myriad other foreign substances. Thus, pitches were difficult to see and moved in unpredictable ways toward home plate. When a pitch was hit, the ball didn’t travel as far.11 Teams scraped for runs by bunting, executing the hit-and-run, and stealing bases. This small-ball style of play produced a meager 3.92 runs per game between 1901 and 1919. And singles were a whopping 58% of all on-base events. Singles would never again be as prominent as they were in the Deadball Era.
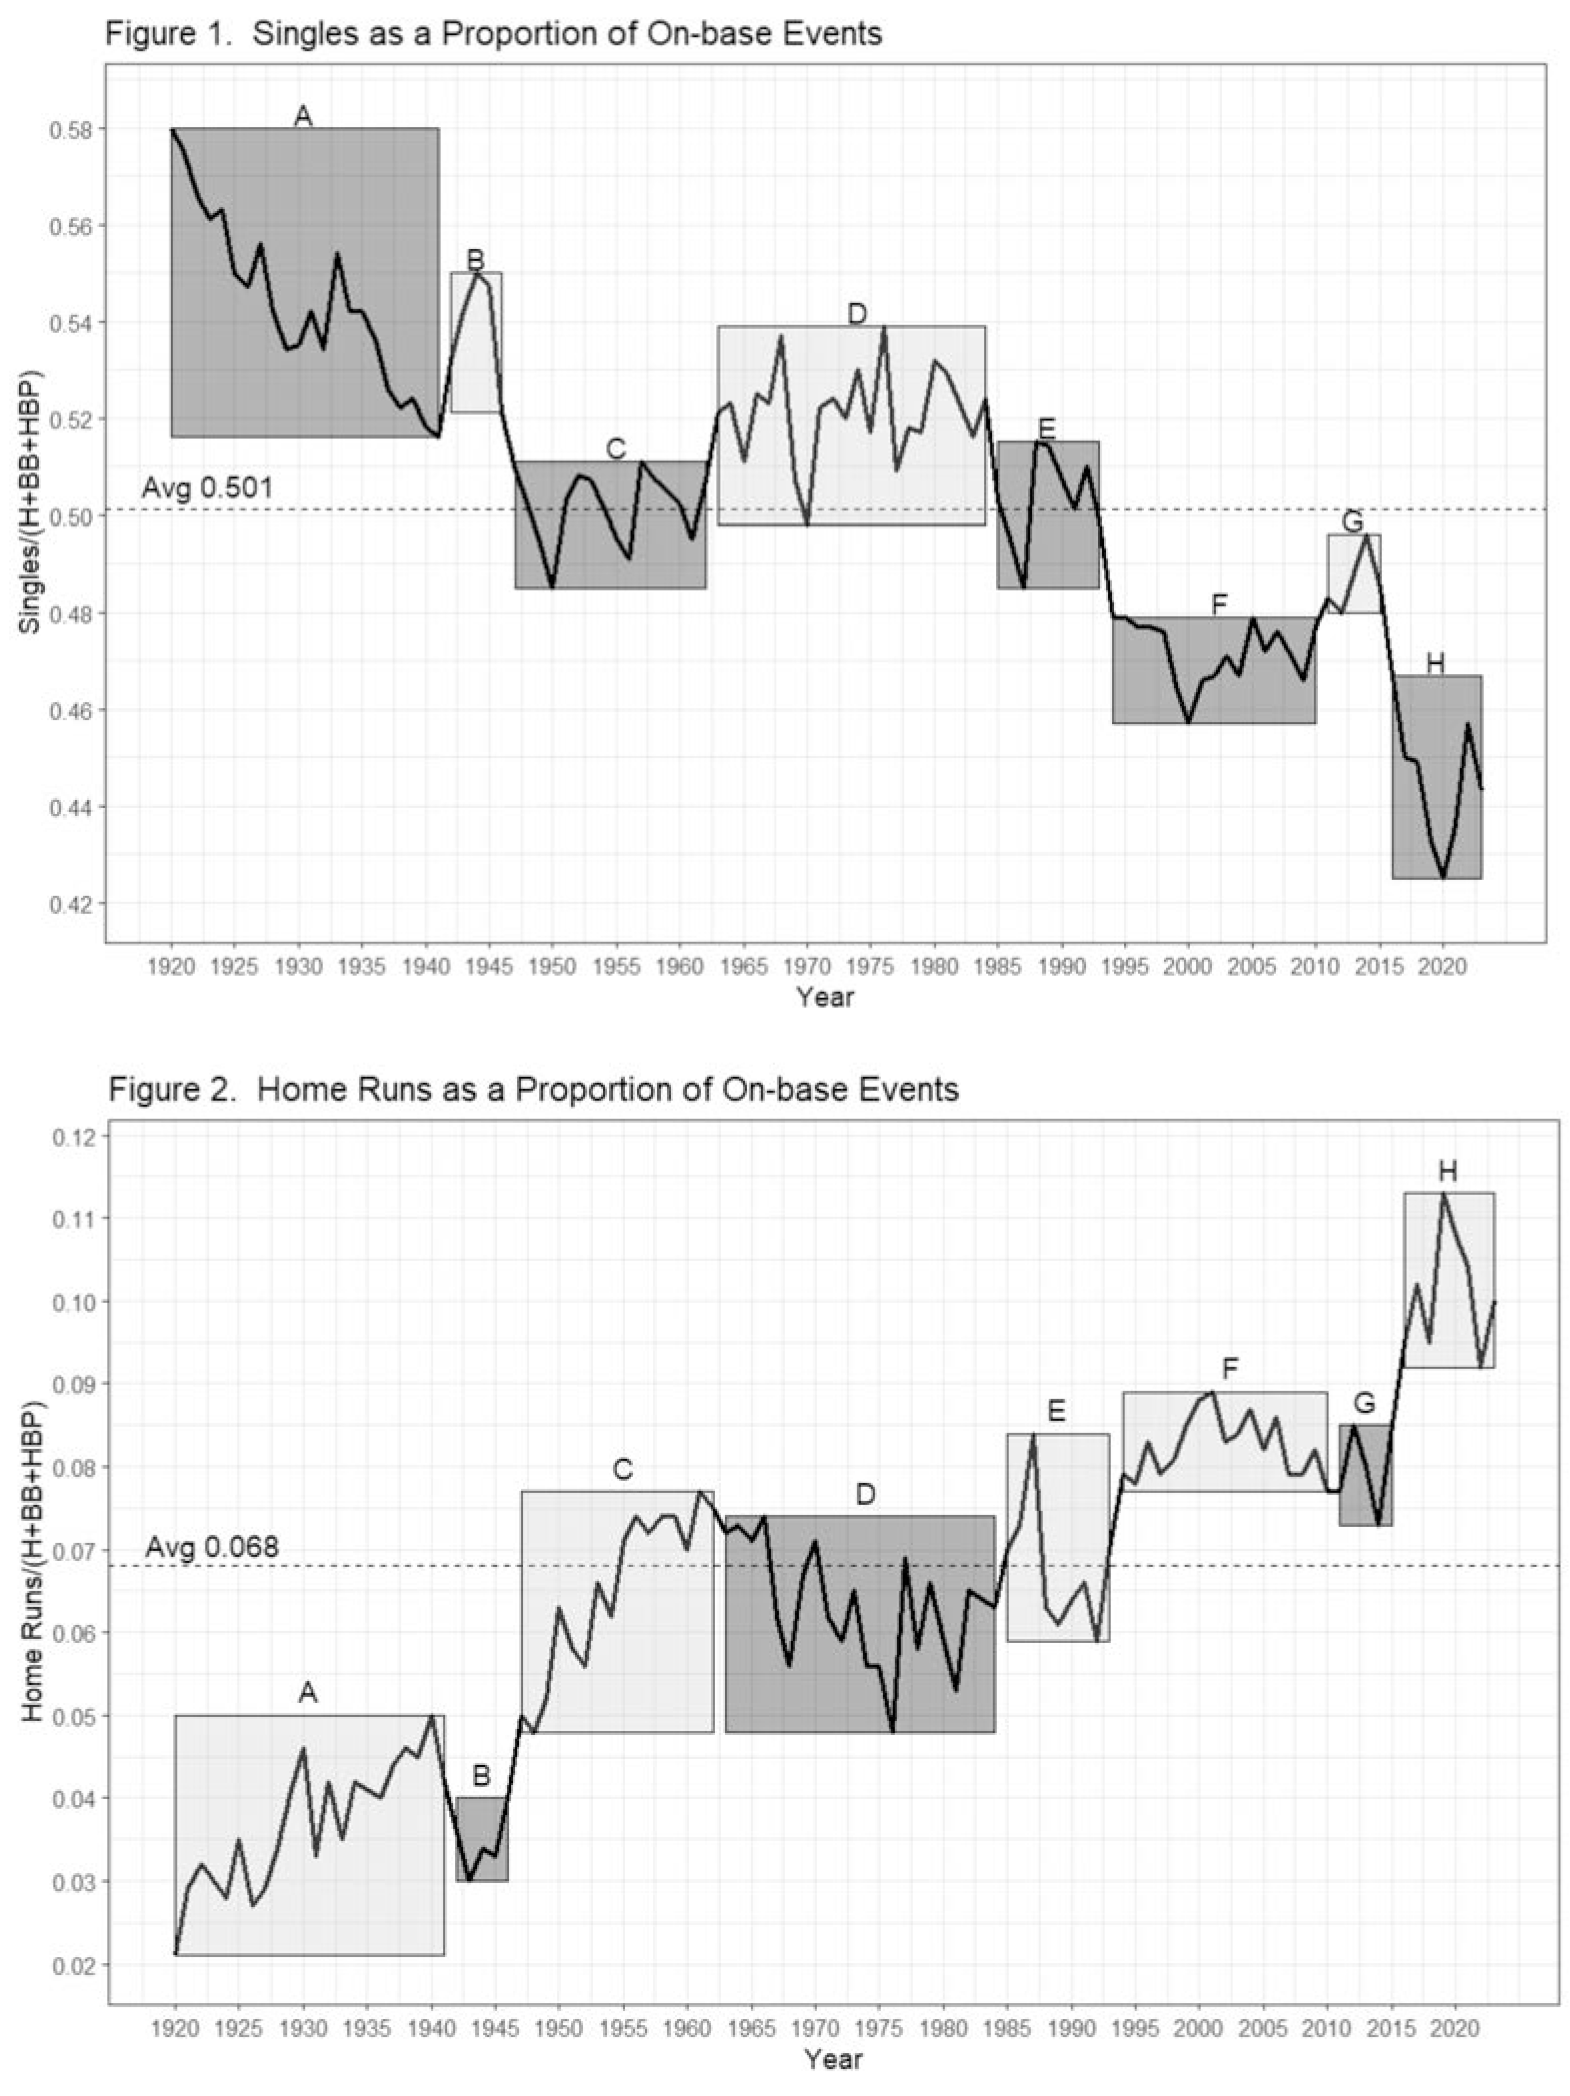
To see what happened with singles after modern baseball’s infancy, we plotted the singles prop along with the home-run prop from 1920 through 2023 (Figures 1 and 2). In each plot, the line connecting the data points for each season has been divided into the same eight segments, labeled A through H, each of which represents a distinct trend in the singles proportion. Segments in darkly shaded boxes represent periods in which the singles prop (or the home-run prop) was in a down cycle, while segments in lightly shaded boxes represent periods in which those props were in an up cycle. Section 2 discusses these periods from a historical perspective. In the singles proportion plot (Figure 1) the horizontal line at .501 represents the mean singles proportion for the entire period shown, 1920–2023. In the home-run proportion plot (Figure 2) the horizontal line at .068 represents the mean home-run proportion for the entire period shown, 1920–2023. The discussion following Figure 1 will focus first on the singles prop.
Several facts are evident from the singles proportion plot:
- Since the Deadball Era, about half of all on-base events have been singles.
- The singles prop has experienced numerous rises and falls during the last 104 seasons.
- The long-term trend of the singles prop is downward.
- The singles prop has been at historically low levels since 2016.
1.3 Explanations for Long-term Downward Trend
The downward trend of the singles prop tells us that, relative to other on-base events, batters today rely less on the single to reach base than they ever have. It tells us that singles don’t contribute to run production as much as they once did. Babe Ruth started it all back in 1920 when a confluence of circumstances allowed him to hit an astounding 54 home runs. It was a demonstration for the fans that baseball with more home runs was more fun to watch. His popularity was a demonstration for the owners that baseball with more home runs was more profitable. And it was a demonstration for the teams that more home runs could make a valuable contribution to winning games.12
As the game was being transformed, baseball observers began to look at data and think seriously about the relative importance of events like singles and home runs in helping to produce runs.13 The analysis of baseball data took a giant leap starting in the 1970s, when the processing speed of computers and then the emergence of the World Wide Web allowed an ever-broader range of baseball observers to use ever-more-advanced statistical methods to study ever-larger volumes of data.14 Over the decades and through all the technological advances, baseball analysts never retreated from what is now universally accepted regarding the importance of hitting for power. The first half of the story is that there came to be a broad, data-based recognition, starting with baseball analysts and writers and eventually spreading to major-league front offices, that runs are most efficiently produced with extra-base hits, especially home runs.15
The equally important second part of the story was the realization that at any level of development, many players who aren’t already considered power hitters can become power hitters with the proper training.16
This evolution in thinking influenced player acquisition, minor-league instruction, offseason training, and player compensation.17 Power hitters were rewarded with large contracts, and it gradually became more common for players to spend their offseasons with professional trainers to increase their launch angles, strength, and bat speed.18 The new approach to building a winner gradually influenced even college, high school, and youth baseball programs. In recent years, slugging has become even more valued at the major-league level because improvements in pitching (both velocity and command of breaking pitches), data-driven defensive shifts, and changes in the way pitchers are utilized during a game (more pitchers giving maximum effort for shorter stints) make it even more difficult for hitters to string enough singles together to generate runs.19
(Click image to enlarge)
1.4 Effects of Long-term Downward Trend
There were consequences to the decisions now being made by front offices. Teams became willing to sacrifice some contact hitting, speed, and defense for the sake of additional slugging, particularly at certain positions.20 The term “singles hitter” and “slap hitter” were commonly used by baseball observers and writers until fairly recently to describe players whose offensive contributions consisted largely of hitting singles. Such players also tended to be better baserunners, defenders, and bunters, and better at executing the hit-and-run and hitting behind baserunners. (See Appendix B and Table 4.) They made contact more frequently. This combination of skills was once considered a necessary piece of any well-rounded team. The term is rarely used now because so few players fit that description.
Players who were traditionally considered singles hitters generally had a singles prop around .600 or higher (see Appendix B for the post-1919 career singles prop leaders). In the 1976 season, when the league singles prop was .539, there were 37 such players in the majors who qualified for the batting title, including future Hall of Famers Lou Brock, Robin Yount, and George Brett. In 2019, when the league singles prop was .433, there were only six qualifying players at .600 or above, the most notable being Tim Anderson and Elvis Andrus.21
1.5 Relationship to Other Game Events
The impact of emphasizing slugging at the expense of other skills can also be seen by comparing the singles prop with the home-run prop. It’s probably not surprising to see an inverse relationship between them; when one goes up, the other tends to go down. But in this case the negative correlation is very high. We computed the correlation coefficients for each on-base event proportion as well as stolen bases per game (SB/G), strikeouts per game (SO/G), sacrifice hits per game (SH/G), runs per game (R/G), hits per game (H/G), and batting average (BA) to better understand the relationships between the singles prop and other metrics (Tables 1 and 2). The underlying data are from the 1920 through 2023 seasons.22
Table 1 shows all positive correlation coefficients (for metrics that tend to move in the same direction), while Table 2 shows all negative correlation coefficients (for metrics that tend to move in opposite directions). The strongest correlations, with absolute values greater than 0.75, appear in light gray-bordered cells to help them stand out, as these are the most meaningful.
Tables 1 and 2
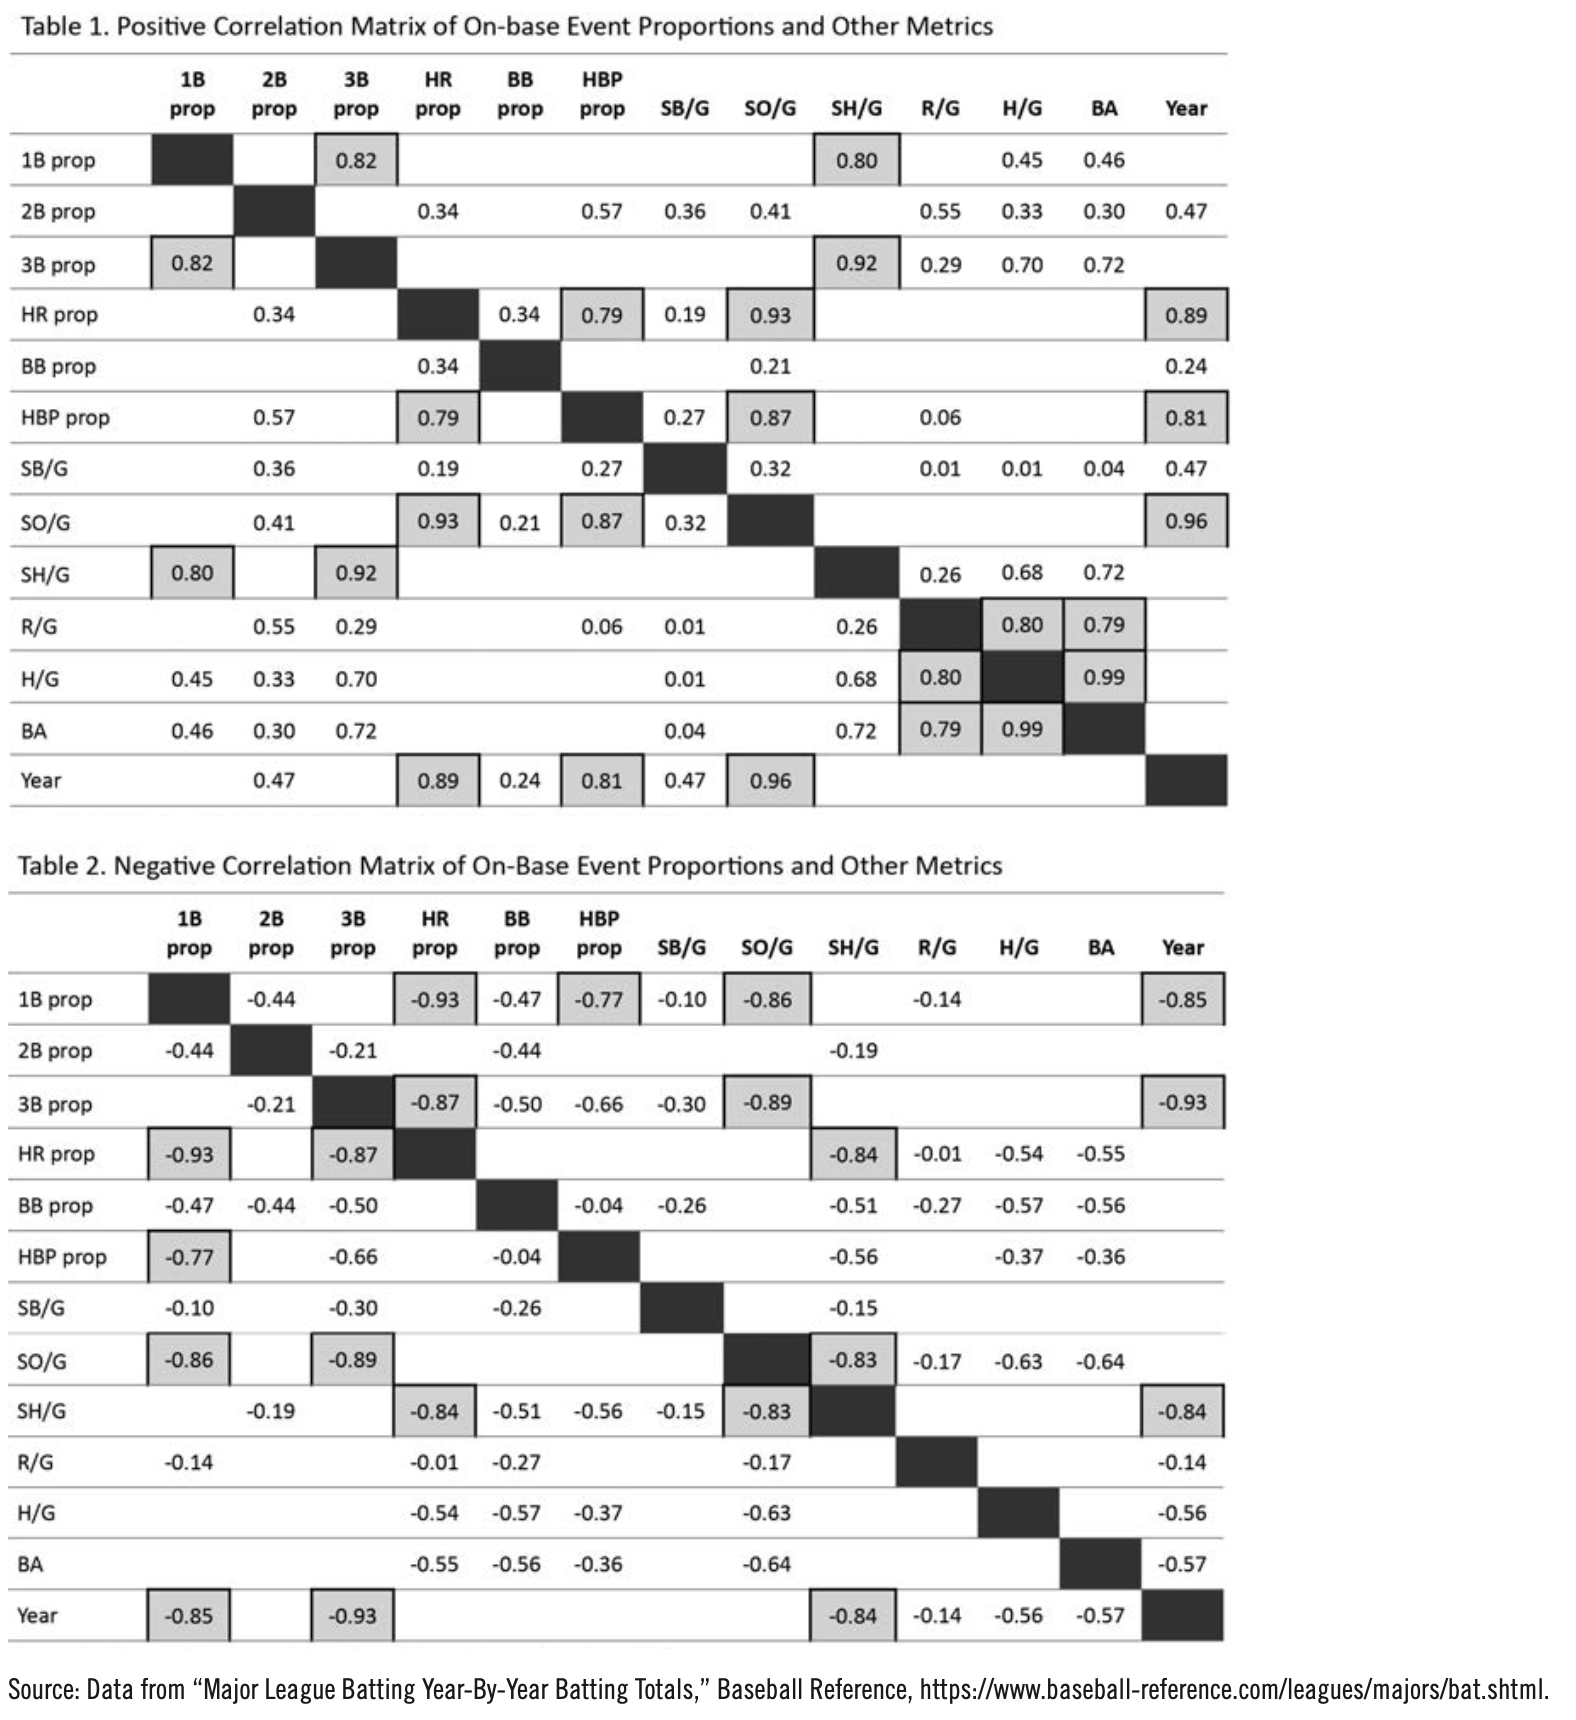
The easiest way to read these tables is to read down a particular metric’s column to identify the other metrics with which it is most correlated (indicated by the positive and negative coefficients with the largest absolute values in Tables 1 and 2). Several observations can then be made:
- The singles prop, the triples prop, and sacrifice hits per game are strongly correlated with each other, which means they have a strong tendency to move together in the same direction.
- The home-run prop, strikeouts per game, and the hit-by-pitch prop also have a strong tendency to move together in the same direction.
- There is a very strong negative correlation between the singles prop and the home-run prop. Historically, they’ve moved in opposite directions. If home runs become a more important part of offense, singles become a less important part.
- Both the singles prop and the home-run prop are very weakly correlated with runs per game, demonstrating what we stated earlier: The singles prop tells us more about how runs were scored than how many runs were scored.
- The “Year” column in these tables treats the year as a number (e.g., the year 2020 equals the number 2,020). If the correlation between a statistic and the year number is high (strong) and positive, we’re saying that statistic tends to increase over time. The tables reveal two strong long-term trends over the last century of baseball history, since the Deadball Era ended. The singles prop has fallen since 1919, while the home-run prop and strikeouts per game have risen over the same period.23
- Hits and batting average have sometimes been used as a kind of proxy for the singles prop; that is, they’ve been used to try to describe how runs are being scored. But neither is strongly correlated with the singles proportion. To the contrary, hits and batting average tell us more about how many runs were scored. The singles prop, together with the home-run prop, is the single best way to measure how runs are being scored.
In sum, the computed correlations in Table 1 and Table 2 show how the singles prop is related to other game events and their metrics. These relationships are what give the singles prop its powerful ability to tell a story not just about singles in particular, but about how runs in general are being scored, indeed, about how the game is being played.
1.6 The End Result
The single has fallen to its lowest levels since the Deadball Era. Singles won’t disappear, of course.24 But they’re largely an afterthought, a fortuitous byproduct of a failed home run, and today’s game looks noticeably different. Teams look for different types of players and utilize a different offensive approach. These changes have brought more home runs and strikeouts, and fewer singles and triples, reducing the amount of action on the field itself.25 The singles prop is the single best measure of on-field action simply because singles lead to more on-field action (baserunning, fielding, and throwing) than any other batting event.
2. A CLOSER LOOK AT THE HISTORY OF THE SINGLES PROPORTION
2.1 Introduction
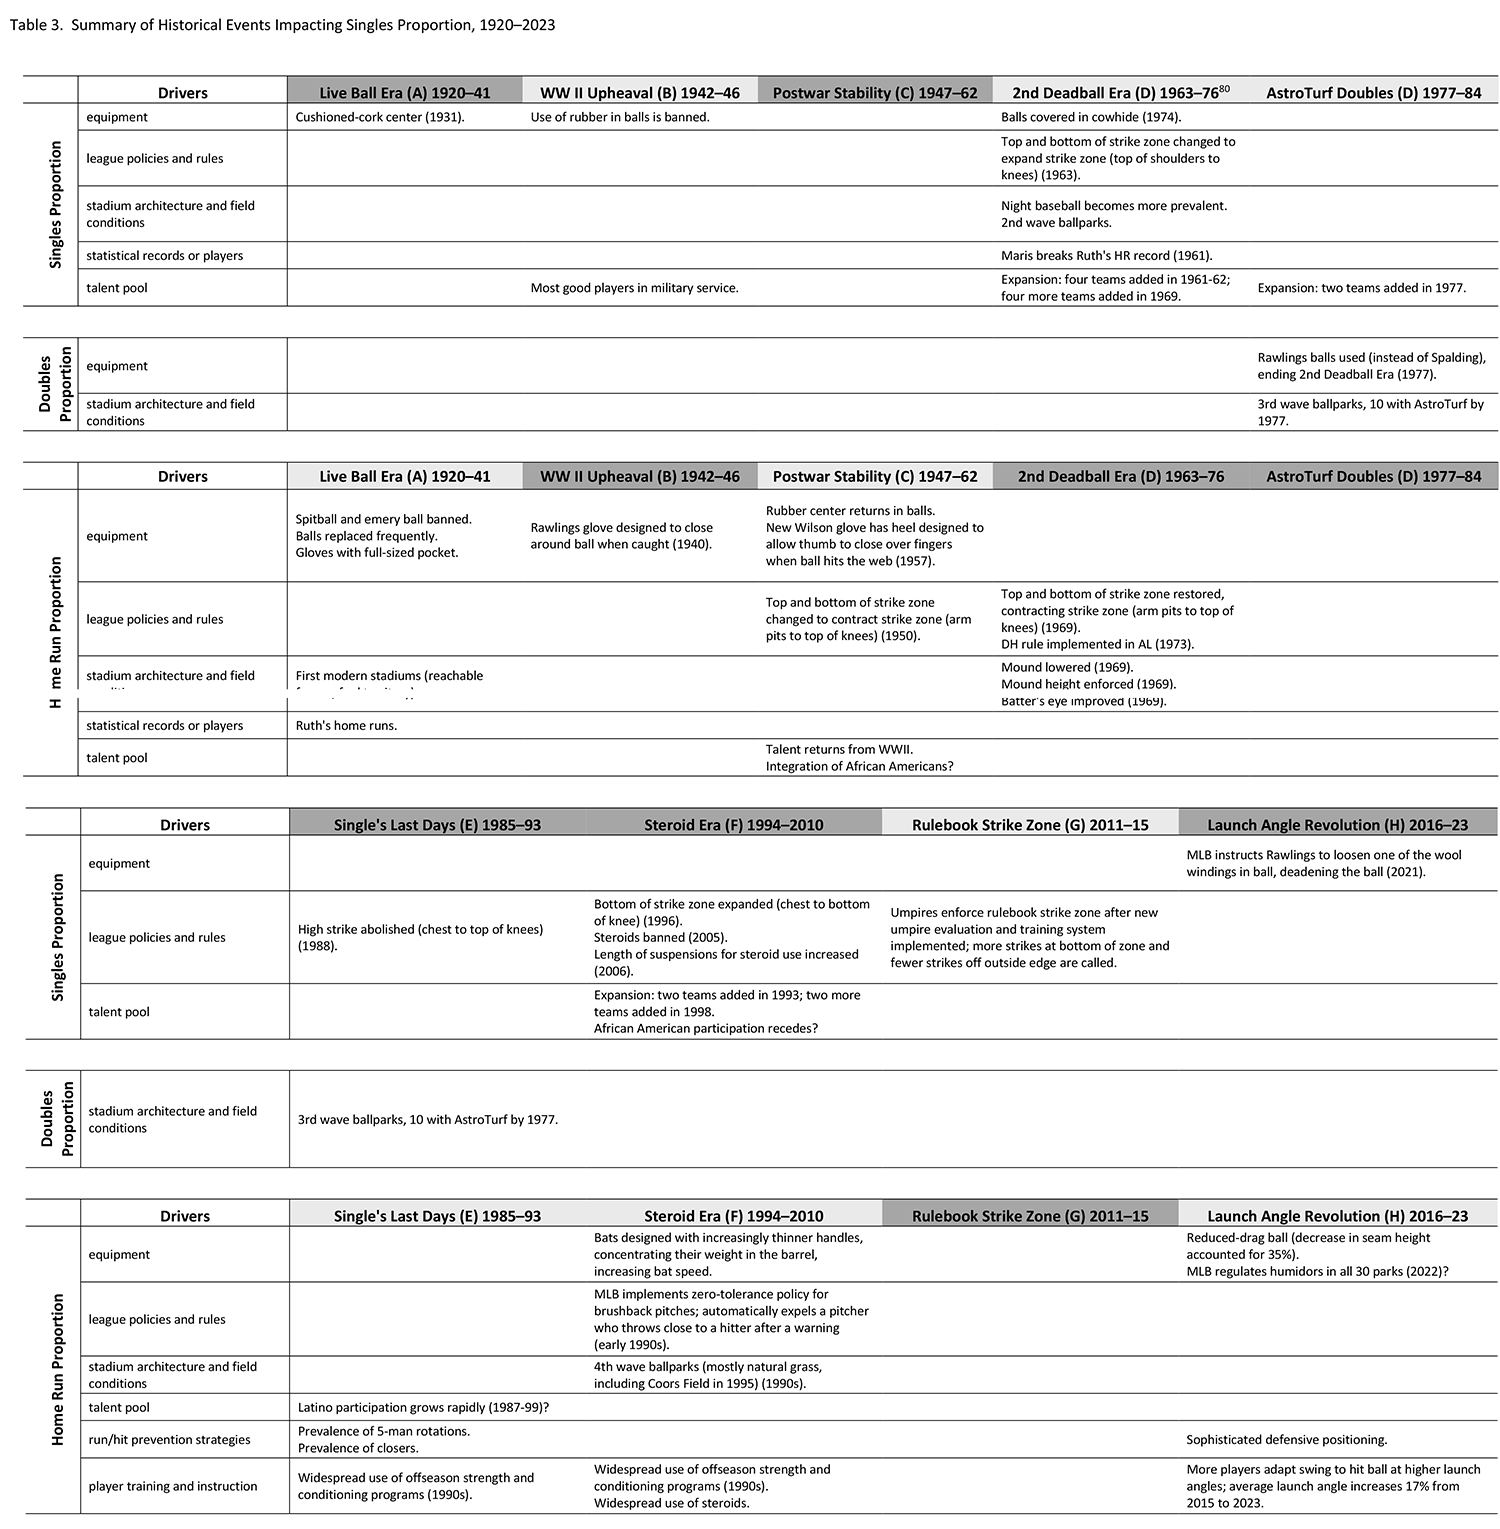
Having seen what a depressed singles prop tells us about how the game is being played today, let’s further test the efficacy of the singles prop as a metric by examining more closely its movements in the context of specific historical events. The task of explaining changes in the singles prop over the past century is a daunting one. We now know, for example, that any change in the baseball manufacturing process, no matter how trivial, and regardless of whether those involved are even aware of the change, has the potential to alter not only how many runs are scored, but how those runs are produced. This makes it difficult to attribute any change in the singles prop to one cause. Reality is always more complicated than the generalizations of historians. The truth is that changes in the singles prop over time are likely the net effect of multiple factors, some offsetting each other, some compounding each other, and some not even known to us.
Having said that, let’s take a stab at it anyway because it’s the only way we, as humans, can make sense of a complicated world. We need to see whether the singles prop is as informative about baseball’s past as it is about its present. To do this, we aren’t going to offer an explanation every time our plot of singles props (Figure 1, top) changes direction. Instead, we identified eight segments of the plot based on significant changes in trend. We labeled these segments A through H. We applied these same segments to the subsequent plot of home-run props (Figure 2) for ease of comparison.
For each segment or period, we’ll identify some of the events driving changes in either the singles prop or home-run prop. In some cases, we’ll identify an important event even though its impact on the singles prop or home-run prop is not clear. The events we identified ended up falling into one of seven categories: (1) equipment, (2) league policies and rules, (3) stadium architecture and field conditions, (4) statistical records or players, (5) talent pool, (6) run/hit prevention strategies, and (7) player training and instruction.26 The events themselves are summarized in Table 3 in Appendix A, and discussed in some detail in the remainder of this section.
2.2 The Live Ball Era (1920–41)
The Singles Prop’s Lengthy Decline (Segment A)
Segment A shows a dramatic rate of decline in the singles prop from 1920, when it was .580, through 1941 when it was .516. These years coincide with what is customarily referred to as the Live Ball Era. It might have been more accurate to name it the Clean New Ball Era. Spitballs and “emery” balls were banned at its outset, and umpires were directed to frequently replace scuffed, dirty, and discolored balls with clean new white ones.27
Once batters could see the ball better and unnatural breaking pitches were abolished, the walk and home-run props began trending up at the same time the singles prop started heading down. The team owners refrained from interfering for a decade, realizing that home runs were increasing the popularity of the game in the wake of the 1919 Black Sox Scandal. Their hands-off approach eventually gave way in reaction to the startling rise in home runs during 1929 and 1930. In 1931, the cushioned-cork center, which added ground rubber to the previous cork-only center, was introduced into baseballs to deaden them.28 But this was but a brief interruption as the home-run prop soon resumed its upward trajectory. Runs per game remained relatively steady throughout this period, averaging 4.85, nearly a full run above the run rate during the Deadball Era.
The increase in home runs would not have been possible but for the emergence of concrete and steel stadiums, most of which had outfield fences that batters could reach more easily. In addition, the newer parks tended to move the fans further away from the field, creating more foul territory. This had the effect of making it easier for batters to make outs, thus making it more difficult to get hits. In short, the modern stadiums helped devalue the sequential offense (stringing multiple base hits together to produce runs) and boosted the value of power-oriented offense (reach base and wait there until a teammate hits a home run).
The first wave of modern parks opened between 1909 and 1923 and hung around until the early 1950s, when a second wave of parks was built. Yet the singles prop continued dropping throughout the Live Ball Era and even after. According to Bill James, “Almost every change in ballparks between 1930 and 1968 took hits out of the league.…There is no change in ballparks that I am aware of between 1930 and 1968 that significantly favored batting averages. Some changes favored home-run hitters, but none or almost none favored singles hitters.”29
Clean new balls, homer-friendly dimensions, and larger foul territory all made sequential hitting less efficient and slugging (particularly home runs) more efficient at generating runs, even though home runs came with a lot of strikeouts. Also contributing to this new reality were improvements in fielding gloves. During the 1920s, gloves with a full-sized deep pocket between the thumb and index finger emerged. Fielders could now reach balls they previously couldn’t, and being able to catch a ball in the pocket lessened the impact on their fingers and palms.30 Better fielding added to the difficulty of stringing together hits to produce runs. Small-ball strategies aimed at advancing baserunners made less sense now, as did filling roster spots with speedy contact hitters.
No player took greater advantage of modern stadiums, clean new balls, and improvements in fielding than Babe Ruth. He and his home-run records demonstrated for other players what was possible in the new playing conditions of the Live Ball Era. Both current and prospective players could now see with their own eyes that it was possible to have a powerful uppercut swing and still hit the ball consistently, or at least consistently enough. This effect likely grew throughout the Live Ball Era as players who adopted Ruth’s approach to hitting in their youth gradually entered the league.31
2.3 World War II Upheaval (1942–46)
Replacement Players Play with a Replacement Ball (Segment B)
It took over 20 years for the singles prop to drop from .580 to .516 in 1941. But it only took three seasons during World War II to rise back up to .550 in 1944. Meanwhile, the proportion of extra-base hits fell enough to sink offensive levels back to 4.07 runs per game between 1942 and 1946. Scoring runs hadn’t been that difficult since the Deadball Era.
World War II impacted the singles prop in two ways: It diminished the talent pool and it changed the materials used to manufacture baseballs. Rubber, an important ingredient of a baseball’s core as well as a component of tanks and planes, was banned in items not essential to the war effort. The redesigned ball was made of less elastic materials. The dead ball, and with it, small ball, were back.32 More importantly, Ted Williams, Joe DiMaggio, Stan Musial, and most of the rest of the best players were in military service. More than 500 major leaguers had their careers interrupted for a greater cause.33 James estimates that only 40% of major-league players during this period were of major-league quality.34
2.4 Postwar Stability (1947–62)
The Singles Proportion Dives into a Period of Sameness (Segment C)
As soon as the war ended and the talent pool was replenished by returning veterans, and eventually newly integrated African Americans, the singles prop resumed the dramatic descent that had begun in the Live Ball Era. It declined every season from 1944 (.550) to 1950 (.485), the largest uninterrupted drop in baseball history until 2020. Then, for the first time, the singles prop appeared to establish a state of equilibrium, hovering above and then below the all-time average of .501 in a cycle that repeated itself three and a half times between 1947 and 1962.
The inverse relationship between the singles prop and the home-run prop holds up least well during this period. While the singles prop remained stable, the home-run prop, aided by the decision by both leagues to shrink the strike zone for the 1950 season, resumed its relentless trek upward from the Live Ball Era. Home runs as a proportion of on-base events increased steadily and significantly throughout this postwar period, from .048 in 1948 to .077 in 1961.35 The level of offense was not changing, but the nature of offense was. The home run had never played such an important role in generating runs. Rosters were filled out with players who could hit the occasional home run but couldn’t do much else. The reemergence of basestealers at the very end of this era offered some hope, however.36
2.5 The Pre-Turf Expansion Era (1963–76) and AstroTurf Doubles (1977–84)
Rule Tinkering Triggers Rise in Singles Proportion and Drop in Home-run Proportion (Segment D)
As we saw in Figure 1, the singles proportion experiences only three up cycles after the Deadball Era, and two of them are quite brief: 1942–46 and 2011–15. The Pre-Turf Expansion Era and subsequent AstroTurf Doubles period, on the other hand, lasted 22 seasons. The period is filled with events that influenced the on-base event proportions and gives us glimpses of our ideal version of the game, so it’s very instructive for our purposes and warrants exploration in some depth.
The National and American Leagues each added two new franchises in 1961–62 and two more in 1969. Some observers believe league expansion of this magnitude played an important role in the decline of offense from 1963 to 1984. Normally, the resulting dilution of talent would require teams to diversify their offenses, leading to fewer runs scored. This time, however, any dilution of talent was more than offset by the continued growth in the number of African American players and, to a lesser extent, Latino players throughout this period.37
It’s more plausible that the decline was initially triggered by Roger Maris breaking Babe Ruth’s single-season home run record in 1961. Fearing home runs were becoming too routine, the Baseball Rules Committee decided to expand the strike zone prior to the 1963 season.38 Unfortunately, they overshot their mark by extending the strike zone both upward from the armpit to the top of the shoulder, and downward from the top of the knee to the bottom of the knee.39
The change had a more dramatic effect than the committee likely intended. The singles prop immediately rose to .521 in 1963, a level not seen since the war years. The home-run prop eventually fell as well. From baseball’s perspective, the problem was that runs per game collapsed to World War II levels. Pitching dominated because the expansion of the strike zone caused strikeouts to shoot up and walks to drop off dramatically. The quality of batters’ contact suffered as well, with hitters being forced to swing at pitches they could previously take for balls. Thus began an era of pitching dominance.
Also helping to suppress runs during this period was the second wave of ballparks that entered the league beginning in 1953 and continuing into the 1960s. Some were new as a result of franchises moving to new locations; others were newly built. Regardless, most were pitcher’s parks. On top of that, night baseball was becoming more prevalent during the 1960s. Early lighting technology was primitive by today’s standards, so this too favored pitching.40 Offense eventually crashed to 3.42 runs per game in 1968, a level not seen since 1908, the heart of the Deadball Era. Baseball felt compelled to act again by restoring the smaller strike zone (arm pits to top of knees), lowering the mound, and actually enforcing the standard mound height (several teams with good pitching were believed to have had pitcher’s mounds higher than the rules allowed).41 In addition, league policy finally started requiring that the visual background for the batter (an area located beyond the center-field fence known as the batter’s eye) protect the hitter’s ability to see an incoming pitch.42
These latest changes had their desired effect, jacking offense back up above 4 runs per game in 1969. The singles prop, which had spiked to .537 in 1968, the highest since the war years, now fell back to .507, its largest season-to-season drop to this point in the twentieth century. Predictably, the home-run prop, which had collapsed to .056 in 1968, now jumped back up to 1950s levels.
Strangely, the boost in offense was short-lived. One can only speculate as to why (improved defense?). In any case, the roller-coaster ride of the Expansion Era continued, fueled by baseball’s seemingly quixotic search for balance, a balance that stubbornly refused to reveal itself. By 1971, runs per game were back down below 4.0 and the singles prop was back up above .520. The American League, which had been lagging behind the National League in runs per game, brought out the big guns this time by implementing the designated-hitter rule in 1973.43 This clearly helped run production, at least in the AL. Then, in 1974, a shortage of horsehide prompted the major leagues to start using baseballs covered in cowhide.44 The singles prop rocketed to a period-high .539 in 1976.
It didn’t stay there for long, though. In 1977, MLB’s ball supplier changed name from Spalding to Rawlings and it’s likely manufacturing changes unintentionally affected the ball.45 Whether intended or not, the singles prop crashed again every bit as hard as it had in 1969. And with that, the Expansion Era was truly over. Runs per game never fell below 4.0 again. The Rules Committee had come full circle. Runs per game were back up to the levels of the late 1950s, a few years before the decline commenced.
While runs were up, the singles prop and home-run prop continued to oscillate at the same levels through the 1984 season. Both proportions kept fluctuating within intervals signaling greater reliance on the single and less reliance on the home run compared to the preceding postwar period. How was this possible? The singles and homer props aren’t telling us the whole story. For the first time since the transition from the Deadball Era to the Live Ball Era, the doubles prop jumped to a new level.
The key driver behind this odd eight-year period was a third wave of ballparks entering the major leagues during the 1970s.46 The newly constructed parks were sterile and uniform multipurpose sports stadiums. But it was primarily the fast artificial turf playing surfaces in almost all of them that affected the way offenses generated runs. The prototype was Houston’s Astrodome, which opened in 1965 and installed AstroTurf in 1966.47 Six more artificial turf fields were added between 1970 and 1973, and three more in 1977. Except for 1979–81, when there were nine, there would be 10 artificial turf fields in baseball until 1994. Most were in the National League. Groundballs scooted across turf faster than on grass, and line drives and fly balls bounced higher. Speed and quickness now mattered for both batters and fielders more than at any time since the Deadball Era. Balls that weren’t hit directly at an infielder could make it to the wall for a double or triple. The overall level of runs, 4.3 per game, was mid-level, historically. But the new playing conditions allowed all aspects of the game to emerge. Teams like the Kansas City Royals and St. Louis Cardinals, who did the best job constructing rosters that would flourish on artificial turf, won many games during the late 1970s and 1980s despite consistently finishing near the bottom of the league in home runs. Singles, doubles, triples, stolen bases, and fielding percentage—these were their marks of honor.
The best thing about these years was that good teams could win in a variety of ways, and good players could possess different skill sets. It was an unintended but welcome respite from the inexorable march of the home run. Baseball had always been more concerned about the balance between offense and pitching. But this was a new type of balance that fans hadn’t seen. Attendance increased. But baseball purists struggled with the way the baseball behaved on this new surface. Batted balls that were previously routine outs were now singles, and what had been singles were now doubles or triples. The speed of the game had changed.
2.6 The Single’s Last Days (1985–93)
Singles Proportion Collapses Again to Record Low Before Stabilizing Around All-time Average (Segment E)
The 1985 season saw the beginning of a decline in the singles prop that would eventually take it down to .485 by 1987. Baseball then abolished the high strike, defining the top of the zone as the midpoint between the shoulders and the top of the uniform pants, and the singles prop bounced right back up in 1988 before settling down to average .503 for the period ending in 1993.48 It wasn’t a dramatic change, but it was a distinctly lower level than the singles prop of the Pre-Turf Expansion Era and the AstroTurf period. Predictably, the initial decline in the singles prop brought with it a resurgence in the power-hitting game, with the home-run prop shooting up to a then-record level in 1987. But, unlike in 1950 and 1969, the 1988 contraction of the strike zone had the effect of erasing the home-run prop’s gains and then keeping the home-run prop suppressed through the 1993 season. Pitchers were likely working the bottom of the strike zone more intensely once the high strike was abolished.
For the period as a whole, the double and home-run props both bumped up, along with the walks prop, but offense remained around the same 4.3 runs per game achieved during the AstroTurf period of 1977–84. Artificial turf surfaces continued to exert an important influence throughout this period (speed still mattered), but other factors seemed to be coming into play now. We might view this period as an extension of the 1977–84 turf period with a modest increase in the home-run prop and a modest decrease in the singles prop.
The now prevalent use of five-man starting rotations and closers helped support the home-run prop. Adding a starter to the rotation and letting a dominant reliever specialize in preserving narrow leads in the ninth inning likely added to the difficulty of stringing hits together to generate runs, and thus encouraged greater reliance on the home run.49 Another driver of the home-run prop beginning in the 1990s was players increasingly devoting their offseasons to strength and conditioning programs rather than supplementing their incomes.50 It was finally acknowledged by everyone in the baseball world that offseason strength training done properly could improve a power hitter’s performance. As more and more players participated, and as the programs grew in sophistication, durability and performance improved, and any gains in strength were generally reflected in more extra-base hits for batters and more strikeouts for pitchers. Finally, the explosive growth in the number of Latino players from 1987 to 1999 cannot be ignored, though its effect on the single and home-run props is unclear.51 Any significant addition to the talent pool would seem to help the home-run prop because it provides teams with the means to implement their preferred strategies: home runs and power pitching. The unanswered question is, What kind of talent was being added?
2.7 The Steroid Era (1994–2010)
The Singles Proportion Topples to New Depths (Segment F)
In the 1990s, the analytics movement was gaining greater acceptance within front offices. It confirmed what many in baseball instinctively knew in earlier eras: Small-ball strategies, featuring speed and contact hitting to advance baserunners, were a relatively inefficient way to score runs. This would become a near-universal mindset as the Steroid Era progressed, and it was reflected in the behavior of the singles and home-run props.52
After 1919, the Pre-Turf Expansion Era and its AstroTurf aftermath was the singles prop’s lengthiest period above its all-time average of .501 (21 of 22 seasons). Its counterpart below the all-time average was the Steroid Era (17 consecutive seasons). The singles prop set or tied a record low (post-1919) every season from 1994 through 2000, when it bottomed out at .457. For the entire period, it averaged .472, 29 points lower than the next lowest era, the postwar period.
Of course, it wasn’t just the singles prop that changed so dramatically. Surpassing their post-1919 record highs (both single-season and era average) were the doubles prop, home-run prop, strikeouts per game, and the hit-by-pitch prop. Run production in the Steroid Era was comparable to that in the Live Ball Era. But it was the outsized role of power hitting in generating runs that characterized this period in the minds of fans and analysts.
As it was all happening, observers naturally credited the ball itself for the power-hitting explosion. Some analysts continue to insist the ball is the only explanation that can plausibly account for such a sudden and large jump. As time passed and further evidence came to light, the more commonly accepted explanation for the power explosion was players’ widespread use of performance-enhancing drugs such as steroids.53 Both the ball and steroids may have been factors, and we’ll probably never know to what extent each contributed to this period of sustained power hitting.
The manifest power surge seemed impervious to forces that normally may have hindered it. The majors expanded by two teams in 1993 and two more teams in 1998. On top of that, African American participation was now receding. But any resulting dilution of talent seems to have been more than offset by the continued rapid growth in Latino players until 1999.54 In 1996, MLB expanded the bottom of the strike zone to the bottom of the knee, but this too had little effect.55 Other forces driving the home-run prop included a fourth wave of mostly natural grass ballparks (11, to be exact) built during the 1990s. These were generally friendlier toward hitters, and included among them Coors Field (1995), the best hitter’s park in the history of baseball. Also, in the early 1990s, baseball implemented a zero-tolerance policy for brushback pitches, automatically expelling a pitcher who threw close to a hitter after a warning. This enabled batters to crowd the plate and drive outside pitches to the opposite field.56
These factors, together with steroids, strength-building programs, and a possible lively ball, may have been too much to overcome. In any case, MLB made little effort to do so. With runs per game approaching Live Ball Era levels and fans excited by home-run races, team owners may have viewed the power explosion as a second Ruthian revolution that would increase the popularity of the game. They rode the power wave until the stigma associated with performance-enhancing drugs became too great. Stringent policies against steroid use, with significantly increased penalities, were put in place before the 2005 season, and the length of suspensions for steroid use was increased before 2006.57 This finally halted the climb in power numbers, but they never returned to pre-Steroid Era levels, and it would be another five seasons before the singles prop and the home-run prop began behaving differently. Drug testing confirmed that some players continued to use steroids.58 Perhaps more importantly, the power-hitting mindset (wait for your pitch and swing for the fences) had become firmly entrenched, buttressed by strength training, new parks, league policies, and equipment changes (bats and gloves).59
The character of the game evolved into something new during the Steroid Era. It produced a limited set of results: doubles, homers, walks, strikeouts, and hit batters. Speed, whether on the bases or in the field, didn’t matter as much. Sacrifice hits and advancing baserunners didn’t matter as much. Nor did defensive skills in general. Fewer balls were being hit into play, and strategic decision points occurred less frequently. Teams simply sat back and waited for the next power hitter in the lineup to drive in runs. Games were longer and moved along more slowly, so a greater proportion of game time contained no action. But MLB appeared content with the state of the game, so long as offenses were humming and attendance was climbing.
2.8 The Umpire Strikes Back (2011–15)
Conformity to the Rulebook Strike Zone Permits the Singles Proportion One Last Goodbye (Segment G)
In 2011, the singles prop moved toward pre-Steroid Era levels not seen for 18 seasons and remained there for five years. It peaked at .496 in 2014 before retreating again. The 2015 season would be the last with a singles prop above Steroid Era levels.
The doubles and home-run props did not change during this period, but the walks prop plunged to levels not seen since the 1930s, and strikeouts per game set a new record every season. In baseball history, this combination of changes had always been accompanied by a change in the strike zone.
While there was no official change to the strike zone during this period, there is evidence that umpires’ enforcement of the strike zone changed after 2009, when MLB began using an improved camera system in all major-league stadiums to, among other things, monitor ball-strike calls by umpires. In addition to the technology change, a new umpire evaluation and training system was implemented following collective bargaining between MLB and the umpires’ union in 2009. Umpires began receiving reports of their performance after every game. While this was happening, MLB took unusual disciplinary action by firing three of its seven umpire supervisors because of blown calls made during the 2009 postseason.60
A 2014 study by Brian Mills examined, among other things, the impact of changes in monitoring, evaluation, and training on the performance of major-league umpires from 1988 through 2013. Mills found substantial changes in the way umpires enforced the strike zone after 2009. Umpires were now calling balls and strikes in a way that was more consistent with the strike zone defined in the MLB Rulebook. Specifically, they called more strikes near the bottom of the strike zone and fewer strikes off the outside edge of the plate.61 The net effect, according to Mills, was a large increase in the rate of strikes called by umpires that “likely resulted in a decrease in offense [in 2010–11 runs per game finally started to move down in a significant way from Steroid Era levels] often attributed to the league’s crackdown on the use of performance enhancing drugs.…[A]ny claim of success in PED testing should be considered with some skepticism.”62
Mills’ findings provide a sound explanation for the rise in the singles prop during this five-year period. When the strike zone expands, whether the result of a change in the rules or a change in umpire performance, batters are forced to swing at pitches they would otherwise take for balls, and thus make weaker contact. The consequent increase in the singles prop was even more assured in this case because the strike zone, in effect, expanded downward, resulting in more groundballs.63
2.9 The Launch Angle Revolution and Reduced Drag (2016–23)
The Single Becomes an Accident (Segment H)
If we use a long-term macro perspective to look back at the singles and home-run props between 1920 and 2015, you could say baseball went through a transformative period during the Live Ball Era that was temporarily interrupted by World War II before settling into relative stability marked by short-term peaks and valleys after 1946. Sometimes offense had the upper hand and other times pitching had the upper hand. Sometimes offense was dominated by the home run and other times the power game was balanced by contact hitters and speed. But neither the singles prop nor the home-run prop strayed very far for very long before turning around and coming back home.
That might have continued indefinitely, but it didn’t. Baseball instead headed toward uncharted territory in 2016. Like the Live Ball Era, it was more than a shift in balance; it was a transformation. And if you measure it by the singles prop, it’s still happening.
The 2011 to 2015 umpire-driven interlude abruptly ended in 2016, when the singles prop experienced a two-season drop of 30 points to .467, comparable to the singles props of the Steroid Era. The home-run prop rocketed past its Steroid Era levels, rising 22 points over 2015 and 2016 to land at .095. Neither prop stopped there. The singles prop dropped below its all-time low the next season and continued to fall in subsequent years until finally landing at .425 in 2020. Its 71-point fall between 2014 and 2020 was the largest uninterrupted drop in the history of the game. Not to be outdone, the home-run prop experienced a 40-point rise during the five-year period ending in 2019, when it set its all-time high of .113. Baseball was in a different place now.
This time there was hard evidence of the primary causes, thanks to newly available Statcast data and more advanced laboratory testing. An exhaustive report by a group of scientists and mathematicians, commissioned by MLB in 2017 and published in May 2018, pointed to the most notorious catalyst for change throughout baseball history, the baseball.64 The report found that “changes in the aerodynamic properties of the baseball” resulted in batted balls having greater carry. Balls were traveling farther because of decreased drag.65 The researchers continued their work through the rest of 2018 and 2019 to try to definitively establish which physical properties changed to reduce air resistance. The report was monumental not only for identifying the primary cause of the latest power explosion, but also for demonstrating that the slightest change in the baseball manufacturing process has the potential to change, intentionally or not, the character of the game. Suddenly, all those who had pointed to the ball to explain previous performance changes throughout history gained a bit more credibility.
In December 2019, another report released by MLB made it apparent the scientists and statisticians were still struggling to identify all the factors affecting the air resistance of the ball.66 However, by using more sophisticated lab equipment, they were able to determine that differences in seam height accounted for about 35% of the change in drag.67 According to one of the scientists on the committee, “The change in seam height of a fraction of the thickness of a sheet of paper would give you a measurable effect in the change in the drag.” Reduced drag, or increased carry, was again identified as the primary cause of the increase in home runs, accounting for 60%.68 MLB promised tighter quality control to minimize ball-to-ball variation, but said it would not try to undo the changes that led to the ball’s increased carry. After the singles and home-run props went off the charts in 2019 and 2020, MLB did try to deaden the ball for the 2021 season by instructing Rawlings to loosen one of the wool windings.69 The change had the desired effect for two seasons, but both proportions resumed their journeys into uncharted territory in 2023, and the current version of the game remains vastly different from its historical past—due, at least in part, to the baseball itself.70
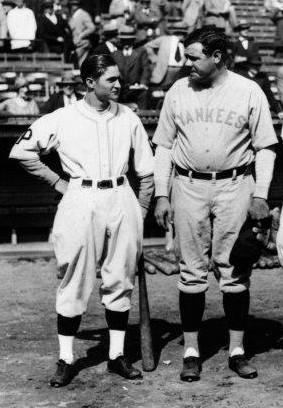
Babe Ruth with Lloyd Waner, the Pirates’ 150-pound center fielder. Before the 1927 World Series, Ruth said about Lloyd and his brother Paul, “Why, they’re just kids. If I was that little, I’d be afraid of getting hurt.” Waner’s career .700 singles prop was the highest since the end of the Deadball Era. (NATIONAL BASEBALL HALL OF FAME LIBRARY, COOPERSTOWN, NY)
The 2019 report’s conclusion that reduced drag accounted for 60% of the increase in home runs was interesting enough. Just as interesting was the report’s conclusion that the other 40% of the increase was attributable to launch conditions. That is, more players were adapting their swing to hit the ball at a higher launch angle (vertical trajectory).71 Sequential offense was more difficult than ever. Defensive positioning, with its shifting and shading, particularly among infielders, had grown ever more sophisticated.72 By 2015, exasperated hitters had responded with their own shift—a philosophical one sparked by Marlon Byrd’s turnaround season in 2013. This shift has been described as “so dramatic it can safely be called a revolution, with more hitters, armed with better and more extensive data than ever, reaching the conclusion that not only are fly balls, on average, better than grounders but that the latter are to be avoided at all costs.”73 As one proponent, 2015 American League MVP Josh Donaldson, succinctly put it, “Groundballs are outs. If you see me hit a groundball, even if it’s a hit, I can tell you: It was an accident.”74
Teams valued slugging. The stars of the game were paid a lot to slug. That wasn’t new. What was new was the recognition by many players that slugging required hitting fly balls, and that they could hit fly balls with greater frequency by training specifically to increase the launch angle at which they hit the ball. Now, thanks to an explosion of newly available launch-angle and other data, they knew the exact launch angles (25 to 35 degrees) and velocities (95 miles per hour or more) needed to hit home runs. Daniel Murphy, another player who turned around his career with higher launch angles, likened it to having some of the answers to the test. The most successful players were able to increase their average launch angle by 10 or 11 degrees from one season to the next. The average launch angle across the majors increased 17% from 2015 to 2023. The result has been a steadily declining league groundball percentage (including a record low 42.3 percent in 2023) and, ultimately, more slugging, including home runs.
The History of the Singles Proportion: Final Thoughts
Tracing the movement of the singles prop over the last century of National and American League baseball affirms the power of the singles prop to describe how runs are being scored and the game is being played. Time and again, when the singles prop fell, we saw a game moving toward more strikeouts and home runs and less action on the field. In short, the singles prop is a particularly insightful barometer for examining the game at this point in its history, as MLB works toward moving the game back toward its ideal form.
3. THE FUTURE OF THE SINGLE
Will the singles and home-run props ever again approach pre-Steroid Era levels? Will the single ever again be considered something more than the incidental side effect of a failed attempt at a home run?
One opportunity to increase the singles prop might have been the full implementation of an automated ball-strike system (ABS). History has shown that changes to the strike zone or its enforcement can have a powerful influence on how runs are produced. However, MLB now appears intent on implementing ABS with a challenge system rather than on every pitch.76
A safer and more reliable way to boost the singles prop may be to simply limit the number of active pitchers to 10.77 Carrying 10 active pitchers was the norm between World War II and 2000.78 By codifying what was the normal practice through much of modern baseball history, starting pitchers and at least some relievers would have to get more outs while throwing fewer pitches, lest their pitching staffs run out of arms. Pitchers would pitch to contact more often, batters would put more balls in play and reach base more often, and serial offense would once again be a viable means of scoring runs.77
For now, we’ll continue to live with more home runs, strikeouts, and hit batters, and fewer singles, triples, sacrifice hits, and balls in play. It all adds up to less action, despite the rule changes that went into effect in 2023 (some of which were suggested by Bill James decades ago). The rule changes were successful in quickening the pace of games and resurrecting base stealing. Perhaps that should give us some hope that contact hitting and defensive athleticism can make a comeback as well. MLB’s efforts to move the game in this direction appear sincere, and we now have some powerful tools, the various on-base event proportions, particularly the singles proportion, to help us measure the progress.
JAMES MUSSO is a life-long Cubs fan who somehow does not despise the White Sox. He was first drawn to baseball history and numbers in the early 1970s by the now-classic Sports Illustrated All-Time All-Star Baseball board game. After graduating from Northwestern University Law School, he spent the 1990s at STATS, Inc.
APPENDICES
Appendix A: Summary of Historical Events Impacting the Singles Proportion, 1920–23
Table 3 lists some of the historical events that likely boosted the singles proportion or the home run proportion at various points in time after 1919. These were discussed in some detail in section 2, but Table 3 attempts to provide a big-picture view that allows the reader to more easily place events in the larger context of modern baseball history. For this reason, events are organized by the era or time period in which they occurred (column headings), and also by whether they boosted the singles prop, doubles prop, or home run prop (row groupings in the first column). Column headings in darkly shaded cells represent periods in which that on-base event prop was in a down cycle, while column headings in lightly shaded cells represent periods in which that on-base event prop was in an up cycle.
Events with an unknown impact on the singles proportion or the home run proportion have a question mark following their description. In these cases, the net effect of the event on our on-base event proportions is unclear for any of a number of reasons. Sometimes, as in the case of the humidor requirements (see note 71), the science is complex and not yet fully understood, at least with regard to its application to baseball. In other cases (e.g., the integration of African Americans and the influx of Latinos) the matter simply hasn’t been studied in sufficient detail to draw well-supported conclusions. Such events were nevertheless included in Table 3 because of their potential importance and because they invite further research, not to mention informed speculation, an activity enjoyed by all baseball fans.
Table 3
(Click image to enlarge)
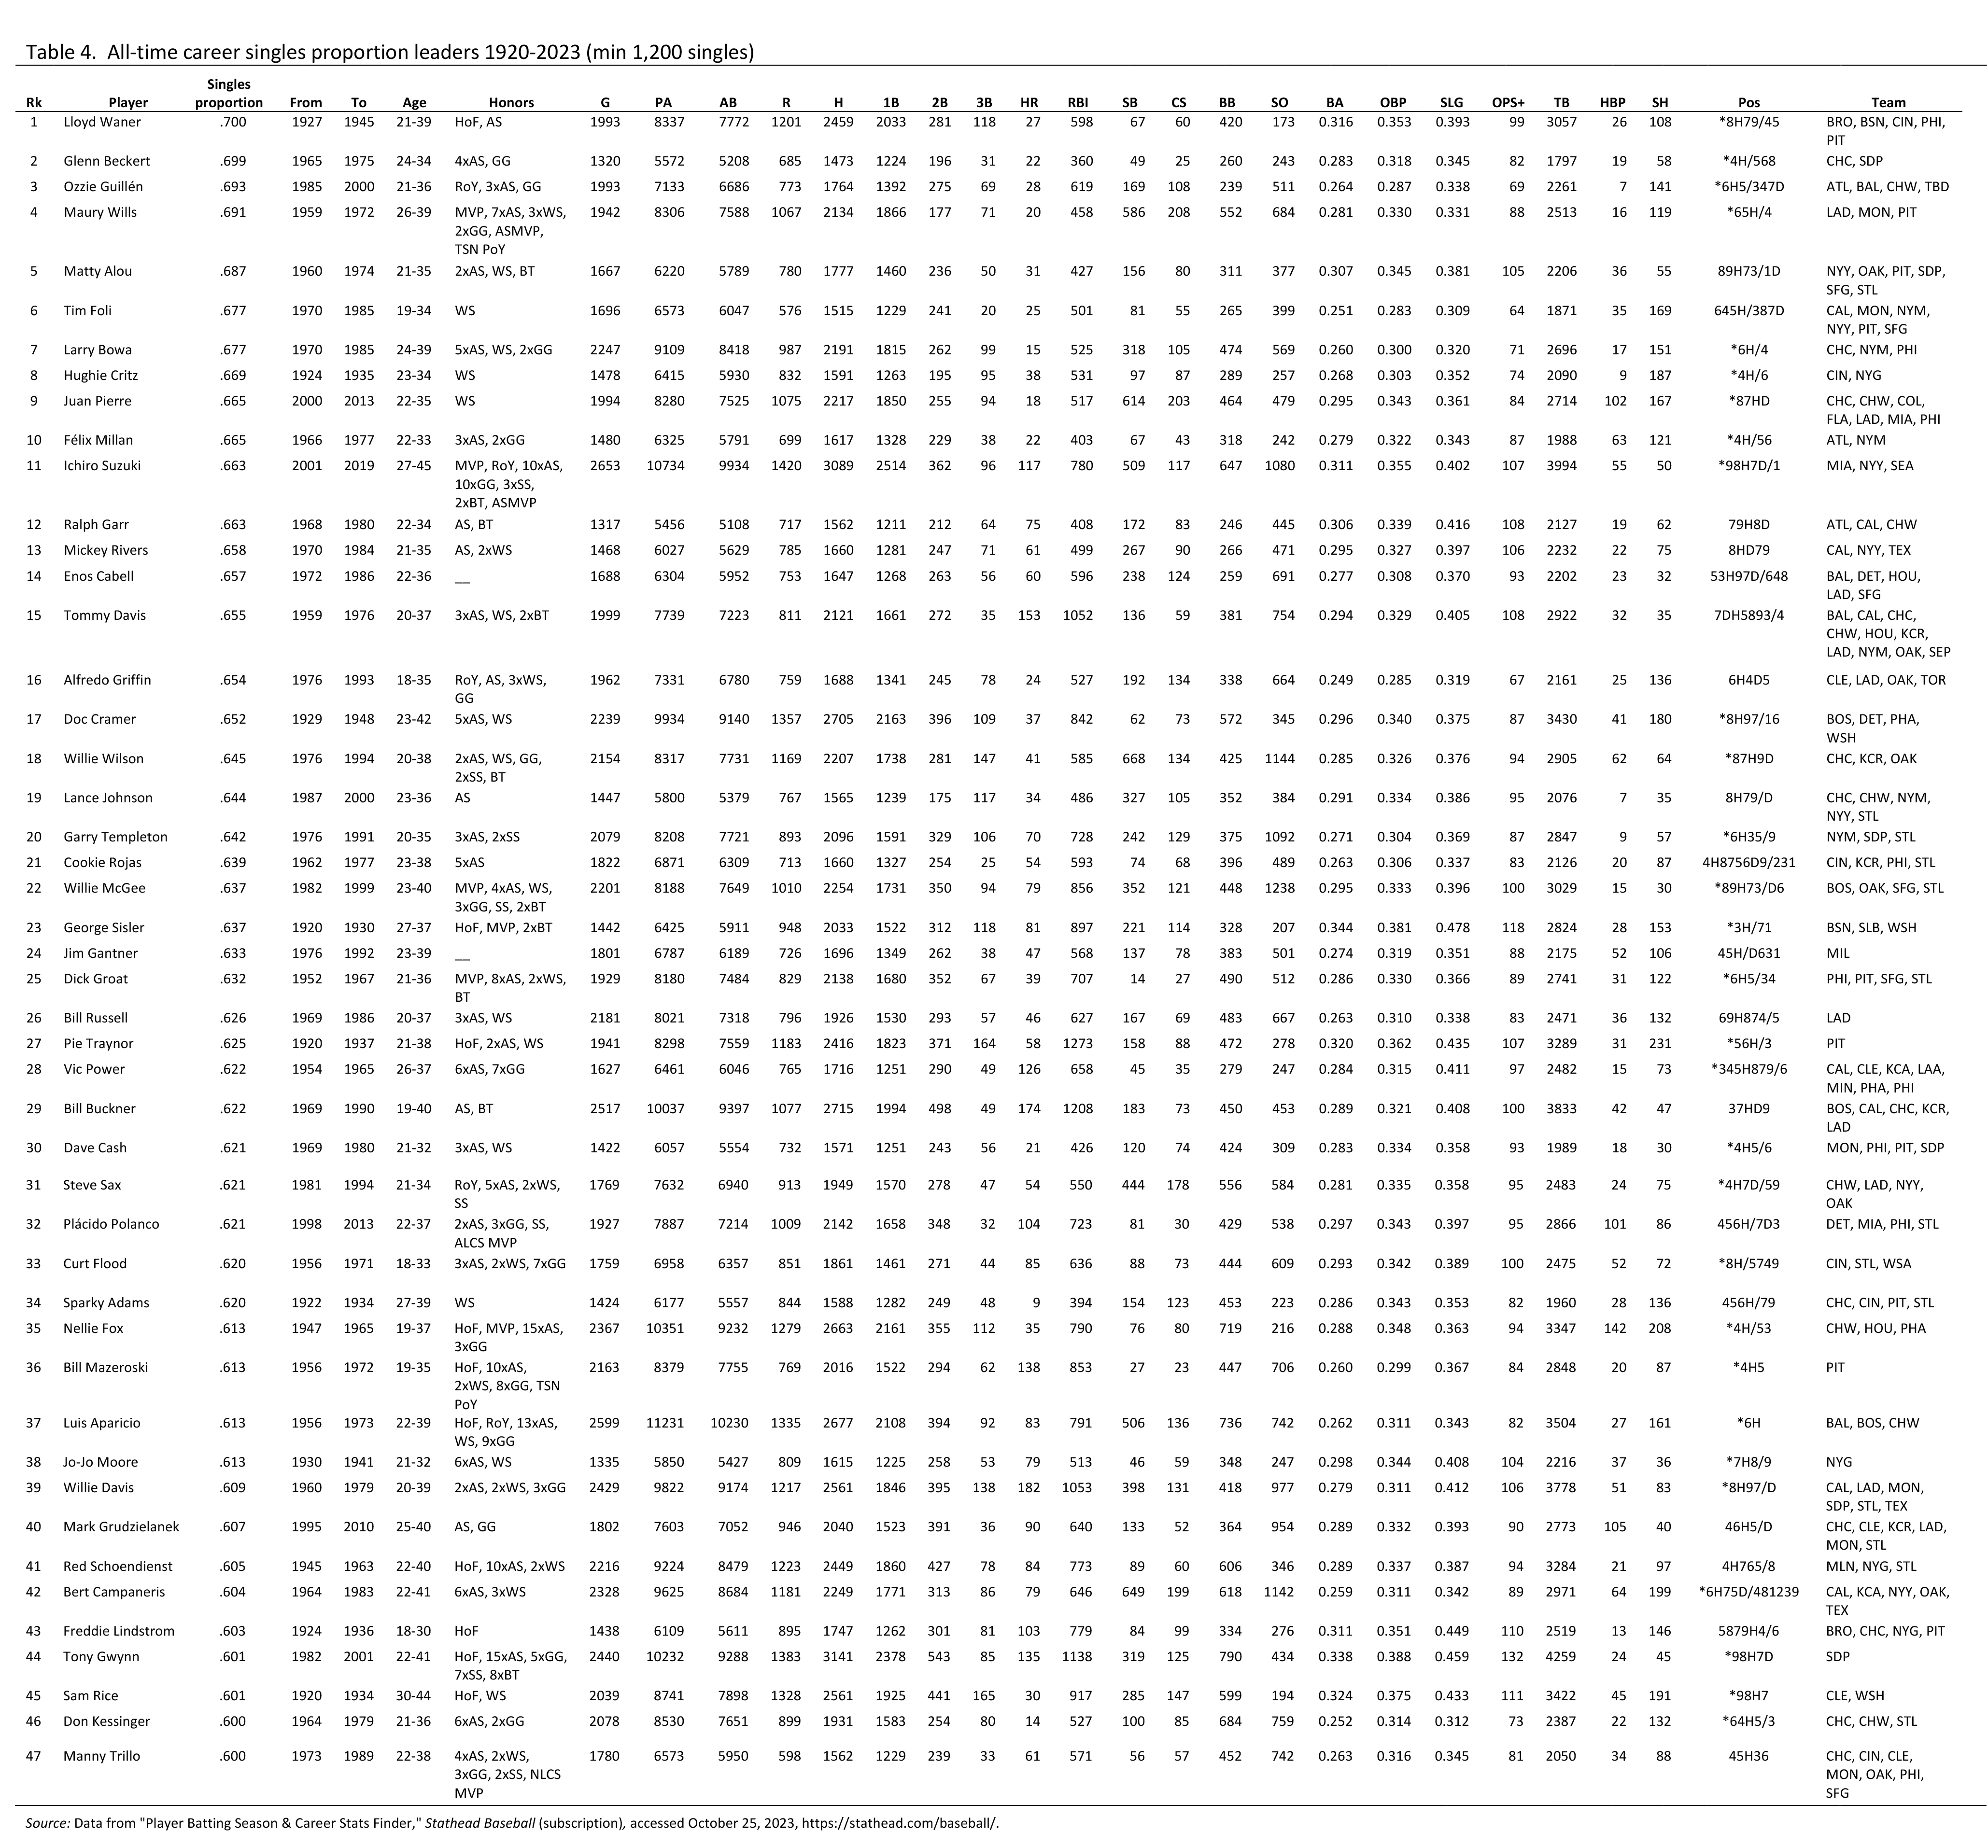
Appendix B. Career Singles Proportion Leaders (1920–2023)
The leaderboard in Table 4 lists the players whose singles comprised the largest percentage of their on-base events over their careers. The data covers the period 1920 to 2023, and is restricted to players with a minimum of 1,200 career singles. Forty-seven players qualified as having a career singles prop of at least .600.
These top 47, ten of whom are in the National Baseball Hall of Fame, played on 182 all-star teams and 41 world series teams. They earned six Most Valuable Player Awards, five Rookie of the Year Awards, 21 Batting Titles, 19 Silver Slugger Awards and 74 Gold Glove Awards.79 Fourteen of them have at least 250 career stolen bases. They averaged a mere 64 career home runs, ranging from nine to 182.
Nearly three-fourths of the top 47 have as their primary position either second base, shortstop, or center field. More than half played in the Second Deadball Era and its AstroTurf aftermath, which lasted from 1963 to 1984. Far fewer of the top 47 played in any of the other historical periods described in section 2.80
The days when teams willingly sacrificed power for defense and speed in their middle infielders and outfielders seem a distant memory now. One of the most striking things when watching films of games from the 1960s and 1970s is how slender—no—how skinny so many players appear because we’re now so accustomed to seeing large muscles on professional athletes. So we can think of our leaderboard as honoring the leather-flashing, sometimes speedy, mostly normal-bodied contact hitter.
With the retirement of Ichiro Suzuki in 2019, there are no active players among our top 47 leaders. One has to wonder whether this leaderboard will look any different 20 years from now. Perhaps it’s fixed, a done deal, and the names are already being chiseled into stone, like a monument honoring a bygone era when a game called baseball was played in a very different way by very different people.
Table 4
(Click image to enlarge)
NOTES
1 Anthony Castrovince, “8 Changes Fans Need to Know For the ’23 Season,” MLB, March 28, 2023, https://www.mlb.com/news/mlb-rules-changes-refresher-2023-season.
2 Harry Enten, “Why is baseball no longer America’s Game?” CNN, April 7, 2022, https://www.cnn.com/2022/04/07/sport/mlb-opening-day-baseball-popularity-spt-intl/index.html; Ari Shapiro and Enrique Rivera, “New baseball rule hopes to reverse decades of fan loss,” NPR, July 22, 2022, https://www.npr.org/2022/07/22/1113067620/new-baseball-rule-hopes-to-reverse-decades-of-fan-loss.
3 “The State of Baseball: Inside the biggest questions MLB is facing with the future of the sport at stake,” ESPN, May 10, 2021, https://www.espn.com/mlb/story/_/id/31394230/the-state-baseball-biggest-questions-mlb-facing-future-sport-stake; Dave Sheinin, “These days in baseball, every batter is trying to find an angle,” Washington Post, June 1, 2017, https://www.washingtonpost.com/graphics/sports/mlb-launch-angles-story/; Tom Verducci, “There’s a Science Behind More High-Velocity Pitches, But There’s Also a Cost,” Sports Illustrated, May 1, 2023, https://www.si.com/mlb/2023/05/01/high-velocity-pitching-what-it-means-for-mlb-pitchers; “Baseball’s ‘existential crisis’: Why pitchers are becoming more unhittable than ever,” CBS News, July 8, 2021, https://www.cbsnews.com/news/baseball-pitchers-velocity-increase/.
4 Associated Press, “Average MLB game time dropped to 2:40 with pitch clock,” ESPN, October 2, 2023, https://www.espn.com/mlb/story/_/id/38551264/mlb-game-dropped-240-pitch-clock.
5 Jesse Rogers, “Fix baseball? MLB is working on a plan,” ESPN, June 24, 2021, https://www.espn.com/mlb/story/_/id/31693901/fix-baseball-mlb-working-plan.
6 Bill James, The New Bill James Historical Baseball Abstract (New York: Free Press, 2003), 276–77, 296.
7 James, New Historical Baseball Abstract, 296.
8 James, New Historical Baseball Abstract, 120.
9 The singles proportion can be easily calculated by dividing the number of singles by the sum of hits, walks, and hit-by-pitches during a given time period. The proportion for any other on-base event (e.g., home run, walk, double) can be computed in a similar manner, by dividing the number of occurrences of that on-base event by the sum of hits, walks, and hit-by-pitches. “Major League Batting Year-By-Year Batting Averages,” Baseball Reference, https://www.baseball-reference.com/leagues/majors/bat.shtml, accessed October 22, 2023.
10 The expression of singles as a proportion of all on-base events is critical to the metric’s ability to describe how runs are being scored. Its power derives from the ratio. Thus, counting stats such as the number of singles or the number of hits are not nearly as informative. Nor are hits per game or batting average. Batting average encompasses all types of hits within the context of opportunities; as such, it’s a far better indicator of how many runs were scored than how runs were scored.
11 Jason McDonald, “What Are the Major Eras of Major League Baseball History?” Huffpost, July 4, 2013, updated December 6, 2017, https://www.huffpost.com/entry/what-are-the-major-eras-o_b_3547814.
12 James, New Historical Baseball Abstract, 120–22.
13 Joshua Mizels, Brandon Erickson, and Peter Chalmers, “Current State of Data and Analytics Research in Baseball,” Current Reviews in Musculoskeletal Medicine 15, Issue 4 (2022), 283–90, https://www.ncbi.nlm.nih.gov/pmc/articles/PMC9276858/; Jack Moore, “Baseball ProGUESTus: The Secret History of Sabermetrics,” Baseball Prospectus, July 16, 2013, https://www.baseballprospectus.com/news/article/21234/baseball-proguestus-the-secret-history-of-sabermetrics/.
14 Richard Schell, “SABR, Baseball Statistics, and Computing: The Last Forty Years,” Baseball Research Journal 40, No. 2 (Fall 2011), https://sabr.org/journal/article/sabr-baseball-statistics-and-computing-the-last-forty-years/, accessed July 25, 2024.
15 Mike Petriello, “Homers are still the key to winning in playoffs,” MLB, October 7, 2020, https://www.mlb.com/news/homers-are-still-the-key-to-winning-in-playoffs, accessed July 25, 2024.
16 Sheinin, “These Days in Baseball.”
17 Jason Chang and Joshua Zenilman, “A Study of Sabermetrics in Major League Baseball: The Impact of Moneyball on Free Agent Salaries,” Olin Blog, April 19, 2013, https://api.semanticscholar.org/CorpusID:37346410; Craig Edwards, “Positional Pricing: Paying for Power and Aces,” FanGraphs, March 11, 2015, https://blogs.fangraphs.com/positional-pricing-paying-for-power-and-aces/; Edwards, “Designated Hitter is the Highest Paid MLB Position,” FanGraphs, March 18, 2016, https://blogs.fangraphs.com/designated-hitter-is-the-highest-paid-mlb-position/; James, New Historical Baseball Abstract, 198, 220–22, 306–10, 316–17; Sheinin, “These Days in Baseball.”
18 James, New Historical Baseball Abstract, 307; Sheinin, “These Days in Baseball.”
19 Dave Sheinin, “Velocity is Strangling Baseball—and Its Grip Keeps Tightening,” Washington Post, May 21, 2019, https://www.washington-post.com/sports/2019/05/21/velocity-is-strangling-baseball-its-grip-keeps-tightening/; Sheinin, “These Days in Baseball”; Ben Clemens, “How Bigger Bullpens are Constraining Offense,” FanGraphs, April 26, 2022, https://blogs.fangraphs.com/how-bigger-bullpens-are-constraining-offense/; Tyler Kepner, “Velocity School: Where Pitchers Pay to Throw Harder,” The New York Times, September 14, 2017, https://www.nytimes.com/2017/09/14/sports/baseball/mlb-velocity-pitchers.html; Verducci, “There’s a Science Behind More High-Velocity Pitches.”
20 James, New Historical Baseball Abstract, 145, 198, 220–22, 306.
21 “Player Batting Season & Career Stats Finder,” Stathead Baseball, https://stathead.com/baseball/.
22 “Major League Batting Year-By-Year Batting Totals,” Baseball Reference, https://www.baseball-reference.com/leagues/majors/bat.shtml.
23 Bill James once described the trends toward more homers and more strikeouts as cyclical. (James, New Historical Baseball Abstract, 316.) In the short term that may be true, but certainly not in the long term.
24 Singles still produced 27% of all RBIs in 2022, for example. https://www.retrosheet.org/; https://www.kaggle.com/datasets/jraddick/baseball-events-from-retrosheetorg.
25 Koby Close, “Part 1: Investigating Major League Baseball’s Home Run Problem,” LinkedIn, September 26, 2019, https://www.linkedin.com/pulse/part-1-investigating-major-league-baseballs-home-run-koby-close-eit/.
26 This effort was inspired by Bill James’ attempt to identify historical events that divide the history of major-league baseball into distinct eras. He ended up identifying 366 such events falling into 10 broad categories, and concluding that stadium architecture and game equipment were “the two largest dynamics of change in baseball.” Bill James, “Dividing Baseball History into Eras,” Bill James Online, June 10, 2012, https://web.archive.org/web/20230930165226/https://www.billjamesonline.com/dividing_baseball_history_into_eras/; James, New Historical Baseball Abstract, 276.
27 Alan Schwarz, “The History of Rule Changes,” ESPN, February 4 (2003), https://www.espn.com/mlb/columns/schwarz_alan/1503763.html; James, New Historical Baseball Abstract, 120–22.
28 Tommy Craggs, “Was MLB’s Juiced Era Actually a Juiced-Ball Era?” Deadspin, August 29, 2012, https://deadspin.com/was-mlbs-juiced-era-actually-a-juiced-ball-era-5937432; James, New Historical Baseball Abstract, 145.
29 James, 250.
30 Jimmy Stamp, “The Invention of the Baseball Mitt,” Smithsonian Magazine, July 16, 2013, https://www.smithsonianmag.com/arts-culture/the-invention-of-the-baseball-mitt-12799848/; Jim Daniel, “#Goingdeep: The Evolution of Baseball Gloves,” National Baseball Hall of Fame, https://baseballhall.org/discover/going-deep/the-evolution-of-baseball-gloves.
31 James, New Historical Baseball Abstract, 145.
32 Zachary D. Rymer, “The Evolution of the Baseball From the Dead-Ball Era Through Today,” Bleacher Report, June 18, 2013, https://bleacherreport.com/articles/1676509-the-evolution-of-the-baseball-from-the-dead-ball-era-through-today; Craig Calcaterra, “Today in Baseball History: ‘Balata Ball’ Threatens a New Dead Ball Era,” NBC Sports, May 4, 2020, https://www.nbcsports.com/mlb/news/today-in-baseball-history-balata-ball-threatens-a-new-dead-ball-era.
33 Rocco Constantino, “The Top 200 Moments That Shaped MLB’s History,” Bleacher Report, May 17, 2012, https://bleacherreport.com/articles/1157233-200-events-that-defined-shaped-and-changed-major-league-baseball/.
34 James, New Historical Baseball Abstract, 198.
35 Schwarz, “The History of Rule Changes.”
36 James, New Historical Baseball Abstract, 220, 222, 249.
37 Brian L. Lokker, “History of MLB Expansion Teams and Franchise Moves,” How They Play, August 21, 2023, https://howtheyplay.com/team-sports/major-league-baseball-expansion-and-franchise-relocation; Mark Armour, “The Effects of Integration, 1947–1986,” Baseball Research Journal 35 (2007), https://sabr.org/journal/article/the-effects-of-integration-1947-1986/; Mark Armour and Daniel R. Levitt, “Baseball Demographics, 1947–2012,” Society for American Baseball Research, https://sabr.org/research/article/baseball-demographics-1947–2012/; Armour and Levitt, “Baseball Demographics, 1947–2016,” Society for American Baseball Research, https://sabr.org/bioproj/topic/baseball-demographics-1947-2016/.
38 Steve Treder, “Re-Imagining the Big Zone Sixties, Part 1: 1963–1965,” Hardball Times, November 30, 2004, https://tht.fangraphs.com/re-imagining-the-big-zone-sixties-part-1-1963-1965/.
39 “Strike Zone,” MLB, https://www.mlb.com/official-information/umpires/strike-zone; “The Strike Zone: A History of Official Strike Zone Rules,” Baseball Almanac, https://www.baseball-almanac.com/articles/strike_zone_rules_history.shtml.
40 James, New Historical Baseball Abstract, 250, 276.
41 Schwarz, “The History of Rule Changes”; Constantino, “The Top 200 Moments.”
42 James, New Historical Baseball Abstract, 276.
43 McDonald, “What Are the Major Eras.”
44 Craggs, “Was MLB’s Juiced Era Actually a Juiced-Ball Era?”
45 Craggs; Rymer. Numerous analysts speculate about changes in the ball in 1977. Although technically the only change in 1977 was to the name from Spalding to Rawlings, some slight incidental change in the manufacturing process, coinciding with Rawlings beginning to apply its own trademark logo (as well as separate, distinctly colored logos for the National and American Leagues), may have unwittingly caused the singles prop to drop significantly in 1977. (See https://thinkbluela.com/2018/08/rawlings-puts-the-ball-in-baseball-3/for photos of the two 1977 Rawlings balls.) Many times Rawlings and MLB have insisted that balls are being manufactured to the same specs, only to later acknowledge, based on scientific findings, that different batches of balls can have different properties that impact carry and drag. It’s possible that even changing what’s stamped on the baseball could alter its properties.
46 James, New Historical Baseball Abstract, 277.
47 Constantino, “The Top 200 Moments.”
48 “Strike Zone,” MLB.
49 Bill James, “The Three-Man Starting Rotation,” Bill James Online, November 20, 2015, https://web.archive.org/web/20230930164809/https://www.billjamesonline.com/the_three_man_starting_rotation/.
50 James, New Historical Baseball Abstract, 297, 307.
51 Armour and Levitt, “Baseball Demographics, 1947–2012;” Armour and Levitt, “Baseball Demographics, 1947–2016.”
52 Taylor Bechtold, “State of Analytics: How the Movement Has Forever Changed Baseball—For Better or Worse,” Stats Perform, https://www.statsperform.com/resource/state-of-analytics-how-the-movement-has-forever-changed-baseball-for-better-or-worse/.
53 Craggs, “Was MLB’s Juiced Era Actually a Juiced-Ball Era?” Ben Lindbergh, “How Much of a Role Did Steroids Play in the Steroid Era?” The Ringer, September 28, 2018, https://www.theringer.com/mlb/2018/9/28/17913536/mark-mcgwire-sammy-sosa-steroid-era-home-run-chase.
54 Armour and Levitt, “Baseball Demographics, 1947–2012;” Armour and Levitt, “Baseball Demographics, 1947–2016.”
55 “The Strike Zone,” Baseball Almanac.
56 James, New Historical Baseball Abstract, 307–09, 322–23.
57 Zachary D. Rymer, “Full Timeline of MLB’s Failed Attempts to Rid the Game of PEDs,” Bleacher Report, June 10, 2013, https://bleacherreport.com/articles/1667581-full-timeline-of-mlbs-failed-attempts-to-rid-the-game-of-peds.
58 Lindbergh, “How Much of a Role.”
59 Bechtold, “State of Analytics”; Steven Bratkovich, “The Bats…They Keep Changing!” Baseball Research Journal 47 (Spring 2018), https://sabr.org/journal/article/the-bats-they-keep-changing/.
60 Brian Mills, “Expert Workers, Performance Standards, and On-the-Job Training: Evaluating Major League Baseball Umpires,” SSRN, August 27, 2014, https://ssrn.com/abstract=2478447; Bob Nightengale, “Yer Out! 3 Umps’ Bosses Get Thumb Over Bum Calls,” USA Today, March 8, 2010, 1C.
61 Mills, “Expert Workers.”
62 Research by Jon Roegele made similar findings and drew similar conclusions using somewhat different methodologies. Jon Roegele, “The Strike Zone During the PITCHf/x Era,” Hardball Times, January 30, 2014, https://tht.fangraphs.com/the-strike-zone-during-the-pitchfx-era/.
63 Joe Lemire, “Why Baseball’s Strike Zone Is Changing,” Vocativ, May 23, 2016. (Article no longer online.)
64 Jim Albert et al., “Report of the Committee Studying Home Run Rates in Major League Baseball,” MLB via Inside SoCal, May 24, 2018, https://www.insidesocal.com/dodgers/files/2021/10/Full-Report-of-the-Committee-Studying-Home-Run-Rates-in-Major-League-Baseball_052418.pdf.
65 Joe Lemire, “MLB Research Determines Reduced Drag Boosted Home Run Surge,” Sports Business Journal, May 25, 2018, https://www.sportsbusinessjournal.com/Daily/Issues/2018/05/25/Technology/mlb-baseball-research-home-run-drag-aerodynamics.aspx.
66 Zach Kram, “How the Baseball Became an Unreliable Narrator,” The Ringer, December 16, 2019, https://www.theringer.com/year-in-review/2019/12/16/21023481/juiced-dejuiced-ball-home-runs-investigation.
67 Kyle Glaser, “Study Concludes Seam Height Changes Contributed to 2019 Home Run Spike,” Baseball America, December 11, 2019, https://www.baseballamerica.com/stories/study-concludes-seam-height-changes-contributed-to-2019-home-run-spike/.
68 Jay Jaffe, “The Home Run Committee’s Latest Report Isn’t the Final Word on Juiced Baseballs,” Fangraphs, December 12, 2019, https://blogs.fangraphs.com/the-home-run-committees-latest-report-isnt-the-final-word-on-juiced-baseballs/.
69 Matt Borelli, “MLB Rumors: Only Baseballs Manufactured After 2021 Production Change Being Used For 2022 Season,” Dodger Blue, April 28, 2022, https://dodgerblue.com/mlb-baseballs-manufactured-after-2021-production-change-being-used-for-2022-season/2022/04/28/. Before the 2022 season, MLB made yet another change that impacted the properties of the ball. All 30 MLB teams were required to store their baseballs in a humidor at a specified humidity and temperature prior to games. By doing so, MLB hoped to reduce inconsistencies between balls used in different locales, as both humidity and temperature affect the distance the ball travels. (David Kagan, “The Physics of Cheating Baseball’s Humidors,” Hardball Times, June 3, 2019, https://tht.fangraphs.com/the-physics-of-cheating-baseballs-humidors/.) The overall impact of the humidor requirements on league performance is not clear. For one thing, parks that are normally less humid than the standard would be affected differently than parks that are more humid than the standard. Plus, the number of variables involved makes it difficult to isolate cause and effect. (Zach Crizer, “These Nine MLB Ballparks are Using Humidors. What Does It Mean for Baseball’s Offensive Downturn?” Yahoo Sports, June 8, 2021, https://sports.yahoo.com/these-9-mlb-ballparks-now-use-humidors-complicating-the-sports-pursuit-of-big-changes-162450868.html.)
70 MLB points to a five-point increase in batting average as evidence that rule changes implemented in 2023 are helping bring more action back into the game. (Tom Stone, “The Impact of the 2023 Rule Changes on MLB Statistics in Historical Context,” Now Taking the Field, October 14, 2023, https://nowtakingthefield.substack.com/p/the-impact-of-the-2023-rule-changes.) But at least a part of this increase can be attributed to MLB instructing official scorers to rule batted balls to be hits rather than errors except in the most obvious cases. (Bob Nightengale, “David Cone Recalls Short-Lived Writing Career,” USA Today, June 5, 2023, 7C.) In any case, the singles proportion is a better measure of action on the field than batting average because it places singles in the context of all on-base events. When the singles proportion rises, the home-run proportion and strikeouts per game fall. Fewer home runs and strikeouts necessarily leads to more action occurring on the field. In 2023, however, the singles proportion fell. The five-point increase in batting average is misleading if interpreted to mean more balls are being put in play.
71 Jaffe, “The Home Run Committee’s Latest Report.”
72 Taylor Bechtold, “State of Analytics.”
73 Sheinin, “These Days in Baseball.”
74 Taylor Bechtold, “State of Analytics.”
75 Jan Onofrio, Oklahoma Biographical Dictionary (St. Clair Shores: Somerset Publishers, 1999), 215–16.
77 Nate Silver, “Relievers Have Broken Baseball. We Have a Plan to Fix It.,” FiveThirtyEight, February 25, 2019, https://fivethirtyeight.com/features/relievers-have-broken-baseball-we-have-a-plan-to-fix-it/; Ben Lindbergh, “How Can MLB Fix Its Too-Many-Pitchers Problem?,” The Ringer, May 2, 2022, https://www.theringer.com/mlb/2022/5/2/23052714/pitcher-roster-rules-limit; Russell A. Carleton, The New Ballgame: The Not-So-Hidden Forces Shaping Modern Baseball (Chicago: Triumph Books, 2023), 138–39.
78 Pete Palmer, “Relief Pitching Strategy: Past, Present, and Future?,” Baseball Research Journal 40, No. 1 (2018), 45–52.
79 Note that the careers of some players on the leaderboard predate at least some of the awards. The MVP Award began in 1931, All-Stars were selected beginning in 1933, Rookie of the Year began in 1947, Gold Glove in 1957, and Silver Slugger in 1980. Abbreviations appearing in the Honors column of the Leader Board signify the following: HoF is Hall of Fame, MVP is Most Valuable Player, AS is All-Star, WS is World Series, RoY is Rookie of the Year, GG is Gold Glove, SS is Silver Slugger, BT is Batting Title, and TSNPoY is The Sporting News Player of the Year, which began in 1936.
80 A player was considered to have played in a given historical period if he played at least one-third of his career during the period, or he played at least half the length of the period. Thus, some players were considered to have played in multiple periods.