

Another Perspective on ‘Fair Ball’: Disputing the Costas Analysis
This article was written by Michael D. McDermott
This article was published in 2001 Baseball Research Journal
Say a prayer for baseball’s competitive balance. The topic is discussed strictly to be mourned or vilified. Testifying to the Senate Judiciary Committee on November 21, 2000, Commissioner Bud Selig warned, “At the start of spring training, there no longer exists hope and faith for the fans of more than half our thirty clubs. “1 Syndicated columnist George Will writes ominously of how “today’s gargantuan revenue disparities produce ludicrous payroll disparities and competitive imbalance.”2
These people and others point with particular horror to the 1998 season, during which the Yankees piled up 114 regular season victories while the Florida Marlins imploded and lost 108 games. They also are quick to pounce on the 2000 Subway Series as an other grim example of the phenomenon. Belief in competitive imbalance has metastasized into baseball’s version of political correctness, an unquestioned dogma shared almost universally by baseball people and the sports journalism establishment. Although there are some scattered dissenting voices, such as Joel Sherman of the New York Post, they are a distinct and ignored minority.
The most potent restatement of this theme is the recent book by the distinguished sportscaster and SABR member Bob Costas: Fair Ball: A Fan’s Case for Baseball (released in paperback in April 2001).
I happen to believe that as an interpretation of baseball history, belief in competitive imbalance is utterly wrong-headed. To the extent that it will inform the impending debate surrounding baseball’s new Basic Agreement, it could be downright dangerous.
Defining Deviancy Downward
In the 1983 edition of his groundbreaking Baseball Abstract books, Bill James wrote a lengthy essay identifying and defending a concept he called the law of competitive balance. More a series of objective observations than a theory, the law of competitive balance asserts that, in sports as well as in life, there is a natural tendency that narrows the gap between the winners and losers and the best and worst. If a hitter’s batting average rises from .289 one season to .360 the next, it will likely decline in the third season. If a football running back rushes for 2,000 yards one year, he will likely rush for fewer the next. Historians and political scientists will tell you that now that George W. Bush has been elected president, the Democrats will rebound and gain seats in Congress in 2002. Schoolteachers will tell you that the kid who scores 100 percent on the first quiz of the semester will probably decline on the second quiz, while the kid who scores only 68 percent on the first will probably improve on the second.
Here is the law of competitive balance in James’s own words:
“The law of competitive balance … is a way of making sense of some observable facts. Its essential claim is that there exists in the world a negative momentum far more powerful than positive momentum, which acts constantly to reduce the differences between strong teams and weak teams, teams which are ahead and teams which are behind, or good players or poor players.”3
We were already several years into the free agent era when James went public with his ideas. He pointed out that the gloom-and-doom scenarios of the rich getting richer and the poor poorer were not bearing fruit. In fact, his research indicated that the precise opposite trend was in motion, pointing out that the standard deviation in victories among major league teams actually declined slowly but steadily between 1978 and 1982.
(I am well aware that Costas lists Bill James in his book’s Acknowledgments. If James has recently changed his tune on this issue, he is mistaken and the proof is on these pages. James does have a generous history of supporting people he does not necessarily agree with.)
In statistical parlance, a standard deviation is a “measure of dispersion.” It is calculated to assess how close a given set of numbers clusters together. If someone were to tell you that the standard deviation in victories among big-league teams was 14.7 in 1969, that fact, by itself, would probably mean nothing to you. But if you were then told the standard deviation declined to 12.3 in 1970, that would give you an immediate sense of the trajectory all or most of the teams were taking. As standard deviations trend downward, that indicates the elements are converging closer to the “mean” or average, narrowing the gap between the best and worst. As standard deviations trend upward, that indicates the elements are polarizing, breaking away from the mean, increasing the gap between the best and worst.
Inspired by James’ original research and eager to see how well the law of competitive balance has held up in recent years, l devised a study of my own. It is generally agreed that the “modern” era of major league baseball began in 1901. So I calculated standard deviations in regular-season wins at five-year intervals between 1905 and 1990 (except 1945, which was a war year; I used 1946 instead). I also included standard deviations for all six expansion seasons and year-by-year standard deviations between 1995 and 2000. The results are presented in Chart 1.
Despite occasional blips and spikes, there was a steady overall decline in standard deviations throughout the twentieth century. You may notice sharp upsurges in 1961, ’62, ’77, ’93, and ’98. These took place for an obvious reason: expansion. Everyone knows that first-year expansion teams are wretchedly bad. The established teams stomp on them, thereby destabilizing competitive balance, thereby driving up the standard deviation.
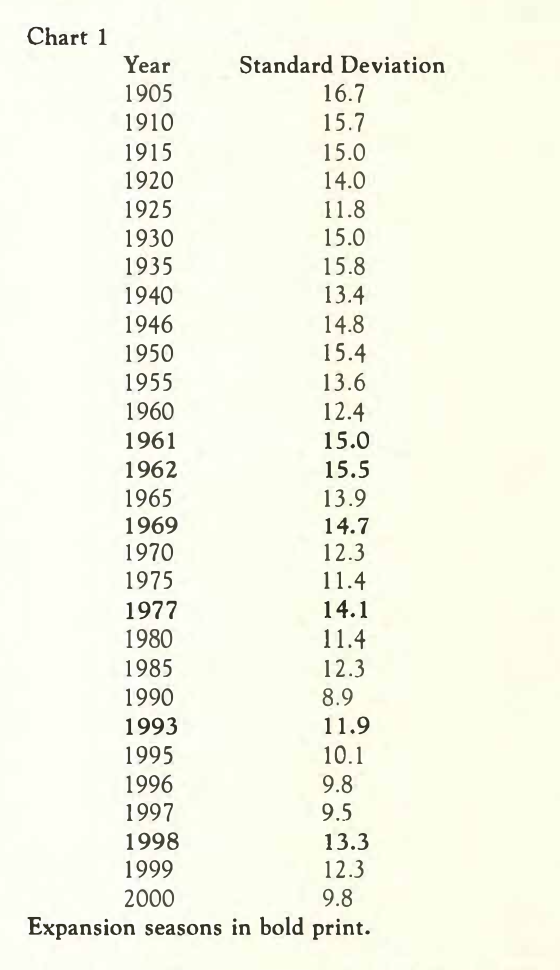
But the law of competitive balance is a persistent little bug. Chart 1 also shows that expansion’s destabilizing impact is always short-lived. By 1965, the standard deviation dropped to 13.9, which was lower than it was in 1950. By 1975, six years after both leagues expanded again, it was down to 11.4, and that despite the resounding success of the Big Red Machine that year. The pattern is remarkably consistent: Every time one of the leagues expands, the standard deviation briefly flares up, then gently glides back down.
Competitive balance has been alive and well and arguably better than ever in recent years. The standard deviation actually plunged to historic lows at points in the previous decade. Moreover, the 13.3 standard deviation of 1998 is not terribly high by historical standards. As the law of competitive balance would have predicted, it dropped to 12.3 in 1999 (the same perch it occupied in 1970 and 1985) and to just 9.8 in 2000. Unless the goal is to cut the standard deviation to zero and have everyone go 81-81, competitive balance has rarely been better than this.
An important subheading of the law of competitive balance is something James called the “70/50 Rule.” The first half of the rule asserts that about 70 percent of teams with winning records in a given season will tend to decline in the following season, while about 70 percent of losing teams will tend to improve. Lo and behold, ten of the twelve teams with winning records in 1999 declined in 2000; twelve of the eigh teen losing teams improved. Overall, twenty-two of the thirty teams reversed course. That equals 73 per cent, which accords beautifully with James’s 70 percent figure.
The second half of the 70/50 Rule holds that most of these rises or declines will bring a team 50 percent closer to .500. Applied to the 1998 Yankees, who won 114 games, such a team should drop to 97 or 98 wins (halfway between 114 and 81) the next season; in fact, the ’99 Yankees won 98 games. A team winning 98 games will tend to drop to 89 or 90 wins in the follow-up year; the 2000 Yankees won 87 games. The gap between the Yankees and the Florida Marlins in 1998 was a whopping 60 games; in just two years, the law of competitive balance chopped it to eight games.
All well and good, the skeptic may respond, but the damn Yankees still went out and won another World Series, right? Indeed they did. But whereas the ‘ 98 and ’99 Yankees can be legitimately compared to the great teams in history, the 2000 Yankees bear a suspicious resemblance to teams like the 1985 Royals or the 1987 Twins-champions who were very lucky, not very good. The Yankees would never have made the playoffs at all but for a quirk in the American League alignment, which permitted them to finish first in a mediocre division while the Indians went home for the winter despite winning 90 games. (At only 87-74, the Yankees were one of the worst first-place teams in history. The Mets had only the fourth best record in the National League.)
Take a good close look at the rubber game of the 2000 Division Series. When it boils down to playing one game, bizarre events may transpire. What happened this time was that Terence Long lost Tino Martinez’s fly ball in the Oakland twilight, allowing what proved to be the winning runs to score. If Long makes that catch, either the A’s or Mariners advance to the World Series. One botched defensive play in the postseason should not obscure an entire regular season of exceptionally good competitive balance.
Looking back on the early years of free agency, Costas makes an interesting observation that is far more telling than he realizes. As he sees it, the late ’70s, ’80s and even the early ’90s were the halcyon days for competitive balance. “Despite the wailings of Chicken Little types, free agency-at least at first actually enhanced competitive balance, improved the game, added excitement and life to it.”4
What a deadly concession that is. The standard deviation declined from 14.1 in 1977 to 11.4 in 1980, whereas it declined from 13.3in 1998 to 9.8 in 2000. Either both eras were characterized by good competitive balance or neither was.
Anecdotal Evidence
Those who fret over competitive balance make the laughable assumption that large markets are unalloyed sweetness and light. Costas scrupulously details how teams in the largest markets take in more local cable and broadcast revenue, but that only focuses on one side of the ledger. The large market teams may have larger revenue sources, but they also pay higher taxes, incur higher expenses, and cope with a higher cost of doing business. New York is not famous for being a low-cost city. Should not these factors also enter the equation?
There are obvious “quality of life” issues chat also hurt the large markets. The lure of less pressure, less scrutiny, and a lower tax bite, if his accountant had a say in the decision, convinced Mark McGwire to stay in St. Louis rather than jump to Anaheim or Los Angeles. Similar considerations led Junior Griffey to thumb his nose at the Mets and Juan Gonzalez to veto a trade to the Yankees. Such are comparative advantages that well-run medium market teams can exploit and have exploited. To some extent, the large market teams need that extra revenue. (In fairness to Costas, his proposals would allow the big market teams to continue to take in relatively high local media revenue.)
Another ludicrous assumption enjoying wide currency is the belief that Cleveland, Atlanta, and Baltimore are among the large markets while Minnesota, Miami and Pittsburgh are among the small markets. A look at the most recent US Census data, available in 1997, refutes that view. The population of the “large market” Cleveland metropolitan area is 2.9 million people; the population of the “small market” Minneapolis-St. Paul metropolitan area is 2.8 million people. The population of “large market” Greater Atlanta is 3.6 million; the population of “small market” Greater Miami is 3.5 million. Greater Baltimore has a population of 2.4 million; Greater Pittsburgh’s is 2.3 million. To be sure, metro Baltimore could be classified as a true large market if you attach it to the nearby Washington D. C. metro area. Doing so creates the fourth largest metropolitan area in America (7.2 million people). The bad news for believers in large market/small market disparities is that the Orioles have been terrible of late: 2001 was their fourth straight losing season.5
We know what the Mets and Yankees have done. In fact, we may never hear the end of it. But what about the teams in the other big markets: Los Angeles, Chicago and Philadelphia? The Dodgers have not won a postseason game since Game 5 of the 1988 World Series. Sharing the second largest market in the country with the Dodgers, the Anaheim Angels have not gone to the playoffs since 1986. The White Sox have not gone to a World Series since Dwight Eisenhower was president and the Cubs have not gone to one since Harry Truman was. Playing in the fifth largest central city and sixth largest metro area in the country, the Phillies have one pennant to show for the last seventeen years.
As a fallback position, Costas and company would stand on more plausible ground if they relinquished this discredited “large market/small market” disparity and focused instead on a “large payroll/small payroll” disparity. Such a disparity is real, but far from reflecting a systemic meltdown of baseball’s competitive balance; there is an obvious element of self-selection behind it. In recent years, there have been medium market teams with big payrolls (the Indians, the Diamondbacks) and large market teams with small payrolls (the Phillies, the White Sox).
The ups and downs of the San Diego Padres in the ’90s are a compelling illustration of this point. In 1992 the Padres contended for the National League West title until a late-season fade eliminated them. Management embarked on a fire sale the following winter not unlike that of the post-1997 Marlins, dumping salaries and giving away people like Gary Sheffield, Fred McGriff and Tony Fernandez. Predictably, the team crashed, burned and lost 101 games the next year. After that traumatic 1993 season, the Padres had every symptom of a helpless “small market” team that had “no chance” to contend again. Yet the franchise regrouped under smart new ownership, won a division title by 1996, and returned to the World Series by 1998.
In Costas’s lurid universe of entrenched competitive imbalance, the revival of the Padres should never have happened-but it did. Yes, the Padres relapsed in 1999-just as championship teams throughout history have returned to earth the year after winning a pennant.
Costas loathes the wild card. His proposal to abolish it and have the second- and third-best division champions in each league face each other in the first round, while giving the best team in each league a bye, has advantages to recommend it. But in his opposition to the wild card, Costas resorts to some misleading arguments. Citing the list of wild card teams between 1995 and 1999, he wonders, “Where, pray tell, are the small- and middle-market teams? … The evidence is clear: The wild card is a helping hand for the Haves.”6
That misstates the issue. Aside from the obviously greedy purpose of creating extra rounds of playoffs for extra revenue, another purpose of realignment (in 1969 as well as 1994) was to create more races and therefore more opportunities for weaker teams to compete-opportunities, not guarantees. Moreover, in his original article on the law of competitive balance, Bill James presented a chart detailing the percentage of teams finishing within ten games of first place in the first five years of each decade from the early 1900s to the early 1970s. I updated the chart to include the early 1980s (excluding 1981) and the late 1990s; the results are in Chart 2.
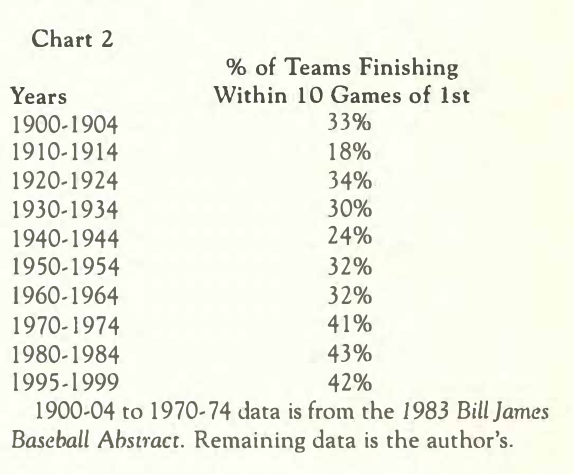
Chart 2 is powerful confirmation of the point made by Chart 1; the two are mutually reinforcing. The percentage of teams finishing within ten games of first place has hovered in the low forties throughout the divisional era. Including teams finishing within ten games of the wild card, the 1995-99 figure rises to an unprecedented 50 percent: excellent balance.
Yet another gospel in the theology of baseball’s endangered competitive balance is the claim that there is vastly superior parity in the NBA. Costas is impressed by the fact that the NBA has some franchises in medium markets that lack baseball teams, and that some of them seem co win on occasion. “[W]hat do these cities have in common: Sacramento, Portland, Indianapolis, and Salt Lake City? Not only do they all have NBA franchises, they all have contending teams… Fans of every NBA team …have reason to believe they have a chance to win …”7
There is less to that claim than meets the eye. In the ’90s (1990-91 to 1999-00) each NBA team played 788 regular season games, or nearly the equivalent of five baseball seasons of 162 games apiece. In that span, the ”contending” Sacramento Kings posted a .402 winning percentage, analogous to a baseball team losing about 95 games per year for five years. They did indeed squeak into the NBA playoffs in 1999 and 2000 (as if that were an accomplishment). ls it so “unthinkable” to envision a successful baseball team in Indianapolis or Portland? The Cincinnati Reds-winners of a World Series in 1990, a division title in 1995, and 96 games in 1999-play in a metropolitan area of 1.9 million people, compared to, say, the Indianapolis metro area of 1.5 million, and which is actually smaller than that of Portland (2.1 million).8
How about the Dallas Mavericks? They went through the ’90s without a single winning season not one. Their aggregate winning percentage was only .303, analogous to a baseball team averaging 110 losses per year for five years. How did that happen, if the NBA’s competitive balance is so marvelous? It would be a safe assumption to say the Royals, Brewers, Twins, Pirates and Expos have not scraped that depth in quite a while.
At the other end of the NBA’s recent spectrum are the Chicago Bulls-a large market monster if ever there was one. You might remember them; they won six titles in eight years and might well have won eight in a row had Michael Jordan not decided to flail at curveballs for two years. They posted an aggregate .660 winning percentage in the ’90s-comparable to a baseball team averaging 106 wins per season for five seasons. By the way, the NBA boomed throughout that period. If there is a greater perception or expectation of parity in the NBA, it is nourished by the league ‘s perpetual playoffs, not by a demonstrably superior balance of power on the court.
Costas, Selig, and Will are shocked-shocked-by data showing that only three of 189 postseason baseball games between 1995 and 2000 were won by teams that had payrolls in the bottom half of the league. Okay … isn’t that more or less to be expected? In the NBA, as Peter Vecsey noted in a recent New York Post article, the Final Four teams in the 2000 playoffs also just happened to have the top four payrolls in their own league.9 All that this proves, in either spore, is that good players tend to make more money than bad players.
Modest Proposals
Costas unfolds an entire shopping list of proposals. The fact that the rationale behind them is mistaken or overblown does not necessarily discredit them.
Here are the two highlights: first, minimum team payrolls equal to the per-team average of TV revenue and maximum payrolls no higher than twice that figure. Second, a “superstar salary cap” to limit any single player’s salary to one-quarter of the minimum team payroll or one-eighth of the maximum payroll. Costas is certainly right that imposing a ceiling on payrolls is unacceptable unless it is accompanied by a floor on payrolls as well. Although the proposed limits sound rather light, I would actually agree with Costas that the general idea is worth exploring, but for a different reason: it would inject accountability into the system. A mismanaged franchise could no longer scapegoat Steinbrenner or Ted Turner for its own ineptitude or sloth.
Meeting a salary floor must be a condition to qualify for revenue sharing. If there is going to be revenue sharing, there have got to be strings attached. Indeed, a case can be made that unconditional revenue sharing actually worsens competitive balance by subsidizing failure. Look at the Bengals and Cardinals in the NFL. With characteristic bluntness, Whitey Herzog warns against such NFL-style revenue sharing. “In the NFL, you have owners who are guaranteed huge revenue even if their teams never throw a pass… The NFL rewards people for being lazy and stupid. So that’s out.”10
We should also beware of any one-size-fits-all proposal. The Tampa Bay Devil Rays, operating in a region with a relatively low cost of living and in a state with no income tax, should not be held to the same financial standard as the Mets or Yankees. A team in New York should be permitted a higher maximum payroll than most others. By the same token, a team in Tampa Bay should be permitted to meet a lower minimum payroll to qualify for revenue sharing. Payroll limits at both ends of the spectrum could be a good thing, but the devil is in the details.
The “superstar salary cap,” on the other hand, is, I think, a deplorable idea. Philosophy aside, it seems redundant if you already are imposing a ceiling on payrolls. Even in the absence of such a ceiling, a superstar salary cap does not address the real problem. The most overpaid players are not the A-Rods or Derek Jeters, but the Bobby Bonillas and the David Cones. As we know from the research of Bill James, Pete Palmer and others, a typical athlete’s value takes a steep plunge after the age of thirty, and just about all athletes display their rust by thirty-two or thirty three. The most overcompensated player is one who signs an eternal contract in his late twenties or early thirties. Suddenly he is further into his thirties, falling out of shape, becoming more injury-prone, playing like dog meat, but still drawing the salary of a stud in his twenties.
So rather than seeking an annual salary cap, why not seek what I call a “term cap” on contracts instead? No player between the ages of twenty-eight and thirty-one should be permitted to sign a contract running more than four seasons; no player between thirty-two and thirty-four should be allowed to sign for more than three seasons; no player thirty-five or over should be allowed to sign for more than two seasons. The beauty of a term cap is that it would tie an aging player’s salary more closely to what his value is today, not to what it was four years ago. It would also create a glut of aging players on the free agent market, which would exert downward pressure on salaries. Economics 101: As the supply of a commodity increases relative to demand, the price tends to drop.
I would actually go one step beyond Costas and propose the utter, total and complete abolition of arbitration. Salary arbitration-salary abomination is a better description-is the most combustible element fueling salary inflation. At least free agency possesses some semblance of the checks and balances of supply and demand; there is nothing self-correcting about arbitration. Costas’s proposal to impose a “graduated scale” on arbitration awards just tinkers with a fundamentally flawed process. Dispose of it altogether. In exchange for that, we can implement another one of his proposals. Allow players to become free agents two years earlier. But go one step further: Allow them to become “unrestricted” free agents two years earlier. Recalling Economics 101, it becomes clear that abolishing arbitration and opening the doors to free agency sooner would call the bluff of the Players Association. For the past generation, Marvin Miller and Donald Fehr have claimed that all they seek for their clients is the same “freedom” that other employees enjoy. Give them some, then see how they like it.
During an appearance on the Charlie Rose Show on PBS to promote the hardcover release of Fair Ball, Costas remarked that there are more owners than ever in a fighting mood. l believe it. More and more mega-corporations have swallowed sports franchises in recent years. In the real world in the last quarter century, corporate America has waged what author and political pundit Michael Lind has described as a “low-key, bipartisan class war” against the wage-earning middle class in terms of declining union membership, declining fringe benefits and (until very recently) declining wages.11
The new breed of corporate owners now brings this confrontational attitude into the sports world. They have little or no institutional memory of the principles that were at stake in the Flood vs. Kuhn Supreme Court case in 1971 or in the legal rulings from the mid-1970s that broke down the indentured servitude enshrined in the old Reserve Clause. All they know is that if they can tell the AFL-CIO to go pound sand, then maybe they can tell the same to the Major League Baseball Players Association (which is interesting since the MLBPA is probably the strongest private sector union in America).
The key variable, the X factor, in the upcoming battle over baseball’s new Basic Agreement will be the hearts and minds of rank-and-file baseball fans. The fatal flaw in Fair Ball is that by recycling and legitimizing the central myth peddled by the owners-that baseball’s competitive balance is destroyed and therefore “something” must be “done” about it-Costas misinforms and disorients the public and unwittingly fans the flames of ownership militancy. For all of its sometimes trenchant criticisms of the wild card and of Selig’s counter productive “radical realignment” scheme and of that hideous behind-the-plate advertising blighting stadiums from coast to coast, Fair Ball ultimately poses no threat to the corporate lords of baseball. A few of them may also have something more radical and heavy-handed up their sleeves than Costas himself ever contemplated.
For all of Costas’s thoughtfulness, integrity, and good intentions, the ironic upshot of Fair Ball could be to make another 1994-style train wreck more likely, not less, and that cannot be good news for anyone concerned about the state of the game.
Notes
1. “Selig Tells Senate Panel Money Gap Is Widening,” AP report, Long Island Newsday, November 22, 2000, p. 89.
2. George Will, “Oh Swell: New York Wins Again,” Newsweek, Oct0ber 30, 2000, 104.
3. Bill James, 1983 Bill James Baseball Abstract (New York: Ballantine Books, 1983), 12.
4. Bob Costas, Fair Ball: A Fan’s Case for Baseball, (New York: Bantam Doubleday Dell, 2000), 37.
5. census.gov.
6. Costas, Fair Ball, 142.
7. Ibid., p. 53.
8. census.gov.
9. Peter Vecsey, “Nets’ Search Down to Four,” New York Post, May 30, 2000, 78
10. Whitey Herzog, You’re Missin’ a Great Game (New York: Berkley Books, 1999), 286-287.
11. Michael Lind, The Next American Nation: The New Nationalism and the Fourth American Revolution (New York: Simon and Schuster, 1995), p. 101.