

Are Traded Players ‘Lemons’?
This article was written by Phil Birnbaum
This article was published in 2005 Baseball Research Journal
The theory of the “market for lemons” shows that in this situation, where buyer and seller have asymmetric information, there will be a much larger proportion of lemons for sale. The reason: anyone with a lemon will have incentive to sell it, since the buyer won’t know it’s a lemon and may pay more than what it’s worth. Similarly, the owner of a cherry has no way of proving to the buyer that it is indeed worth more than average, and is therefore more likely to hang on to it.
The result is that when sellers have more information than buyers, the overall quality of goods for sale is lowered, since there is no possibility of getting full value for high-quality goods.
Which leads to the question: if this is true for Chevrolets, is it also true for baseball players? A team that trades a player can be assumed, perhaps, to have more information about the player than the team trading for him. While both have access to the player’s season and career statistics, the trading team might know his arm has been hurting lately, or his attitude isn’t what it should be, or that he’s not keeping himself in shape the way he used to. According to the lemon theory, we should find that, on average, traded players won’t turn out to be as good as their statistics suggest. This study attempts to see if that’s really the case.
The Study
How can we tell, in retrospect, if a traded player wasn’t as good as we thought he was? I tried to measure this by using Bill James’s “Favorite Toy.” The Favorite Toy (TFT) is a method for estimating the probability of a player achieving a certain future goal (for instance, 3,000 hits). If the lemon theory applies to ballplayers, then traded players as a group should be less likely to reach a TFT goal than players who were not traded.
So what I did was this: for all players from 1901 to 1975, I found qualifying players who changed teams during or after one of those years; 1975 was chosen because prior to 1975, it can safely be assumed that players would change teams only as a result of being traded or sold.
For each player I calculated TFT’s “projected remaining runs created” for his career as of the end of that season. I then checked how many players achieved their projections plus 50%. The TFT formula predicts that the chance of a player achieving his projection plus 50% is 1 in 6, or 17%.
I added the 50% because Bill James stressed that TFT is valid only for exceptional players attempting to achieve a difficult goal. I assume that a goal with a 17% chance of success counts as difficult.
And also, because the players must be “exceptional,” I limited the study to players who had accumulated 1,000 runs created by the end of the qualifying season. I also eliminated players who did not play at all after their qualif ying season, for whatever reason (injury, retirement, etc.)
Example: Hank Aaron
Take Hank Aaron. After the 1969 season, TFT projected Hammerin’ Hank to create an additional 369 more runs by the end of his career. Our test sees if he will create 150% of that, or 552 runs. In fact, Aaron outdid even the 150% goal, creating 577 more runs before retiring in 1976.
Aaron was not traded after the ’69 season, but he was traded after the 1974 season. At that time he was expected to create 116 more runs. He failed to achieve 150% of that (and he even failed to achieve 100% of that), creating only 87 runs over the next two seasons before retiring.
I repeated this calculation for every player from 1901 to 1975 who had 1,000 runs created under his belt at the time. I then separated those players into those who were traded (like Aaron in 1974) and players who weren’t (like Aaron in 1969).
Results
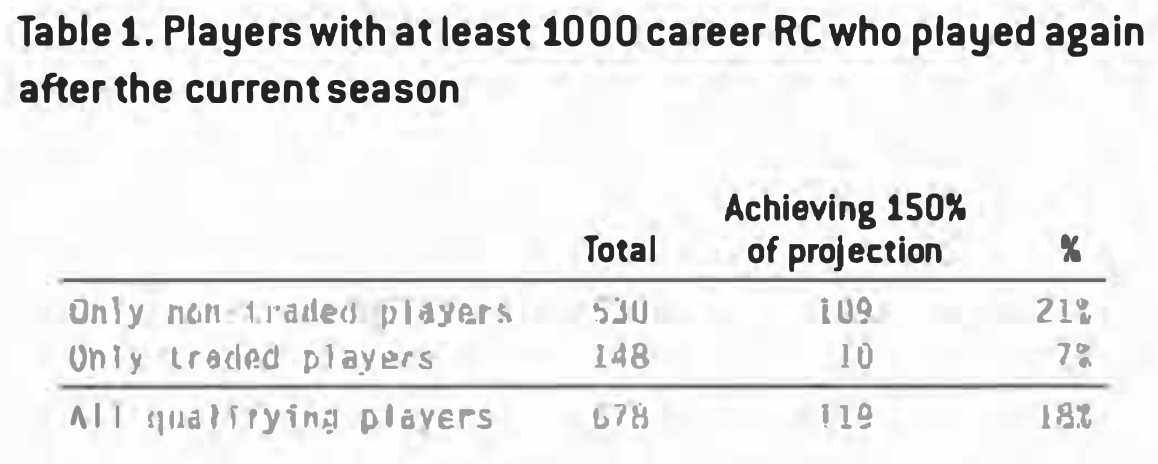
Including both traded and non-traded cases, there were 678 qualifying player-seasons in the study.
Of these 678 seasons, 148 had the player began the next season with another team (by changing teams during or after the previous season). Of those 148, 10 of them reached the goal.
In the other 530 seasons, the player was not traded. Of those 530, 109 of them, or 21%, achieved the goal.
It certainly looks like there’s a large lemon effect here: players not traded were three times more likely to achieve the goal as traded players.
Test 2
Now, as mentioned, TFT is supposed to work only on “exceptional” players. Perhaps we got the results we did because the traded players weren’t “exceptional.” Perhaps they accumulated their 1,000 runs created, but then were in the twilights of their careers, playing part-time, or pinch-hitting. That might make them different from the non-traded players, which might skew the results.
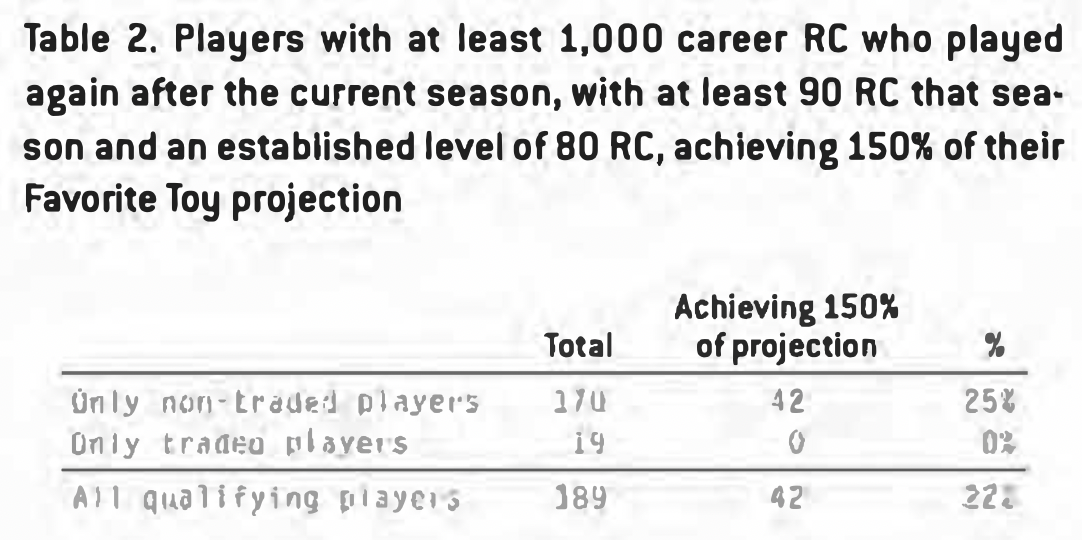
To test this, I tightened the criteria for inclusion. In addition to having 1,000 runs created, I limited the sample to players who:
- Had at least 90 runs created in the previous year; and
- Had a TFT “established level” (weighted average of the past three years) of at least 80 RC.
I ran the study again. The results (see Table 2) were even more dramatic. None of the traded players – zero – achieved the goal.
Test 3
Now, 22% is already a small proportion of successful seasons. Also, those 42 successful seasons aren’t by 42 different players – some players have multiple successes, often in consecutive seasons. For example, Hank Aaron accounted for 13 of the 42, from 1962 to 1973, plus 1975. (He was recorded as successful in the first 9 of those 13 seasons.) Perhaps, then, it’s just by chance that the lemon effect seems so large, due to the list’s domination by the most successful players.
To check that, I changed the study so that instead of requiring 150% of the expected RC to count as successful, only 100% would be required. This should bring the success rate, in theory, to 50%.
Here are the results:
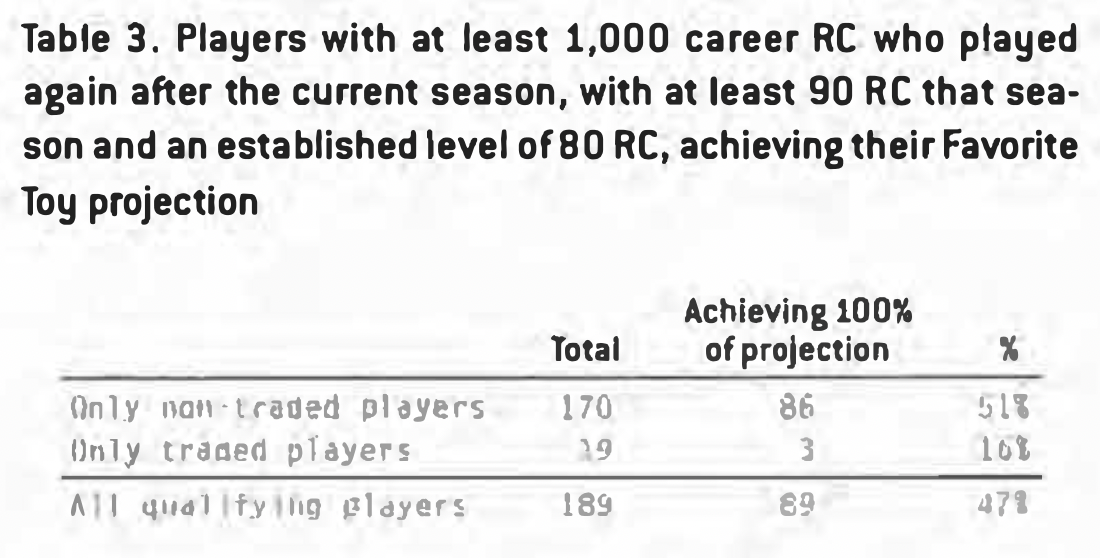
Again, there’s a strong effect here: players whose teams kept them were more than three times as likely to achieve expectations than traded players. Looked at another, equally shocking way – only one out of six traded players achieved the expectations you’d expect from a player of that age and performance. You’d expect 50% of those players to be below what was expected, but a full 84% had careers that fizzled out early.
Test 4
Perhaps. I thought, it’s an age thing: maybe the traded players were old, and TFT just doesn’t work as well for old players. But the results turned out to be similar. Here are the results for players younger than 35:
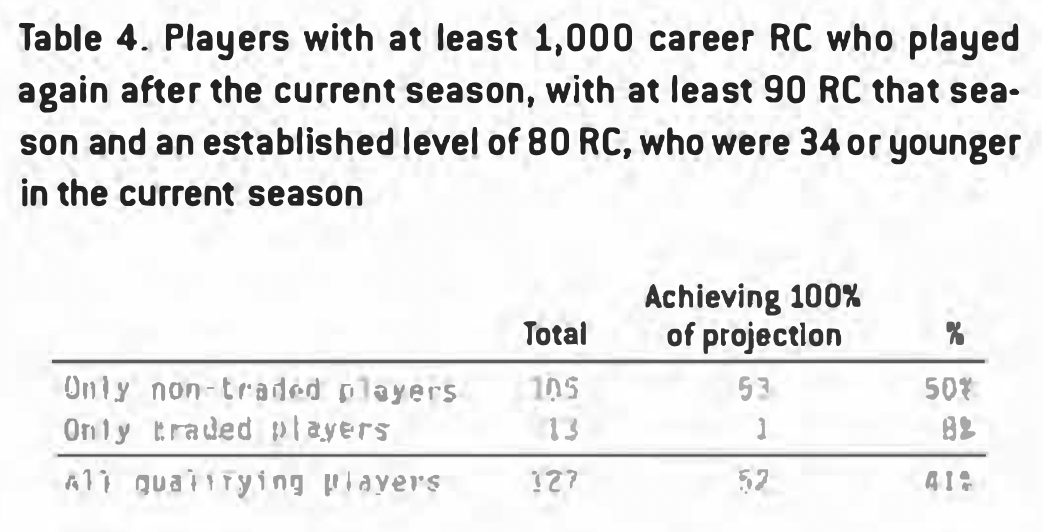
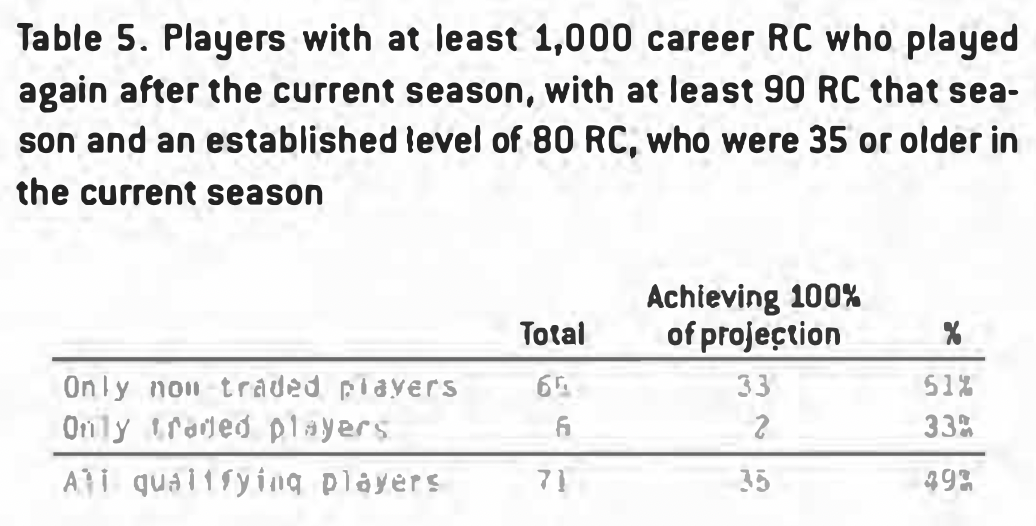
And here are the players 35 and older:
Conclusions
It does seem that there’s a lemon effect for baseball players – traded players do seem to be damaged goods, at least compared to what you’d expect (or what TFT would expect) from their statistics.
However, TFT is a blunt tool, and using TFT limited the sample to certain types of players. A more comprehensive study would use a different projection method, one that applies to all traded players, not just outstanding ones.
One possibility is to use Bill James’s Brock2 method. Fed a career so far, Brock2 projects the player’s career totals, and can be used for all players (although I think the player must have at least three years’ worth of major league statistics). The disadvantage is that the algorithm is difficult to implement without a spreadsheet (although if anyone has a VB implementation they are willing to share, please drop me a line).
Alternatively, the editors of Baseball Prospectus talk about their “Pecota” method, which projects a player’s career by finding retired players most similar at the same age, and averaging their stats. However, the BP editors do not explain their proprietary method in full.
If the difficulties of either of these methods can be resolved, it would be fairly easy to do a full test of all players and see to what extent, if any, the lemon effect continues to appear.
Technical Notes
The basic version of the Runs Created formula was used throughout the study. The player’s age was taken as of December 31 of the year before starting the next season with the new team. The “16% chance of reaching 150%” does not consider the Favorite Toy’s “97%” rule. Raw data for each test can be found online at www.philbirnbaum.com/lemondata.txt.