
Baseball 1858-1865: By the Numbers
This article was written by Bruce Allardice
This article was published in Spring 2020 Baseball Research Journal
Little serious statistical or analytical research has been done on baseball prior to 1871, the year that the National Association of Professional Base Ball Players started, in large part because there was no organized record-keeping of games. Several very good general histories of the period have been published, notably John Thorn’s Baseball in the Garden of Eden, Peter Morris’ But Didn’t We Have Fun?, and Bill Ryczek’s Baseball’s First Inning. Larry McCray’s Protoball website has compiled data — albeit not systematically — on over 10,000 early clubs and games in 124 different countries, along with learned essays on the early game.1
But for the statistic-minded “sabermetrician,” these resources provide only anecdotal evidence of how games prior to 1871 were played. This contrasts with the thousands of web pages, articles, and books statistically analyzing professional baseball post-1870. Key questions about early baseball, such as where the game was played or how many runs were scored each game, have never been addressed.
This article attempts to address this gap in baseball historiography, and answer some of these questions.
The Tholkes Data
“Data! Data! Data! He cried impatiently. “I cannot make bricks without clay.”2
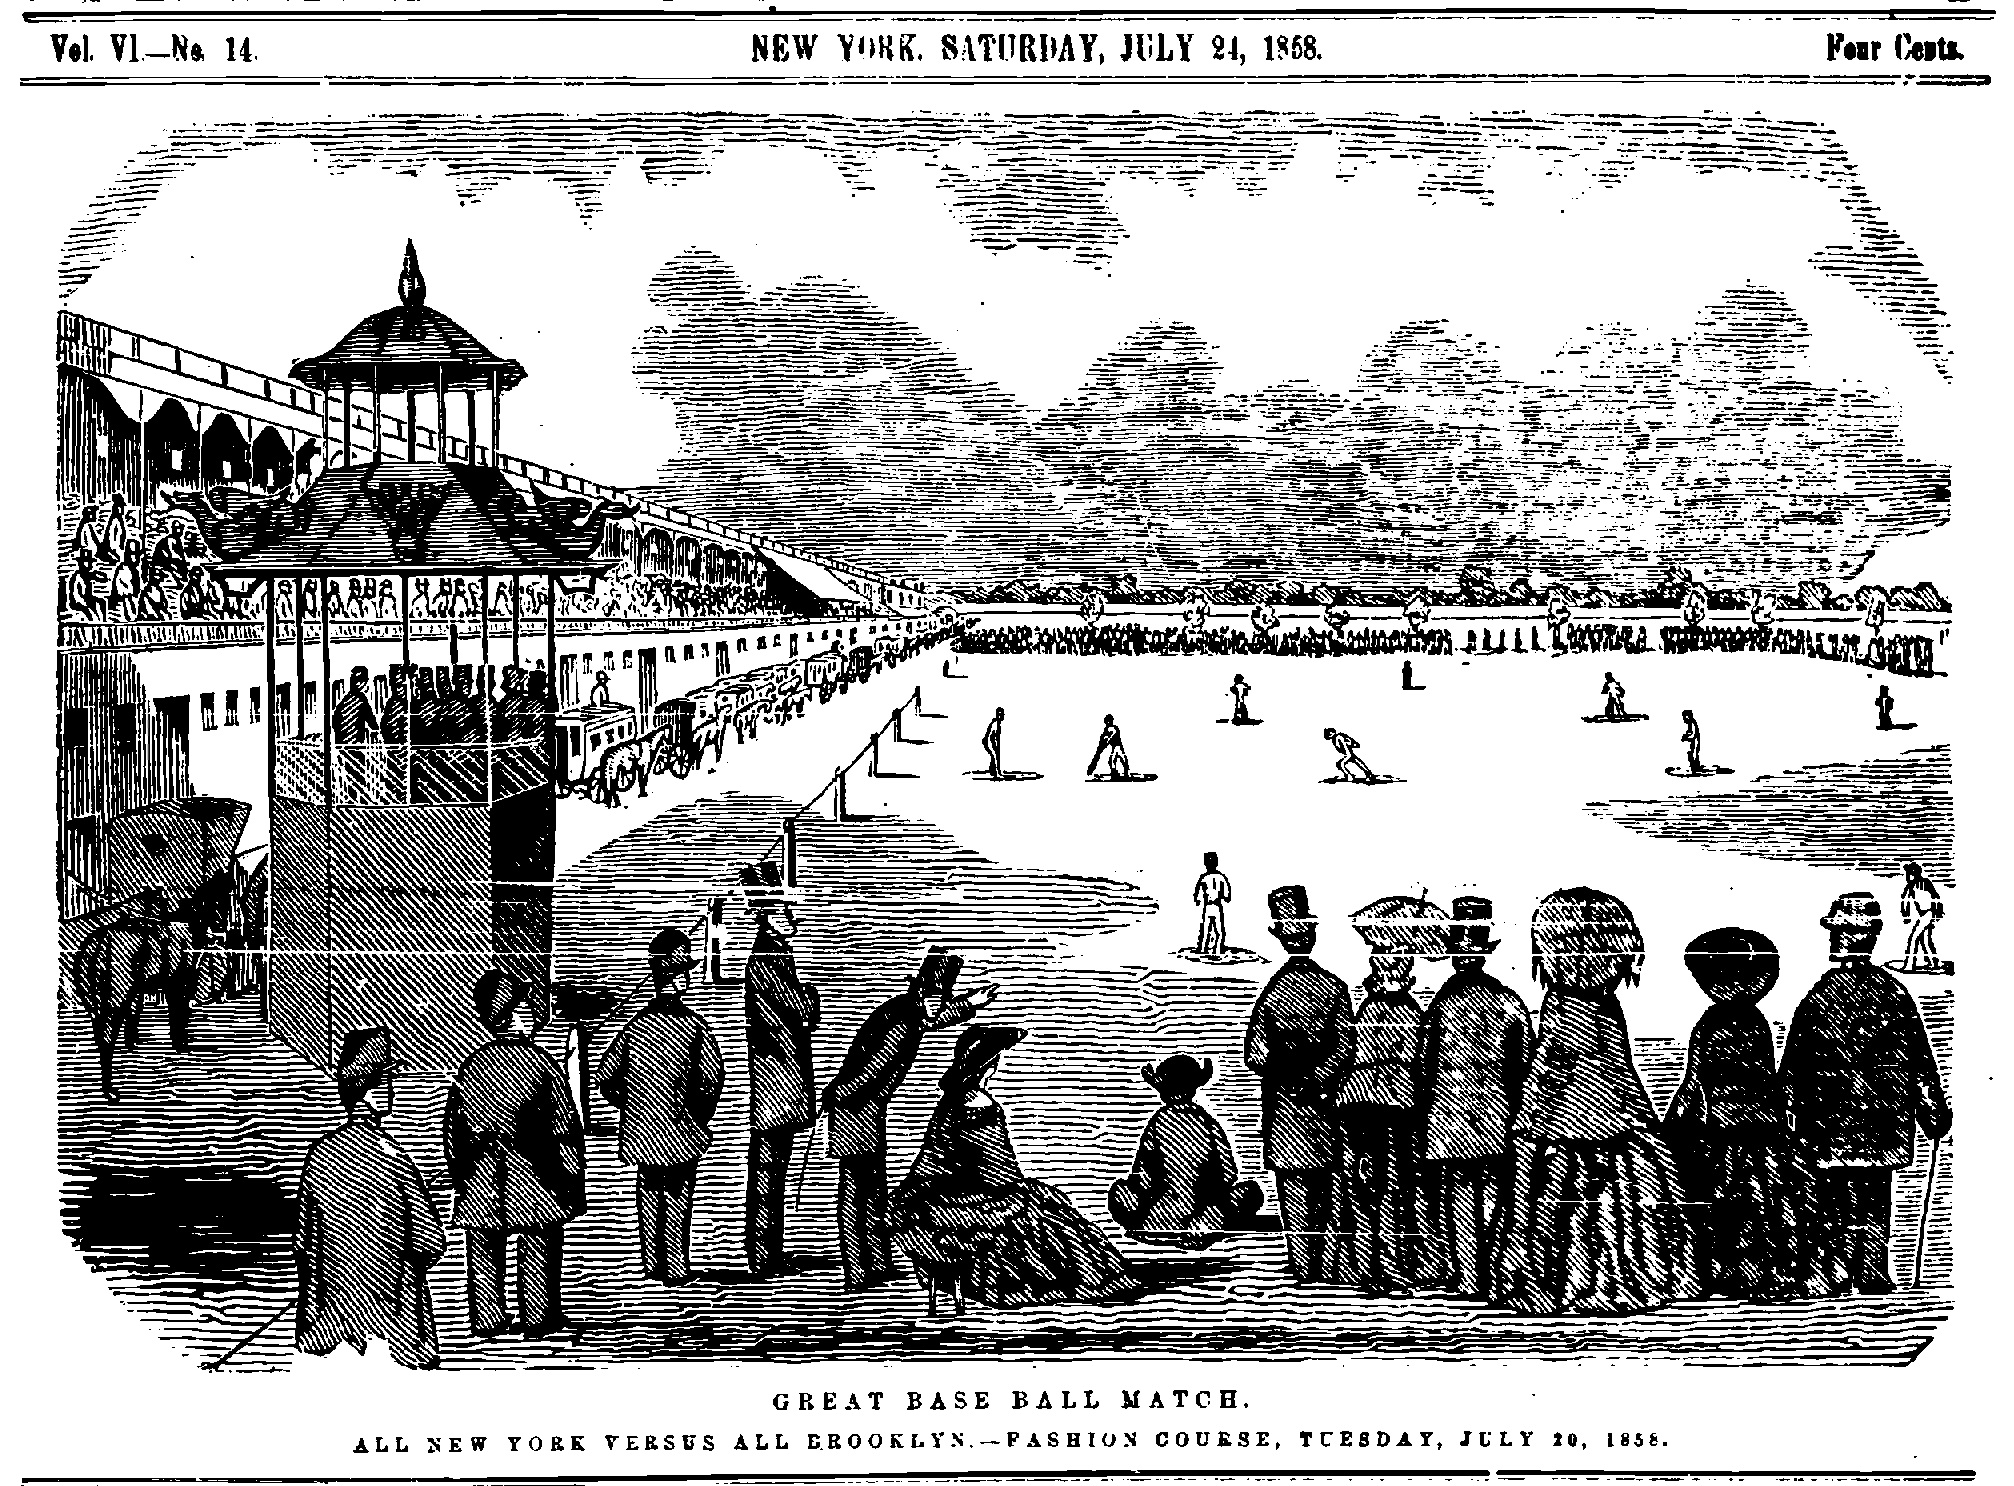
Thanks largely to SABR member Bob Tholkes, sabermetricians finally have a large enough and random enough sample of early ballgames to analyze and draw statistically valid conclusions. The Tholkes Excel spreadsheet covers the years 1858 to 1865, the eight years after the 1857 rules changes which are usually considered to have created the modern game of baseball, and is viewable at the Protoball website.3 It lists all the games played under National Association rules as reported by multiple sources, mainly the four major baseball-covering newspapers of the time: the New York metropolitan-area-based New York Clipper, New York Mercury, Porter’s Spirit of the Times, and the Brooklyn Daily Eagle.
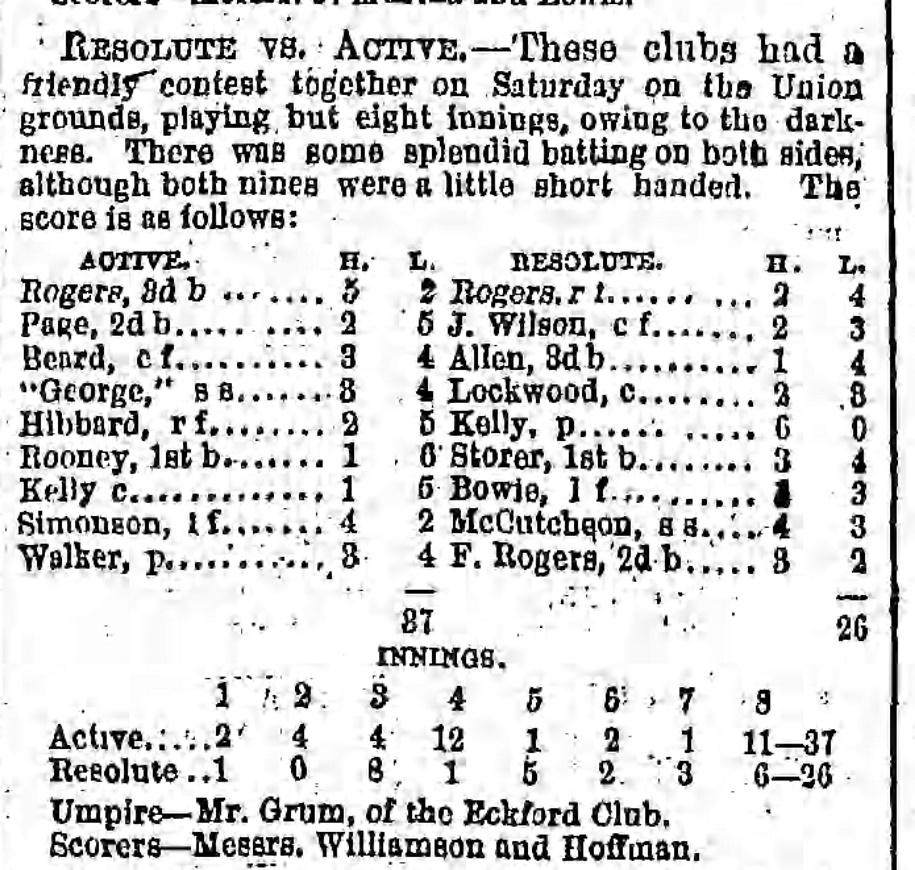
A typical game report, from the Brooklyn Daily Eagle, June 26, 1865
The data comprise reports of 4,673 games.4 Most reports include date the game was played, the source of the report of the game, the team names, scores, innings played, and whether the teams were junior or senior. Not all game reports list all these items. A few lack detailed scores, some don’t mention the innings played, and a handful don’t mention the senior or junior status of the clubs.5 However, even with these gaps, the data are robust enough for valid analysis. The number of games per year averages 584, a number greater than the games played per year in the major leagues from 1876 to 1891.
So what do the data tell us about early, amateur/pre-professional baseball?
Early Scores
In this era the runs scored per game were dramatically greater than in baseball games today, reminiscent of softball scores—which should not be surprising, since 1858–65 baseball resembled modern softball as much as it resembled modern baseball.
The median game score was 27–17. The highest single club score was 162 runs (the Philadelphia Athletic vs. the evidently hapless Alert of Danville, who scored 11, October 20, 1865. And only 8 innings were played!). The highest total score was 148–139 (Toronto vs. Hamilton, September 24, 1864). On the other end, 5 clubs scored zero runs (including a 47-0 shutout in Syracuse, New York, in 1865), and 18 scored only 1 run.
In 1987 historian John Thorn expressed the conventional wisdom on scoring in the 1860s when he noted that “the baseball games of the 1860s typically featured 35 or more combined runs per game, with scores of 60-100 runs not unusual.”6 With these new data, it can be said that the scoring for the early 1860s, at least, was significantly higher:
|
Year |
Games |
Runs scored |
|
1858 |
377 |
48.96 |
|
1859 |
597 |
47.62 |
|
1860 |
1024 |
46.07 |
|
1861 |
428 |
45.04 |
|
1862 |
257 |
44.08 |
|
1863 |
271 |
41.38 |
|
1864 |
448 |
48.26 |
|
1865 |
1260 |
55.37 |
|
Avg. |
50.957 |
Runs Per Inning (RPI)
The 1857 rules changes mandated a nine-inning standard game, with extra innings if there was a tie after nine. However, clubs seemed slow to adopt this new rule, with games called because of weather or oncoming darkness, or by agreement. The average innings per game slowly climbed upward almost every year after 1858. Considered by runs per inning played (RPI) played—a more accurate measure than straight runs per game (RPG), the scoring averages show the same trend as RPG, but with a more uniform 1858-63 decline:
|
Year |
RPI8 |
Change from Prior Year |
|
1858 |
6.23 |
|
|
1859 |
6 |
-.23 |
|
1860 |
5.73 |
-.27 |
|
1861 |
5.52 |
-.21 |
|
1862 |
5.24 |
-.28 |
|
1863 |
4.98 |
-.26 |
|
1864 |
5.7 |
+.72 |
|
1865 |
6.78 |
+1.08 |

Several trends can be seen here.
The average RPG declines about a run per year (approximately 3%) every year through 1863. This percentage change is not out of line with scoring fluctuations we’ve seen in major league baseball in the past 100 years. This accords with speculation in some histories that as the game became more practiced and more familiar, the skill level of the fielding increased, which caused the scores to go down.
However, this trend towards lower scores dramatically reverses in 1864 and 1865, jumping seven RPG each of these years. The percentage increases in RPG are 16.60% for 1864 and 14.73% for 1865. Looking at the records for major league baseball we see several scoring jumps that meet or exceed those of 1864–65, as follows:
-
15.9% from 1886 to 1887
-
28.78% from 1888 to 1889
-
28.95% from 1892 to 1893
-
17.7% from 1910 to 1911
-
25.45% from 1919 to 1921
-
19.00% from 1968 to 19699
While the increase in raw number of RPG was greater in 1864–65 (due to the higher overall scores), percentage-wise the increase is not unprecedented.
The major-league RPG increases in the years listed above can all be attributed to specific rules changes or changes in equipment. For example, in 1889 the walk rule was changed from 5 balls to 4. The livelier corked ball was introduced for 1911. For 1969, the strike zone was shrunk and the pitching mound was lowered from 15 inches to 10. So is it with 1864 and 1865. The December 9, 1863, convention of the National Association of Base Ball Players changed the rules to allow the umpire to call “balls” and “walks,” and restrictions were placed on how a pitcher could pitch. The December 14, 1864, convention abolished the “bound game” rule whereby fair hit balls caught on the first bounce were “out,” and mandated that fair hit balls must be caught on the fly (the modern rule) to become an “out.”10
Notice that these rules changes would result in increased scoring, whether this increase was intended or not. It was in fact widely expected at the time that the changes would increase scoring. In early 1864 the New York Clipper, baseball’s then-equivalent of a “newspaper of record,” predicted that the 1863 changes in pitching rules “must perforce result in there being less speed in pitching… and the transfer of the interest of a match from the pitcher to the basemen and outfielders. Of course we must expect to see a large increase in scoring, the probability being that the average runs of a match [for each team] will be increased from twenty to thirty in a majority of games played.”11 The difference between the “bound game” and “fly game” rules were recognized in 1862 by Brooklyn’s prominent “Star” Club. The Star played an inter-squad game, first nine (regulars) versus second nine (backups) and to even the contest, the first nine fielded via the “fly game” whereas the second nine used the “bound game” rule. Despite this handicap, the first nine won 35-15.12
The 1863 and 1864 conventions changed the rules (which changed scoring) but one caveat remains: How quickly and completely were these rule changes actually implemented? Put another way, would the scoring differences be greater if the rules changes had been immediately and uniformly adopted by the clubs? Richard Hershberger’s new book, Strike Four, goes into some detail in discussing the rules changes and concludes that, for the new ball-strike rules at least, 1864 umpires rarely enforced the rules. “(T)he base on balls was a new and strange idea…. [In addition to the vagueness of the new rules] the challenge was to get umpires to call balls and strikes at all… Players didn’t like the new rule. Umpires … didn’t like the new rule either.”13 One indirect indicator of an implementation delay is shown below, where scoring for “elite” clubs increased in 1866 as well, suggesting the 1864 and 1865 rules changes took years to fully take hold.14
Scores Overall Compared to Scores of “First Class” Teams
The data here can be compared to the data of the scoring of the “first class” teams for 1861, 1864, 1865, 1866 and 1869. The Beadle Baseball Guides recounted the yearly scoring of what they defined as the “first class” clubs (almost all in the New York City area) in the games they played against “first class” opponents under National Association rules.15
|
Year |
First Class Games16 |
First Class RPG |
Overall RPG |
|
1861 |
64 |
41.6 |
45.04 |
|
1864 |
179 |
40.2 |
48.26 |
|
1865 |
258 |
48.6 |
55.37 |
|
1866 |
485 |
53.13 |
|
|
1867 |
— |
62.84 |
|
|
1869 |
1138 |
51.63 |
The “first class” teams scored somewhat fewer runs than the overall average. That might be explained by the fact that the better teams would feature better defense, or that the first-class games would feature fewer high-scoring mismatches. The 1864 difference is a bit of an outlier and may be accounted for by the fact that many “first class” teams already played by the new rules and had already adjusted their defenses.
Scores, Junior Clubs vs. Senior
A surprising 43.6% of the reported games were games between two “junior” clubs, with 50.9% exclusively “senior” and 1.7% involving a junior/senior matchup.17 A look at the scoring differences between junior and senior teams in the two biggest years, 1860 and 1865, reveals little difference in RPG.
|
Year |
RPG Junior games |
RPG Overall18 |
Difference |
|
1860 |
43.61 |
46.01 |
2.40 RPG |
|
1865 |
53.7 |
55.37 |
1.67 RPG |
|
Year |
RPG Junior games |
RPG Senior Games |
Difference |
|
1860 |
43.61 |
47.61 |
4.0 RPG |
|
1865 |
53.7 |
56.9 |
3.2 RPG |
Since the junior games averaged fewer innings than the senior (7.7 innings versus 8.4), the runs per inning (rpi) were roughly equal:
|
Year |
RPI Junior games |
RPI Senior Games |
|
1860 |
5.66 |
5.81 |
|
1865 |
6.97 |
6.73 |
|
Avg. |
6.31 |
6.27 |
Runs Per Game, New York City vs. Elsewhere
Of the games we have scores for, 65.8 percent (3067) were played in the greater New York City (GNYC) area. This proportion reflects the New York City origins of the game, as well as the locus of the four major source newspapers. In these games, the GNYC clubs scored significantly fewer runs per game (45.58) than did teams outside of GNYC (54.80). This disparity probably reflects the fact that the GNYC clubs were older and more experienced at the game, had better defenses, and were less likely than newer teams to play in mismatched games.
Looking only at “first class” clubs, the same scoring disparity occurs. For example, in 1867, NYC/Brooklyn teams averaged 8.28 fewer runs scored in their games than teams elsewhere.19
When Were the Games Played?
The following charts the games on a yearly basis:
|
Year |
Games |
|
1858 |
377 |
|
1859 |
597 |
|
1860 |
1024 |
|
1861 |
428 |
|
1862 |
257 |
|
1863 |
271 |
|
1864 |
448 |
|
1865 |
1260 |
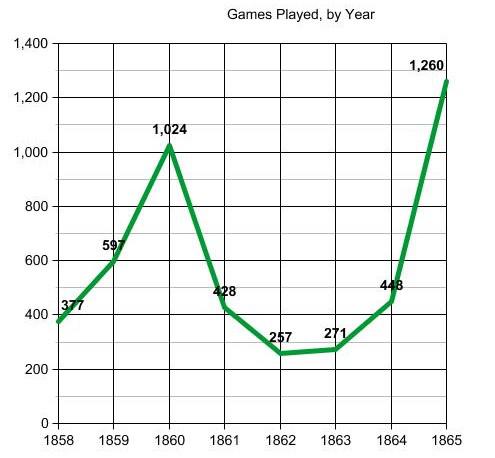
The dip in games caused by the Civil War is apparent in the 1861–64 seasons. The 1865 number isn’t greatly impacted by the war, because Lee surrendered in April and (as seen below) usually very few games were played prior to May. In essence, in 1865 the game resumes where it left off in 1860.20
Most of the games were played in the late summer-early fall, rather than in the spring:
|
Month |
Games |
|
January |
11 |
|
February |
11 |
|
March |
3 |
|
April |
24 |
|
May |
128 |
|
June |
466 |
|
July |
606 |
|
August |
936 |
|
September |
1111 |
|
October |
906 |
|
November |
443 |
|
December |
28 |
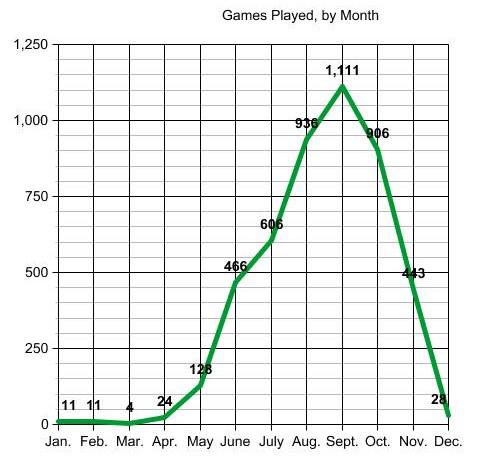
While in modern times we may think of baseball as the “game of summer,” early baseball can better be characterized as the “game of fall.”
Where Were the Games Played?
Of games where a state or region is indicated, 68.2% were played in GNYC. A further 14.9% were played elsewhere in New York state.21 By state/region, the breakdown is as follows:
|
Region/State |
Games |
|
GNYC |
2984 |
|
NY (non-GNYC) |
650 |
|
NJ (non-GNYC) |
32 |
|
PA |
216 |
|
CT |
51 |
|
RI |
6 |
|
MA |
131 |
|
ME |
21 |
|
DE |
4 |
|
OH |
2 |
|
IL |
30 |
|
IN |
3 |
|
MI |
57 |
|
WI |
1 |
|
IA |
1 |
|
MN |
4 |
|
KY |
4 |
|
VA |
2 |
|
MO |
42 |
|
MD |
44 |
|
DC |
37 |
|
LA |
18 |
|
CA |
12 |
|
Canada |
18 |
How Many Innings for Each Game?
The 1857 rules changes established the nine-inning game as standard. This standard was not always followed. One recent history posits that in 1856, the average game lasted only six innings, and that after the 1857 changes, “the nine-inning game was soon firmly established.”22 The data suggest otherwise — that the nine-inning standard, like other rules changes, took some time to become the standard:
|
Year |
Games |
|||||||||
|
2 |
3 |
4 |
5 |
6 |
7 |
8 |
9 |
10+ Innings |
||
|
1858 |
2 |
1 |
5 |
24 |
36 |
49 |
38 |
174 |
1 |
|
|
1859 |
1 |
2 |
7 |
32 |
59 |
64 |
71 |
274 |
5 |
|
|
1860 |
3 |
4 |
9 |
70 |
55 |
82 |
71 |
466 |
9 |
|
|
1861 |
0 |
1 |
0 |
20 |
28 |
27 |
29 |
193 |
0 |
|
|
1862 |
0 |
0 |
0 |
7 |
13 |
14 |
23 |
133 |
5 |
|
|
1863 |
0 |
3 |
1 |
4 |
9 |
19 |
11 |
114 |
2 |
|
|
1864 |
0 |
1 |
1 |
11 |
13 |
12 |
13 |
185 |
2 |
|
|
1865 |
1 |
1 |
5 |
59 |
60 |
79 |
58 |
503 |
9 |
|
Year |
Innings Per Game |
Pct Games <9 innings |
|
1858 |
7.86 |
45.4 |
|
1859 |
7.93 |
45.8 |
|
1860 |
8.03 |
38.3 |
|
1861 |
8.16 |
33.2 |
|
1862 |
8.42 |
29.2 |
|
1863 |
8.31 |
28.8 |
|
1864 |
8.46 |
21.4 |
|
1865 |
8.17 |
33.2 |
|
Overall: 36.2 |
Just as today, games could be and were shortened because of rain, approaching darkness, agreement between the teams, or time constraints. Since rain during a game generally causes few postponements, then as well as today, it appears the majority of shortened games involved some sort of club agreement and thus some casualness toward the nine-inning standard. More research needs to be done to explain the 1865 uptick in shortened games.
Extra-Inning Games and Tie Games
The 1857 rules changes allowed for extra-inning games, in case the score was tied after nine innings. This change was in part to eliminate tie games. Just as with the other rules changes, it appears clubs were slow to adopt the new rule:
|
Year |
Games23 |
Extra Inning Games |
Tie Games |
|
1858 |
321 |
1 |
6 |
|
1859 |
515 |
5 |
5 |
|
1860 |
768 |
9 |
22 |
|
1861 |
289 |
0 |
6 |
|
1862 |
195 |
5 |
4 |
|
1863 |
163 |
2 |
6 |
|
1864 |
238 |
2 |
9 |
|
1865 |
766 |
9 |
12 |
For this period, only 1% of the games were extra inning games—much less than in today’s game. Since 2012, one game in eleven (8.7%) is tied after nine and goes to extra innings. In part this disparity may reflect the higher scoring of the early games, the higher scoring making it less likely that a game would be tied after nine. The early games were in fact more likely to end in a tie than in extra innings, with about 1.5% of the games (mostly, nine inning games) ending in a tie.24
Junior Games and Senior Games, Percent Comparison
|
Year |
Junior |
Junior/Senior |
Senior25 |
|
1858 |
46.3 |
5.3 |
47.9 |
|
1859 |
41.5 |
4 |
52.6 |
|
1860 |
44.3 |
5.4 |
48.5 |
|
1861 |
44 |
4.4 |
49.2 |
|
1862 |
37.5 |
2.3 |
59.8 |
|
1863 |
37.8 |
6.3 |
55.2 |
|
1864 |
45.9 |
2 |
48.5 |
|
1865 |
44.7 |
1.9 |
51.8 |
|
Total |
43.6 |
3.8 |
50.9 |
There was a slight dip in junior baseball during the middle of the Civil War. The war appears to have hurt junior clubs even more than it did senior clubs.
Future Research
Sabermetric statistical research has covered major league baseball in the years from 1876 to present in great detail. This article will hopefully fill the gap for 1858–65, as much as it can be filled with the available data. Hopefully similar data for the years 1866-70 will someday be compiled, enabling similar analysis for those years.
BRUCE S. ALLARDICE is a Professor of History at South Suburban College, near Chicago. Professor Allardice has authored numerous articles on the Black Sox, along with biographies of the Black Sox gamblers for the SABR BioProject. His article, “The Spread of Baseball in the South Prior to 1870” received SABR’s McFarland Award at the 2013 SABR Convention.
Notes
1 John Thorn, Baseball in the Garden of Eden: The Secret History of the Early Game (New York, Simon & Schuster, 2012); Peter Morris, But Didn’t We Have Fun? An Informal History of Baseball’s Pioneer Era, 1843-1870 (Chicago, Ivan R. Dee, 2008); William J. Ryczek, Baseball’s First Inning: A History of the National Pastime Through the Civil War (Jefferson, NC, McFarland & Co., 2009). www.protoball.org.
2 Sherlock Holmes, in Arthur Conan Doyle’s “The Adventure of the Copper Beeches.”
4 4,881 total entries, including games postponed because of rain.
5 For reports where the junior/senior status of the clubs is not given, Mr. Tholkes researched and filled in that information whenever possible.
Tholkes has also analyzed the average time of the games, based on an admittedly smaller and non-random sample. See “Time of Game in the Amateur Era: 1860-65,” 19th Century Baseball Newsletter, Fall 2019, 3-4.
6 Our Game blog, Aug. 6, 2014, at https://ourgame.mlblogs.com/.
7 By comparison, NA games in 1871 averaged 20.94 RPG, and in 2019 (as of July 15) MLB games have averaged about 9.6 RPG.
8 Not all game reports with innings have scores, and vice-versa. This table compares recorded RPG and recorded average innings per game for each year.
9 Numbers taken from Baseball-Reference.com.
10 For the 1863 convention, see the Brooklyn Daily Eagle, December 10, 1863. For the 1864 convention, see the New York Clipper, December 14, 1864. For a more general discussion of these rule changes, see Richard Hershberger, Strike Four: The Evolution of Baseball (New York, Rowman & Littlefield, 2019), chapters 9, 12 and 13; Ryczek, Baseball’s First Inning, pp. 178-183. The 1863 changes impacted Rules 5-7.
11 New York Clipper, May 7, 1864. This article presents a detailed discussion of the rules changes for 1864.
12 New York Clipper, May 24, 1862. The New York Clipper, Nov. 19, 1864 opines that the “fly game” was best for “first class” clubs, whereas the “bound game” “unquestionably” suited the lesser clubs, and notes that the Excelsior and Star of Brooklyn, two leading first class clubs, played only fly games in 1864.
13 Hershberger, Strike Four, p. 85.
14 Historians have advanced other factors that could have increased scoring, such as the Civil War (where call-ups to the army could create more mismatches) and the ball being made more lively. For the latter reason, see the New York Clipper, April 16, 1870.
15 See Beadle’s Dime Base-Ball Player, 1862, pp. 55-69; 1865, pp. 59-63; 1866, pp. 59-65; 1867, pp. 75-91; 1868, pp. 94-97; 1870, pp. 71-72. The 1868 guide presents runs scored in a different way, and the RPG is an estimate based on the offensive runs scored per game per team for the 94 teams listed, plus the opponents’ estimated RPG. The 1869 guide gives no similar figures.
16 Some double counting of games here, which wouldn’t impact the RPG. As can be seen, the “first class” games were a significant percentage of the overall games.
17 In the Civil War era “junior” teams generally consisted of young men in their late teens. See Robert Pruter, The Rise of American High School Sports and the Search for Control: 1880-1930 (Syracuse U. Press, 2013), p. 9.
18 The overall number includes the junior games.
19 Beadle’s Dime Base-Ball Player, 1868, pp. 94-97. The number is an estimate (see fn. 15 for methodology).
20 This trend can be seen in another study of baseball, focusing on yearly newspaper mentions of the game. See Bruce Allardice, “The Spread of Baseball, 1859-1870,” at http://protoball.org/The_Spread_of_Base_Ball,_1859_-_1870
21 This GNYC emphasis may in part reflect the fact that the newspapers reporting the games were all based in New York.
22 Hershberger, Strike Four, p. 47.
23 Where innings are indicated.
24 For a discussion of the reasons why the nine-inning and extra-inning rules were adopted in 1857, see Hershberger, Strike Four, pp. 46-47. From the data, it appears the tie games were NOT “thoroughly abolished” by the new rules (Hershberger, Strike Four, p. 47).
25 Percentages don’t add up to 100 because a small percentage of games (less than 2%) have no junior/senior status indicated.