

Beyond the Miracle: The Mets of the Early 1970s
This article was written by Douglas Jordan
This article was published in Fall 2019 Baseball Research Journal
 The year 1969 was eventful. Astronauts Neil Armstrong and Buzz Aldrin first set foot on the moon, President Nixon began troop withdrawals from Vietnam, and the Beatles released their classic album “Abbey Road.” Two other major events took place in New York State. The Woodstock festival brought a generation together in musical celebration and, in arguably the most surprising event of the year, the New York Mets won the World Series. This was so unlikely that the team has been referred to as the Miracle Mets ever since.
Looking back, this baseball miracle seems to be the lone successful season in the first two decades of franchise existence. But this perception is wrong. The Mets’ performance that year was surprising based on the seven seasons that preceded it, but 1969 was not the only successful year for the Mets. The team was competitive from 1969 to 1973. The purpose of this article is to refresh our memories of what actually happened during that time period. All of the data used in the article are from Baseball-Reference.com.
The Early Years
As with most expansion teams, the franchise struggled in its early years. The inaugural 1962 campaign is legendary for ineptitude. The team won only 40 games (the fewest wins by any team in a 162-game season) while losing 120, and finished tenth out of ten teams in the NL. But that team’s Pythagorean win total was 50, which indicates that the team should have won more games based on runs scored and runs allowed than its actual record. So Mets fans can argue that the 1962 team was not as abysmal as the 40-win season suggests.
The team’s win/loss performance did not improve much between 1963 and 1968. Table 1 shows that the team finished in last place (tenth of ten) four of those six years, and in second-to-last place (ninth of ten) the other two years. All of those teams struggled offensively, finishing tenth or ninth in on-base plus slugging averages (OPS), batting average (BA), and runs scored per game (R/G) every year. The pitching and fielding were similarly poor. The team had the worst earned run average (ERA) and runs allowed per game (RA/G) in the league every year until 1965, with only slight improvement in 1966 and 1967. In terms of fielding, performance during the early years was similarly awful. The Mets committed 210 errors in both 1962 and 1963. The 1963 error total is the last time any team committed more than 200 errors in a season (but the Cubs managed to commit 199 errors in 1974). The fielding improved only slightly over the following few years.
But the Mets’ story changed significantly in 1968 under new manager Gil Hodges. Superficially, it didn’t appear to be much of an improvement: the team won 73 games, came in ninth place, and still hit weakly. But buried in the minutiae of baseball data, we can see the pitching and fielding had improved significantly. The team’s ERA of 2.72 was fourth-best in the league and the RA/G was second-best at 3.06. The 133 errors that the Mets committed were the fourth-fewest in the league. The stage was set for the drama to come the next year.
Table 1: NY Mets data from 1962-73
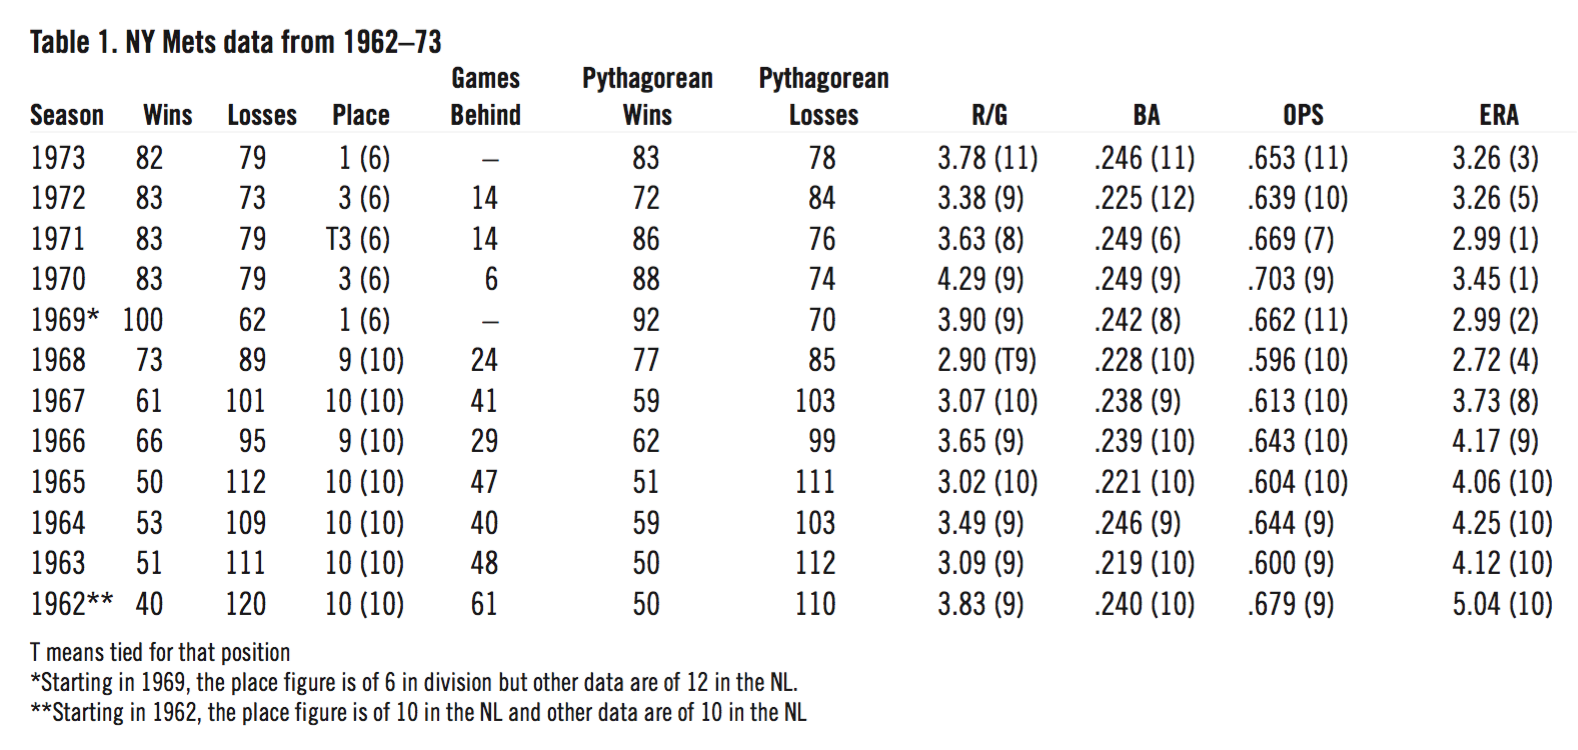
(Click image to enlarge)
The Surprising 1969 Regular Season
To the discerning observer, it didn’t take long for the Mets to establish that the 1969 season was going to be different from the previous seven campaigns. The team went 9-11 in April, but seven of the 11 losses were by one or two runs. The 12-12 record they put up in May didn’t seem impressive, but it was only the third time in franchise history that the team had a .500 record or better for a month. However, to the casual baseball fan, it looked like nothing had changed. The Mets were 5½ games behind the Cubs at the end of April, and trailed them by nine games by the end of May.
The Mets showed that they could be a factor in the pennant race when they had a franchise-best month in June with a record of 19–9. But after a 15–12 July, the team went 4–7 on an 11-game road trip. By August 13, they found themselves ten games behind the Cubs (the largest deficit of the season).
What happened next shows how quickly gaps can close in the standings when the trailing team gets hot, and the leading team goes cold. From August 14 to August 27, the Mets righted the ship with a 9–1 homestand, and went 12–1 over 13 games. During the same time period, the once historically hot Cubs went 5–9. The Cubs’ lead over the Mets shrank to 2 ½ games on August 27. A laughingstock for seven seasons, the Mets were suddenly in their first pennant race. Could they handle that pressure? History shows the Mets were up to the challenge.
 The Cubs came to Shea Stadium on September 8 for a crucial two-game series, holding a 2½ game lead. The Mets swept the short series, and then moved into first place on September 10. They stayed there the rest of the season, going 23–7 in September while the Cubs went 8–17 that month. The Mets concluded the season by going 9–1 over their last ten games, and finished 100–62 for the campaign. The Cubs were eight games back. The 100 games the Mets won were the best in the NL by seven games over the West Division champion Braves, who won 93.
How did the Mets accomplish this miracle? Table 1 shows the answer. As is not unusual in baseball history, pitching and fielding were the foundation upon which the team built the championship. The Mets’ ERA of 2.99 and RA/G of 3.34 were second-best in the now 12-team league, both numbers just slightly higher than the league-leading Cardinals. The 122 errors they committed were the second-fewest in the league. The team’s hitting improved modestly. Although the Mets’ OPS of .662 was still second-lowest in the league, their .242 batting average was tied for seventh and wasn’t too far below the league average of .250. The team scored 3.90 runs per game (ninth in the league) compared to the league average of 4.05 R/G. Excellent pitching and fielding, combined with slightly improved offense (and some luck; as their Pythagorean win total of 92 versus the 100 actual wins implies) led to a stellar, 100-win season.
The Forgotten Competitive Years, 1970–73
Fifty years makes the memory hazy. In retrospect, the 1969 World Series victory seems isolated because of the terrible seasons that preceded it and the fact that it took the Mets 17 years to win another world championship. But in fact, the Mets were competitive within the division between 1970 and 1973. The team even got to the World Series in 1973, but came up one victory short of winning. Had they managed to win that game, the team’s nationwide reputation for this time period would be very different. In fact, a better question to ask is, why didn’t the Mets win more than one title in this era? The answer: short stretches of uncharacteristically poor play each season in 1970 through 1972.
1970
A glance at the final East Division standings at the end of the 1970 season shows that the Mets’ record was 83–79. They finished in third place, six games behind the Pirates. These numbers suggest that the Mets were not competitive that season. This suggestion is inaccurate: the Mets were very competitive all season, and had a good chance of winning the division into late September. But they came up just short in crucial games down the stretch, and failed to get into the postseason. Let’s clear some of the haze away from a half-century of memory.
In 1970, the Mets went 10–9 in April and finished the month 3½ games behind the Cubs. They fell to five games out on June 11, but then went 10–2 over their next 12 games and moved into first place by 1½ games on June 25. At the end of July, the Mets had a 55–46 record and led the division by half a game. But even though they played poorly in August and compiled a 13–18 record that month, they were only 1½ games out of first place on August 31. They won six of seven games in early September and were tied for the division lead on September 10. The Mets were still tied for the lead on September 14, at 78–69, after a victory at Montreal.
But a crushing loss to the Expos the next day was the beginning of the end. They lost the next three games by scores of 4–2, 3–2, and 2–1 and fell 3½ games behind the Pirates on September 19, with just 11 games left to play. They went 5–6 and finished six games back. There was no miracle in 1970, but the team had been competitive throughout the season, thanks to pitching and fielding. Table 1 shows that the Mets had the best pitching staff in the league in terms of ERA and RA/G, with fielders who committed the second-fewest errors (124) in the league. But the strong pitching could not make up for the weak offense.1
1971
The story of the 1971 season is similar to the 1970 season. The team won 83 games again, but this time finished 14 games out of first place. Those numbers once again make it appear that the team was not competitive. However, a closer look at the 1971 season reveals a different narrative. The Mets went 12–7 in April and finished the month in first place by one game. The team stayed in first place for the first half of May. About a month later, on June 9, the Mets owned a 32–20 record and were tied for the lead of the East Division. At the end of June, the team was 45–29 and two games behind the Pirates. The Mets were in, or close to, first place for half the season. They were clearly competitive to this point in the campaign.
But baseball teams can go through bad spells, and the Mets had one as the calendar turned to July in 1971. They went 3–16 over the next 19 games, and fell 13½ games behind the Pirates. The Mets lost just 1/2 game to the Bucs over the rest of the season, but July cost them the division. So as in 1970, the team was competitive but failed to reach the postseason. And as in 1970, pitching was the strength of the team. The Mets led the league in both ERA and RA/G with an error total that was third-best.
1972
1972 was eerily similar to the previous year. The Mets started well, going 29–11 over the first two months in spite of the untimely passing of Gil Hodges about two weeks before the season began. They built a 6 ½ game lead over the second place Pirates on May 20. They didn’t play as well in June (12–15), but were still tied for the division lead at the end of the month. However, just like 1971, they didn’t play well in July. An 11–15 record that month left them seven games behind the Pirates, who went 20–10 over the same stretch. By the end of August, another sub-.500 month left them 13 games behind and they finished 13 ½ games out of first place. So, once again, the team was competitive for half the season before a stretch of poor play ruined their chance of winning the division.
Another way to look at the results for these seasons is to compare the Pythagorean win totals each year. (The numbers are given in Table 1.) The 1969 team won 27 more games than the ’68 team but the Pythagorean win total for the ’69 team was only 15 games higher. This suggests that at least some of the improvement in ’69 was due to chance. Similarly, the ’70 and ’71 Pythagorean win totals were just four and six games less than the 92 Pythagorean wins the Mets had in ’69. This suggests that those two teams were almost as good as the ’69 version of the club, but they were not as lucky. The ’72 team was luckier than expected with a win total that exceeded its Pythagorean win total by 11 games. But that was not enough to overcome a 13-game deficit that year.
The Comeback in 1973
 In retrospect, it seems appropriate that the events of the 1973 season more closely resembled what happened in 1969 than the seasons in between. But unfortunately for Mets fans, the deliriously happy ending of 1969 was not to repeat. The Mets started the season well, going 12–8 in April, and were tied for the division lead at the end of month. But the team played poorly over the next two months, going 20–31 and landing at the end of June in last place, 11 games behind the Cubs.
The Mets then lost four of the first five games in July, and fell 1½ games behind. This was the biggest deficit of that season. The situation didn’t change much over the rest of July and they finished the month in last place, 10½ games behind the Cardinals, making the postseason picture look bleak. But the team played better in August (18–14), while every other team in the division played poorly. The Mets finished the month in fifth place (out of six teams), but had shortened the distance between themselves and the Cardinals to 5½ games. This means that they were in the pennant race — on the fringe, to be sure, but not to be counted out with certainty.
The NL East division race in September 1973 deserves an article of its own. (And in fact, that race is part of the story in Matthew Silverman’s Swinging ’73: Baseball’s Wildest Season.) The Mets, Pirates, and Cardinals battled down to the wire, with the three teams within two games of each other going into the final weekend of play. The Mets finally clinched the division on Monday, October 1, when they defeated the Cubs in a makeup game from earlier that season.
The Mets’ reward for winning the East Division with 82 wins was a date with the mighty 99-win Cincinnati Reds in the NLCS. On paper the series was a mismatch, but Mets pitching put some sand in the gears of the Big Red Machine. The Reds scored only two runs in four of the five games (versus the Reds’ average of 4.57 runs per game all season) and the Mets prevailed in the series with a 7–2 win in Game Five, behind the pitching of Tom Seaver. This victory earned the Mets a trip to their second World Series in five years.
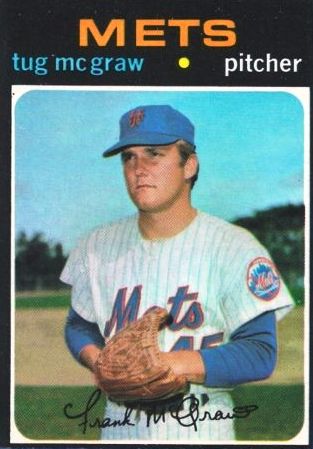
Their opponent was the defending champion Oakland Athletics. Once again, the Mets appeared to be outmatched. And once again, the Mets’ pitching kept them competitive. The first three games were very close affairs, and the teams alternated wins over the first four games of the series. Game Five was the final home game for the Mets. Jerry Koosman and Tug McGraw combined to shut the A’s out. With the 2–0 victory, the Mets were now one victory away from their second championship.
The prospect of earning that win seemed very favorable. The Mets had to win only one of the following two games, and 19-game winner Tom Seaver was slated to start the next game on short rest. Hindsight suggests Yogi Berra should have saved Seaver for Game Seven so he could have pitched on regular rest, but Berra argued that that he was going for the win with his best pitcher in Game Six. Seaver pitched well in Game Six, giving up just two runs in seven innings. But Catfish Hunter was even better. He only allowed one run over his 7 1/3 innings, and the A’s won Game Six by a score of 3–1 to force a Game Seven.
The starting pitchers for Game Seven were 14-game winner Jon Matlack for the Mets, and 21-game winner Ken Holtzman for the A’s. Game Seven was scoreless for the first two innings. But Bert Campaneris and Reggie Jackson each hit two-run home runs off Matlack in the bottom of the third, which gave the A’s a 4–0 lead. That was all the run production that Holtzman needed, and the A’s went on to win the game, and the World Series, by a score of 5–2. The Mets fell one victory short of their second championship.
Conclusion
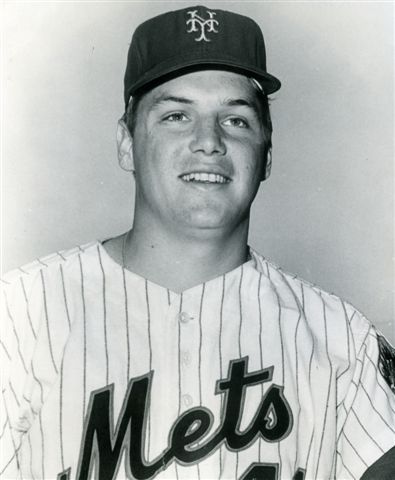
The Mets’ surprising World Series victory in 1969 is often perceived as the lone successful season in the first 20 years of franchise existence. But that perception is wrong. The Mets were competitive from 1969 through 1973 because of a stellar pitching staff headed by Tom Seaver, Jerry Koosman, and Tug McGraw for that whole time period. Nolan Ryan was part of the staff from 1966–1971, although he was still learning his craft during his time with the Mets. Jon Matlack joined Seaver and Koosman as an important cog in the pitching staff during 1972 and 1973. The Mets came within one victory of a second championship in 1973. So even though the team won just one World Series before 1986, the Mets had a window of success in the early 1970s that is usually not recognized.
DOUGLAS JORDAN is a professor at Sonoma State University in Northern California where he teaches corporate finance and investments. He has been a SABR member since 2014 and has been contributing articles to BRJ since 2014. He runs marathons when he’s not watching or writing about baseball. You can contact him at jordand@sonoma.edu.
Acknowledgements
My thanks to two peer reviewers for their input. Their comments improved the paper substantially.
Notes
1 A statistical quirk from the 1970 season is interesting: The team won exactly 15 games in each of May, June, July, and September. So the team had the same number of wins in four of six months.