

Greatest Catchers: A Composite Ranking Methodology
This article was written by Chuck Rosciam
This article was published in Summer 2009 Baseball Research Journal
Who is the greatest catcher to have ever played in the major leagues? Some might say it is Yogi Berra or Johnny Bench or Roy Campanella. The answer depends on what one uses as a measure of greatness.
There have been numerous measures used or proposed 1 and numerous lists 2 ranking the great backstops. All of these measures have merit. All have their proponents and their opponents. From my perspective, the greatest catcher is a player who excels on offense and defense far better than his contemporaries and better than all other backstops relative to their contemporaries. So, the task is to find a measure that encompasses these qualities with some objective and quantifiable scale.
A study was undertaken not to invent a new statistic but rather to merge the majority of the existing measures of performance—both offensive and defensive—into one composite value that would answer the question.
Since 1876, there have been 1,693 players whose career position was as a catcher.3 Additionally, there have been 429 other players who have caught in one or more games, such as Cap Anson (105 games caught) and Jimmie Foxx (108). Out of these 2,122 players, how does one narrow down the list to a select group of the greatest catchers? I chose 800 (or more) games caught in a career (and games caught >50 percent of games played) as the criterion. That translates, on average, into a rough minimum of ten years catching half of one’s team’s games (10 x 80). It should be noted that the average number of games behind the plate each season for starting catchers is about 100 (99.7 for 1904–60 and 108.6 after 1960). So it would take roughly eight years as a starter to qualify. Furthermore, there have been only 980 catchers (out of the 1,693) with three or more years of major-league catching service who have averaged about 55.1 games per season.
Additionally, the minimum number of years of service for Hall of Fame consideration is ten. This effectively narrows the pool of catchers down to 166 to analyze, just 10 percent of all career catchers—the cream of the crop.
What measures of greatness should be used in building a composite ranking system? I chose five of the most commonly used offensive and five of the generally accepted defensive measures.
The first two offensive measures (OBP and SLG) could have been combined into the additive measure of OPS, but this dilutes the strength of either/both. I chose both runs created (RC) and win shares (WS) because both are widely used and measure different skills. (WS includes RC batting/baserunning plus fielding and pitching). The stats used for offense were the career totals (all positions), even though some players, like Gene Tenace and Mickey Tettleton, might have spent a lot of time at other positions. Both played more than 50 percent of their games as a catcher. Offensive stats while playing as a catcher could not be parsed out for the period before the 1950s, so career totals were used. On the offensive side the selected measures are:
Table 1. Offensive Measures
- On-base percentage (OBP)
- Slugging average (SLG)
- Adjusted batting runs4 (BRA)
- Runs created per game5 (RC27)
- Win shares6 (WS)
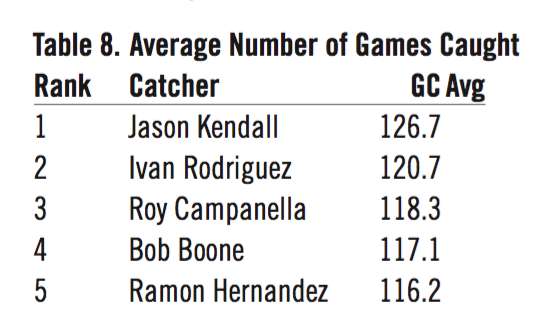
On the defensive side I chose the below five measures (table 2). Average number of games caught reflects the player’s stamina throughout the season and his career. It should be noted that the individual may or may not have played other positions at the time or had been a bench-warming backup. It also gives credit to those guys whose career was spent entirely, or nearly so, at the position (e.g., Mickey Cochrane played 1,451 games behind the plate and one game in the outfield) and gives credit to someone like Ray Mueller, who caught all of 155 games for the Reds in 1944. Moreover, it demotes guys like Gene Tenace, who played 670 games at other positions (not including appearances as a designated hitter or pinch-hitter) and just 892 games as catcher. The lowest-ranking catcher for GCAvg is Greg Myers, who managed to catch only 47.1 per year (out of the 162-game schedule).
I did not include the long-used fielding percentage because a very large component is putouts, which include strikeouts and depends greatly on the pitchers whom the catcher works with. A better measure would have been to only include independent putouts especially if he’s a knuckleballer like Hoyt Wilhelm, Phil Niekro, or Tim Wakefield.
Not included is the currently popular caught-stealing percentage (CS%), because data for that is complete only for games since the 1950s, and Palmer’s range and throwing stats include stolen bases and caught stealing. I did not use catcher’s earned run average (CERA) because my previous study, Keith Woolner’s study, and Tom Hanrahan’s study 7 all indicate that, although there is a difference between catchers in pitcher ERA and in CERA, as backstops gain experience over time, the difference in any given year is not statistically significant.
Table 2. Defensive Measures
- Average number of games caught (GCAvg)
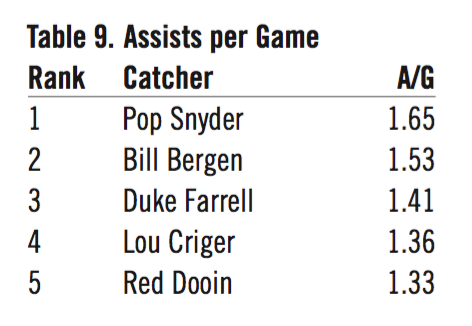
- Assists per game average (A/G)
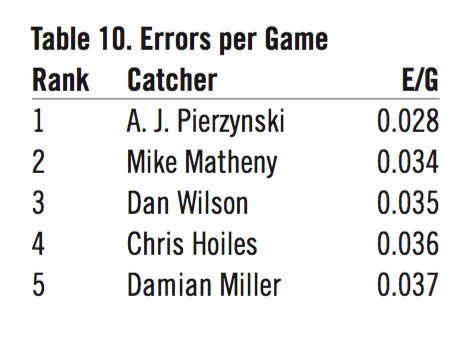
- Errors per game average (E/G)
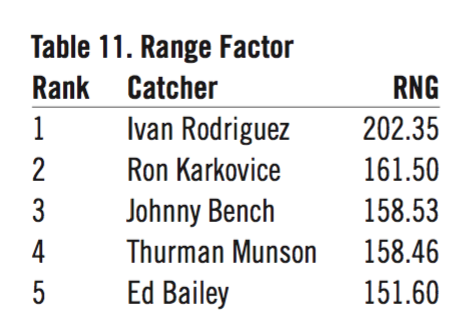
- Range (Rng)8
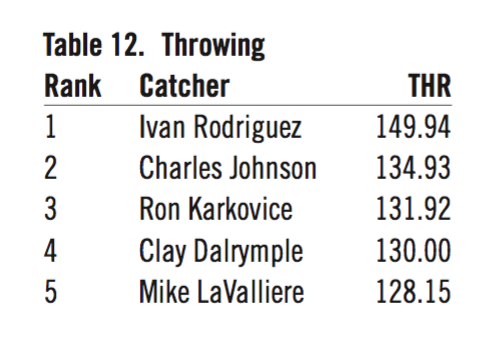
- Throwing (Thr)9
Before I begin to “merge” these ten measures into a single, composite measure for ranking greatness, I will display the top five catchers in each of the ten categories. This will give you an idea of the variety of values involved and the different catchers ranked under each methodology.
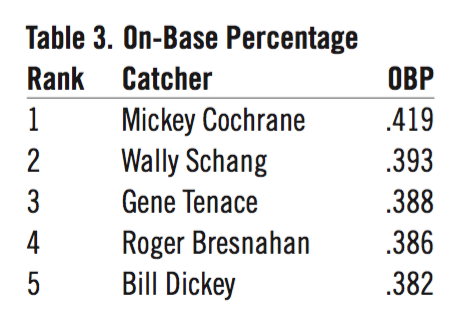
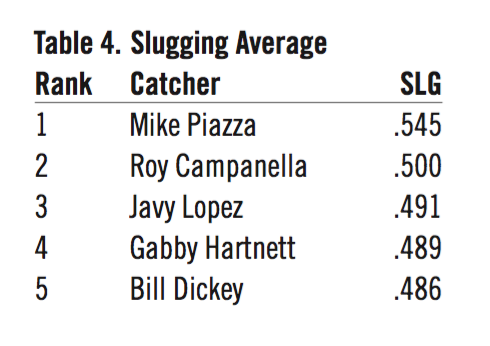
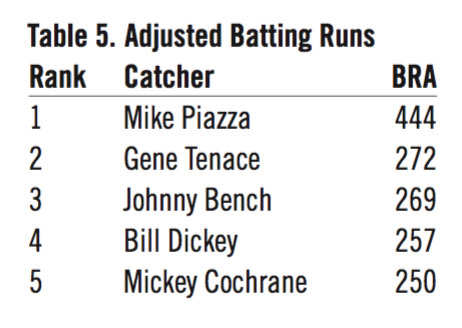
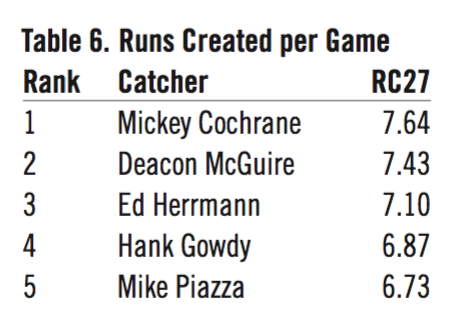
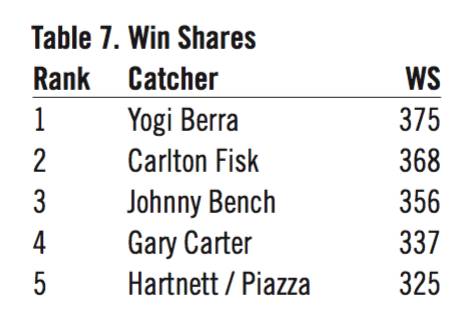
Although win shares is grouped under offense, the WS formulas include a defensive component as well, and adjustments are made for this later on. From just these five offensive “top fives,” we have 16 different catchers out of the 25 slots. This distribution alone indicates that there must be some composite measure that takes into account these different ways to look at offense.
Additionally, there is defense to consider.
With defense included, there are now 36 different catchers occupying 50 top-five slots. Mickey Cochrane appears more often in the above ten lists than does Yogi Berra. Does this mean Cochrane is greater than Berra? The answer is no. What is displayed in the above ten tables is nothing more than a set of ten different perspectives of a catcher’s career, expressed in a variety of stat values covering more than a hundred years of different game environments and styles of play. It’s an interesting set of lists, but it doesn’t answer the question fully.
Because these ten measures have completely different resultant values and different contexts, a four-step methodology was deployed to put them all into the same scale and context.
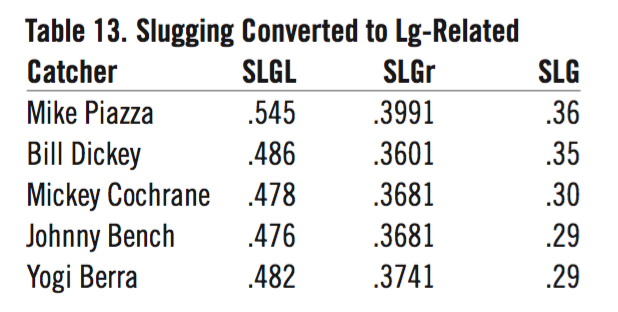
Step 1 was to convert the raw measures into the league relationship in which each was compared to the league-average catcher for that year. One (1.00) would be the league average, and above that would be better than the league average. Below 1.00 would be worse than the league-average catcher. This puts the raw values into a common scale and into equal context. So a catcher in an era where there were a lot of assists would not gain an advantage over one in a low-assist era. Every stat was divided by that of the league-average catcher. That would mean that a value of 2.00 in slugging meant twice the league average, irrespective of the accumulated stats or in what year or league it was accomplished. For example, Yogi Berra’s slugging average (SLG) is .482, and the league average for the 19 years he played averaged .372. Dividing Berra’s SLG by the LgSLG equals 1.29 (r-SLG). This is the fifth best all-time for catchers. The top five slugging averages relative to the league averages are shown in table 13.
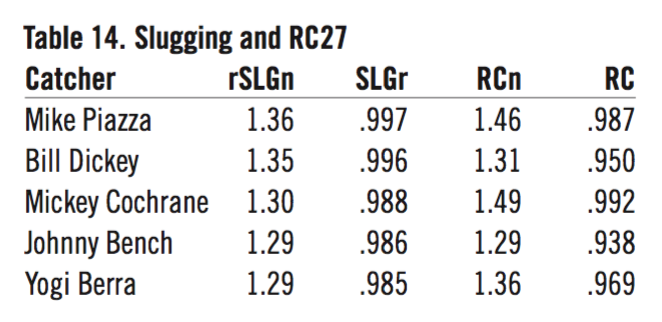
Step 2 was to normalize 10 these ten relationships by scaling them all from 0.00 to 1.00 in proportion to their individual measure differences. The process used was a z-score. This facilitated combining the ten disparate stats into a form of some equality (apples to apples). For example, Berra’s SLG-to-LgSLG relationship of 1.29 ranked fifth out of 166, behind first-place Mike Piazza (1.36) and ahead of ninth-place Carlton Fisk (1.24). But the numerical differences don’t mean anything when we’re trying to compare them to the numerical differences in RC27, with Piazza at 1.46, Berra at 1.36, and Fisk at 1.17. So, the z-score range of 0 to 1 is the answer. All measures would be on the same scale of differences. Taking the same five catchers from Table 13 and showing their SLG and RC27 values in a league-relative and a normalized state, we get:
Once normalized, the five offensive measures could now be combined in some fashion in a third step.
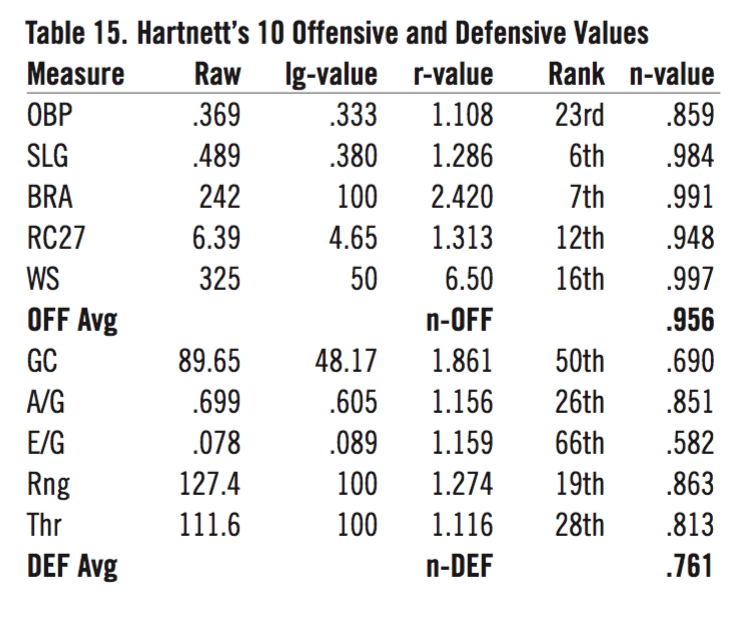
In step 3, I chose to average them so that the resultant values remained between 0 and 1. The same was done with the five defensive measures. To demonstrate from beginning to end (raw and league to league-related to normalized), Gabby Hartnett’s offensive and defensive values are shown in table 15.
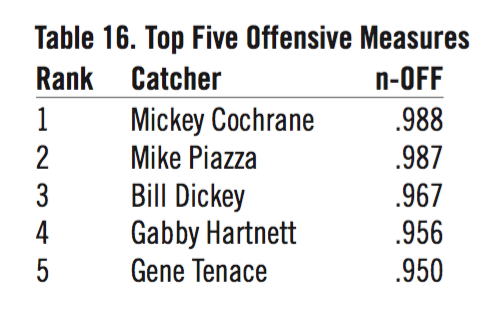
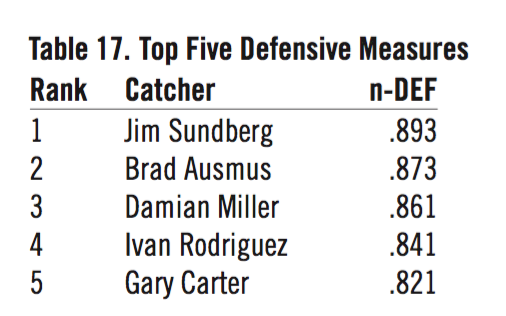
Tables 16 and 17 show the top five catchers with their five normalized stats averaged for offense (n-OFF) and for defense (n-DEF).
Step 4, the final step, was to weight the offense and the defense based on the strength and scope of the measures involved and on the general perception of what makes a catcher great. Unfortunately, this is a matter of one’s own opinion and open to much debate. However, taking my cue from Bill James in the various win-shares formulas for catchers,11 I assigned two-thirds weight to offense and one-third to defense — primarily because win shares includes a defensive component and it’s included under offense. In addition, two-thirds of the time catchers earned their win shares for batting and baserunning. Others might wish to assign each weight equally or to use different percentages based on their own analysis.
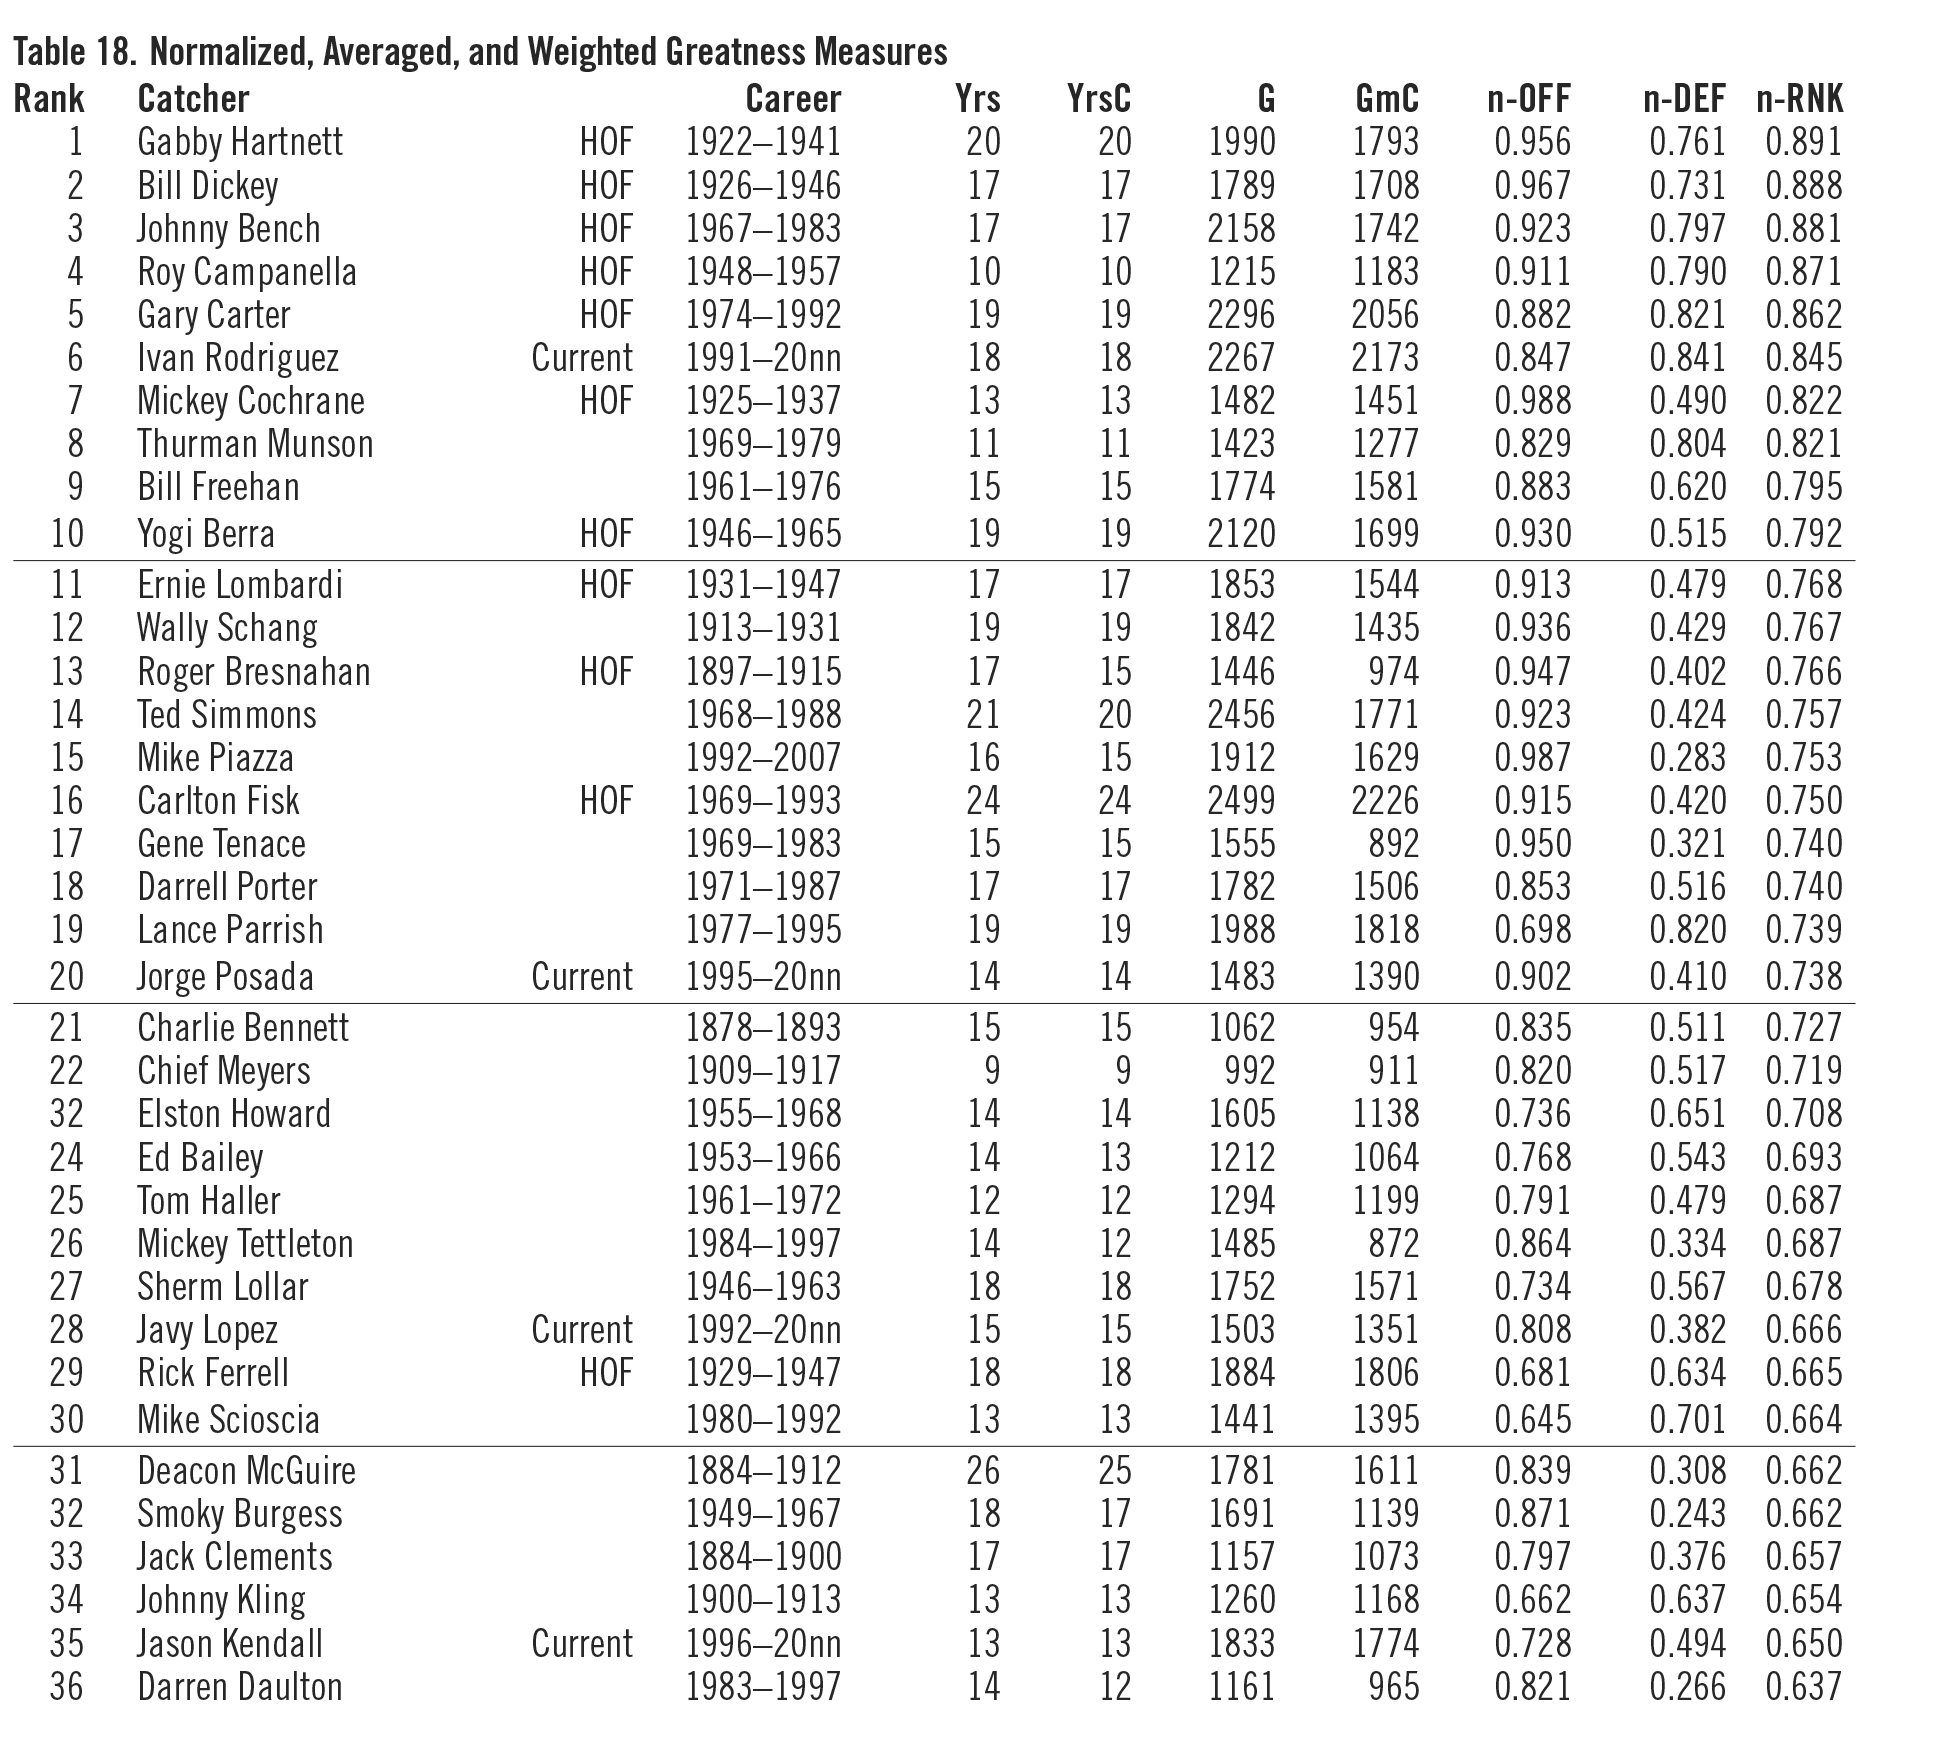
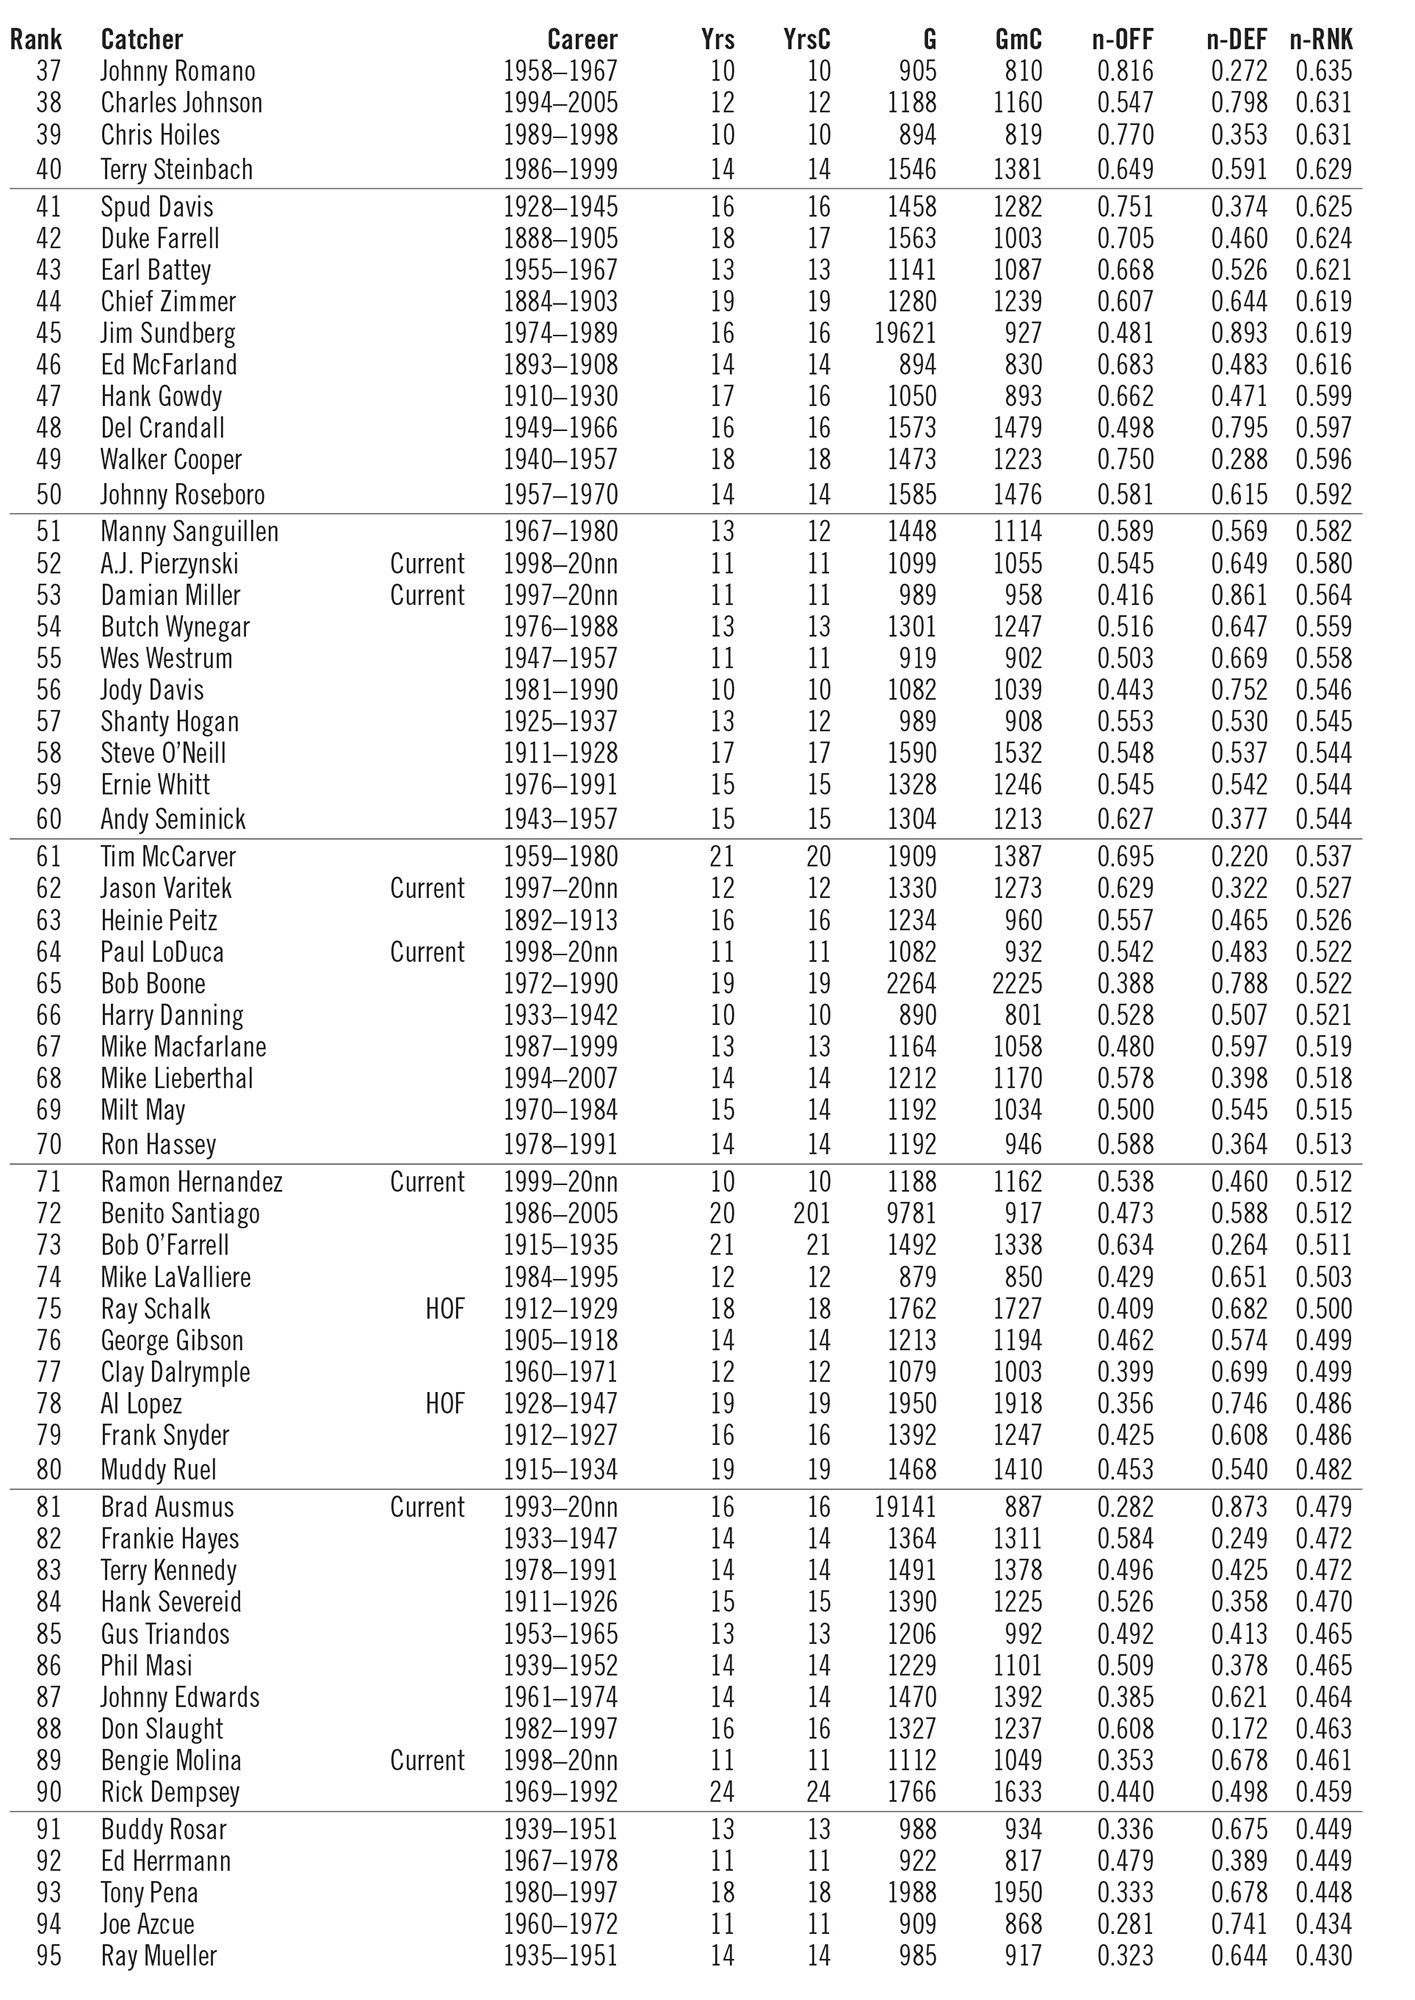
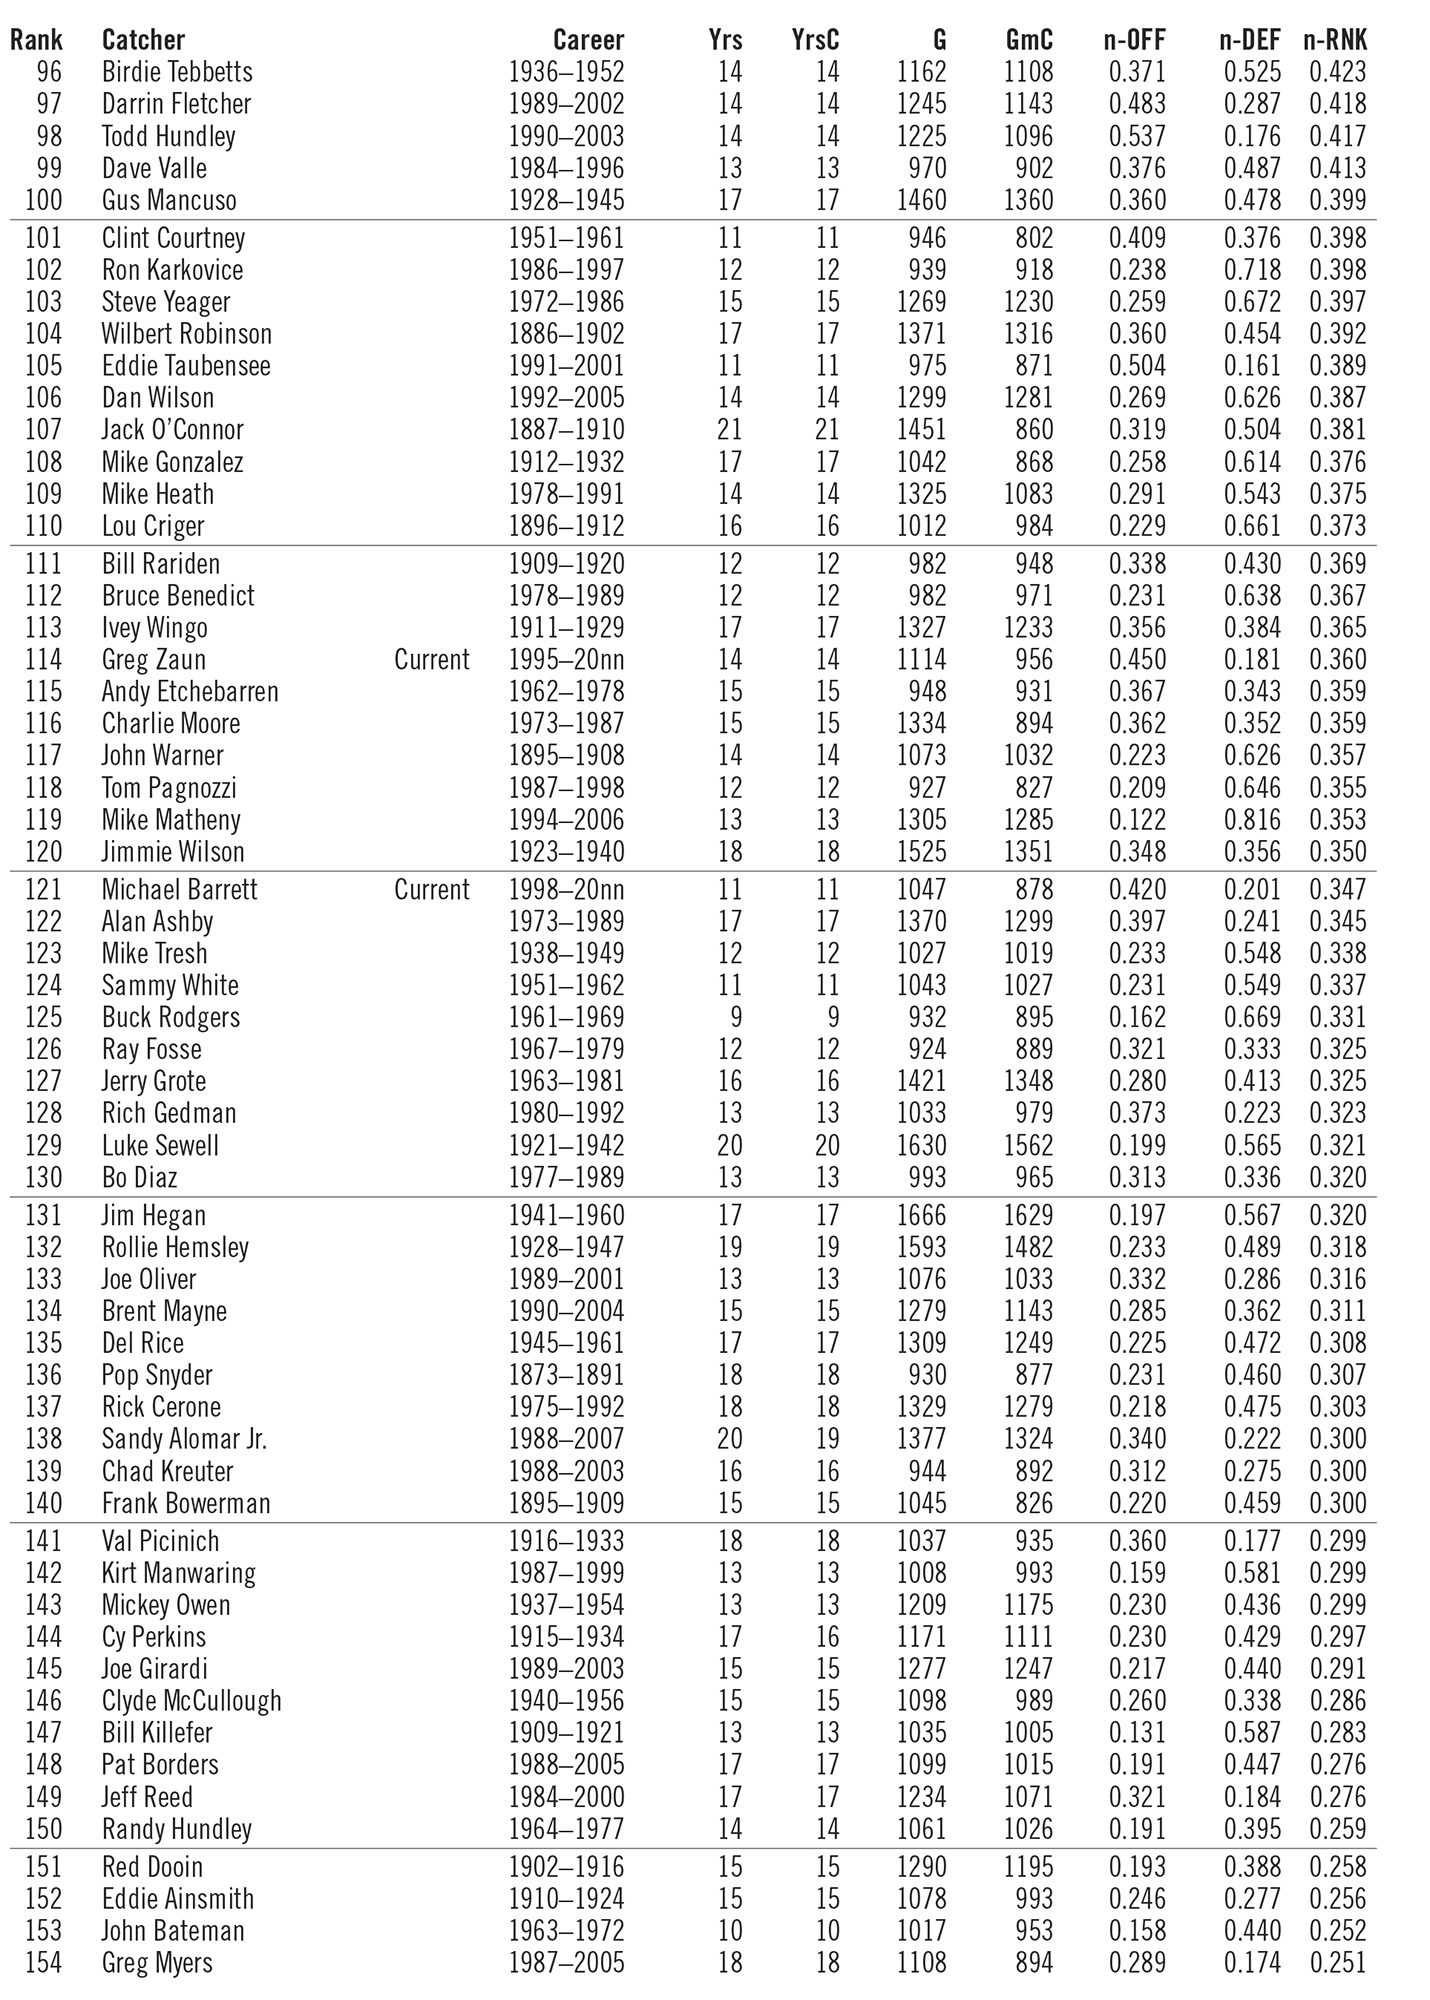
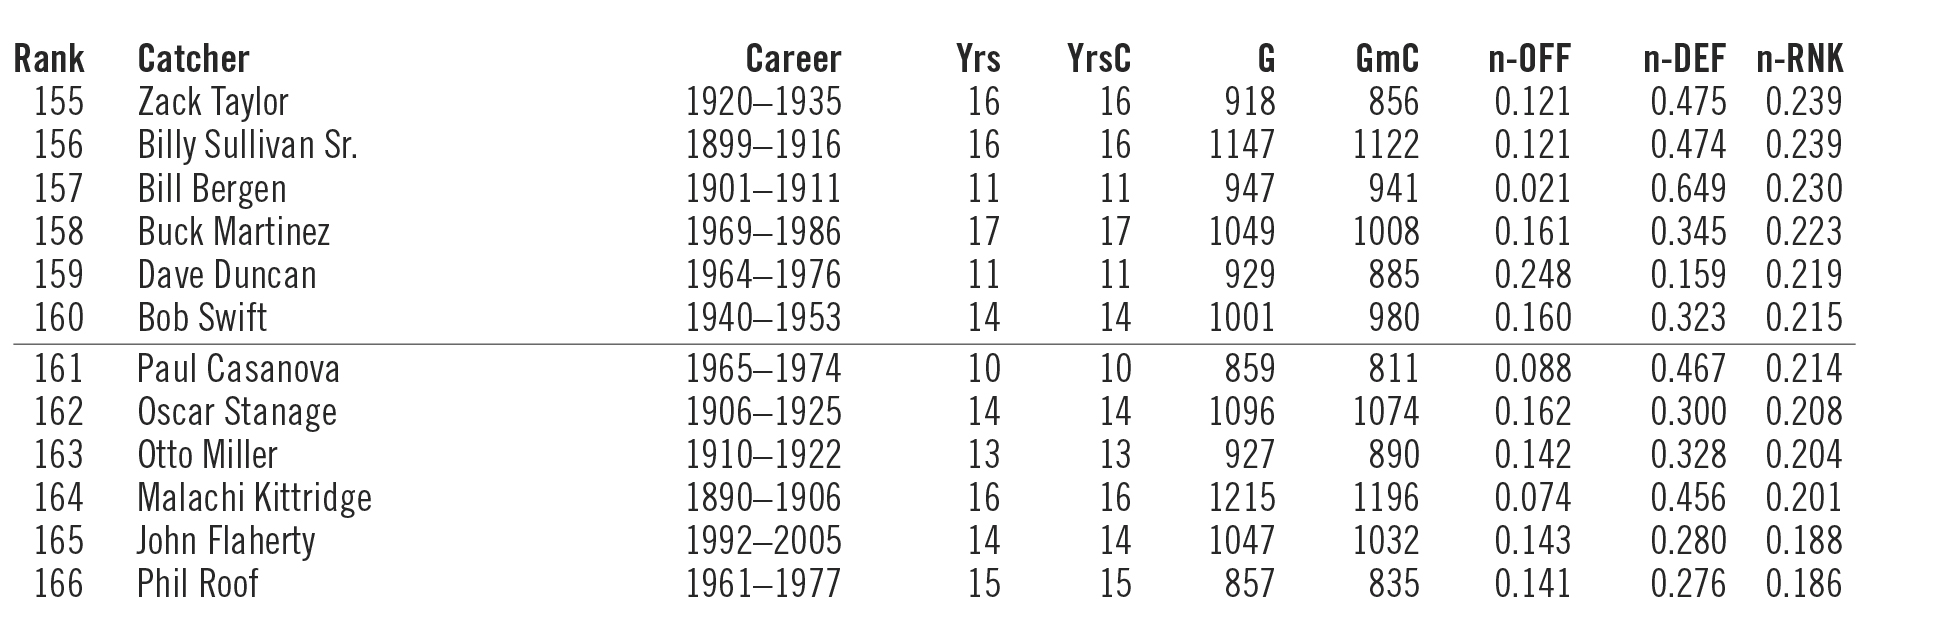
Table 18 (see below) lists all 166 catchers (800+ games caught and >50% games played as a catcher) with their years in the majors, years catching, games played, games caught, and their normalized offensive average (n-OFF), their normalized defensive average (n-DEF), and their overall normalized average (n-RNK)— weighted .667 offense and .333 defense.
From my perspective, Gabby Hartnett tops the list of greatest catchers and is one of the very best to have ever donned the “tools of ignorance.” You’ll note that seven of the top ten are already enshrined in the Hall of Fame. Thurman Munson and Bill Freehan should have gone in, and Ivan Rodriguez is a currently active player who may well be a first-year selection. The second group of ten (11–20) are well known for their offense but somewhat lacking in their defense, as indicated by the n-DEF rankings. However, they are all Hall of Fame–caliber backstops.
What is important is not who number 1 is, as that can change by adjusting what measures are used and how they are weighted, but rather who is in the top 10 to 20 percent and who is not.
I leave it up to the readers to add or subtract or choose their own 10 measures and to weigh the offense and defense based on their own research and analysis. However, the methodology presented here is one nice, logical way to create a merged composite ranking from all of those performance measures out there. For this old catcher, the ranking results of this research in determining the greatest catchers is sound.
Table 18. Normalized, Averaged, and Weighted Greatness Measures
(Click images to enlarge)
Acknowledgments
Thanks to Tom Hanrahan and Pete Palmer for their help in this research and to Phil Birnbaum, Dan Heisman, Trent McCotter, and Nick Frankovich for their review and comments.
Notes
- Catcher-performance measures such as Bill James’s win shares, runs created, or his new loss shares; Pete Palmer and Gary Gillette’s batting runs and fielding runs (in The ESPN Baseball Encyclopedia, 5th , ed. Gary Gillette and Pete Palmer [New York: Sterling, 2008]); John Thorn and Phil Birnbaum and Bill Deane’s total player rating (TPR, in Total Baseball: The Official Encyclopedia of Major League Baseball, 5th ed., ed. John Thorn, Pete Palmer, et al. [New York: Viking, 1997]), catcher’s earned-run average (CERA), OPS (on-base percentage plus slugging average), Clay Davenport’s wins above replacement (WARP at baseballprospectus.com), and Charles F. Faber’s baseball ratings (batting and fielding points, Baseball Ratings: The All-Time Best Players at Each Position, 2d ed. [Jefferson, N.C.: McFarland, 1995]).
- Keith Carlson’s article “A Comparison of Catcher Evaluation Statistics” in SABR’s By the Numbers (February 2006) is one example of listing catchers by ranked statistics.
- Data through 2008, with career position determined as playing the majority of one’s games at that Data for 1954–2008 from Retrosheet.org.
- Adjusted batting runs, as developed by Pete Palmer and published in The ESPN Baseball Encyclopedia, 5th ed. (New York: Sterling, 2008). Runs created per game, as developed by Bill James and published in Major League Handbooks, various editions.
- Runs created per game, as developed by Bill James and published in Major League Handbooks, various editions.
- Win shares, as developed by Bill James and published in Win Shares, by Bill James and Jim Henzler (Morton Grove, : Stats Publishing, 2002).
- Keith Woolner, “Field General or Backstop?” Baseball Prospectus 10 (January 2000); and Tom Hanrahan, “Catcher ERA—Once More With Feeling,” By the Numbers (November 2004), and reprinted in this volume, The Baseball Research Journal 38 (Summer 2009): 59–61.
- Range (based on stolen bases allowed per inning) as developed by Pete Palmer and published in the The ESPN Baseball Encyclopedia, 5th ed.
- Throwing (based on caught-stealing percentage) as developed by Pete Palmer and published in the The ESPN Baseball Encyclopedia, 5th ed.
- The formula for normalizing the data is the common statistical normal cumulative distribution for the mean and the standard deviation of the data (z-score).
- From a sample of 100+ catchers’ win shares broken down by their “hitting” and “fielding” components, it was determined that “hitting” constituted .667 (two-thirds) and “fielding” .333 (one-third) of the win shares.