

Clutch Hitting Revisited
This article was written by Dick Cramer - Pete Palmer
This article was published in 2008 Baseball Research Journal
Do clutch hitters exist? More precisely, are there any batters whose performance in critical game situations consistently exceeds expectations, as established both by that batter’s performance in less critical situations and also by the relative performance of average batters in critical game situations?
Thirty years ago one of us published a first investigation of clutch hitting,1 using 1969 and 1970 data2 that at the time seemed the only play-by-play information that might ever become available. Its conclusions, that any clutch abilities were too slight to be either detectable or meaningful, have been confirmed repeatedly3 as much more data have emerged. However, skepticism remains. The occasional stresses that all of us experience in our daily lives are certainly felt as negative influences on our own “clutch performances,” and professional athletes in particular often talk about the challenge of contending with the pressures of critical game situations. This “clutch hitting” dialogue exemplifies the fascinating contrasts that occasionally arise about reality—contrasts between human perceptions and the results of objective investigation.
For example, recently Bill James4 has proposed that the existence of clutch hitters, as exemplified by David Ortiz’s recent heroics, is obscured by “fog”—that is, the unavoidable random variation in the performances of all players and game situations that underlie those objective investigations. Perhaps, he says, clutch hitting is a strong, and so more consistent and detectable, ability only for certain classes of players, identifiable by their personality type or overall hitting style.
In response we have performed several new studies, taking fullest advantage of the last fifty years of play-by-play that Retrosheet5 now provides, seeking objective answers to the following additional questions about clutch hitting.
- Do major-league batting performances actually decline in critical game situations?
- How thick is that “fog” that Bill reminds us about?
- Over the past fifty years, what are the largest “clutch” or “non-clutch” career performances?
- With respect to Bill’s proposed player classes, how many players would need to be members in order to be persuasive about clutch hitting?
- Would a “clutch hitting” skill reflect well on the players who possessed it?
For those readers who prefer conclusions without statistical equations or argumentative logic, here are those objective answers.
- The average batting production by major-league players with runners in scoring position, as measured by OPS from 1957 through 2007, is indistinguishable (if anything very slightly higher) for the 15 percent of plate appearances when the game is late and close (as defined by Elias), once appropriate corrections are made for the observable distinctions of late and close situations, with a substantial superiority of the pitchers offsetting a greater frequency of intentional walks and a modest superiority of the
- The “fog” of random statistical variation is much greater than most baseball fans realize, even those with an analytical Indeed, that random variability has about the same effect on season outcomes such as batting titles and pennant winners as do differences among player skills. Also, as the number of high-pressure game situations that any individual batter encounters is small, objective evidence that some particular hitter’s superior record in clutch situations is a skill rather than a chance result is very unlikely ever to appear. To that extent, we agree with Bill James.
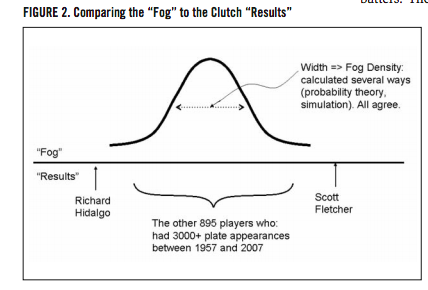
- On a career basis, David Ortiz and a different clutch-hitter nominee,6 Mark Grace, are both around a third of the way down a ranked list of “clutch performances,” among all players with 3,000 plate appearances from 1957 through Positive, but hardly remarkable. The best career clutch performance of the last half-century was by Scott Fletcher, who on average contributed to his teams about ten more runs per year (or one game per season in the standings) than his season statistics imply.7 At the bottom of the ranked list is Richard Hidalgo, who contributed ten fewer runs. The overall distribution of these 897 career clutch performances is entirely consistent with chance deviations around our first finding, that batters in general perform no differently in clutch situations.8
- The considerable thickness of the fog also makes identifying any class of players likely to possess a “clutch ability” into a considerable challenge. Inspection of the ranked list does suggest a tendency for power hitters to provide lower clutch perform. However this tendency may also reflect slight weaknesses in the metrics we have used.
- The concluding suggestion was that clutch abilities are too slight to be either detectable or meaningful. We also now know that batters in general perform no differently in clutch If a batter’s performance in clutch situations truly exceeded that in other situations, might that not indicate that he was putting forward a less than maximal effort in non-clutch situations? Why would that be a desirable player characteristic?
We now describe, in general terms, the studies that lead to these conclusions (methodological details, of course, being available from the authors). First, perhaps the most important new finding. We compare the general performance of batters in tense game situations with performance in all situations, for two groups—one based on the Elias definition of “late and close” and involving all major-league plate appearances from 1957 through 1979, and the other based on the Mills brothers’ model (see below) and involving only the previously mentioned group of 897 players whose major-league careers were clearly more successful. For this purpose we use the widely accepted OPS metric, as introduced by one of us.9 Here are the results.
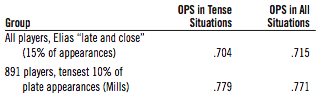
Certainly factors other than tension affect the average outcome of “late and close” plate appearances. The best available pitchers will be used (depressing OPS in tense situations), but pinch-hitters are used more and
intentional walks occur twice as often (raising OPS in tense situations). However, we estimate that these factors roughly cancel one another, so that, as the tabulated OPS values themselves suggest, the performance of major-league hitters is little if at all affected by game-situation tension.
Further investigations require a working definition of pure clutch performance, and we follow other analysts in using the approach that the Mills brothers pioneered.10 The probable outcome of any game fluctuates at-bat by at-bat until the game ends, and this probability fluctuation constitutes a “win value,” a positive or negative contribution that a batter makes to his team’s chance of winning and that is determined by the outcome of each and every plate appearance. The sum of these win values over every appearance in a particular batter’s career becomes a direct measurement of that batter’s total win value. Division of that total performance by the number of plate appearances yields the batter’s average win performance.
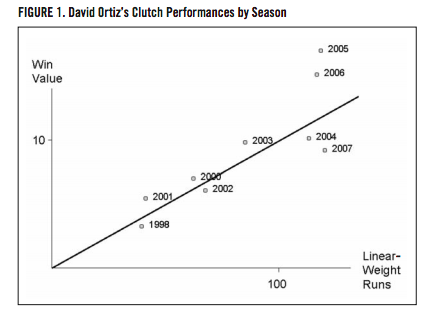
However, there is a general propensity for superior hitters to have superior win performances in any game situation. In order to isolate “clutchness,” a possible tendency for a hitter to be more effective in critical game situations, this general propensity must be removed from that hitter’s total win value. Linear weights (also introduced by one of us) provide a thoroughly tested measure of situation-independent hitting skill. We can then compare these two measurements, win performances depending only on how the probability of victory changed after each plate performance, and linear weights depending only on the fundamental counting statistics. Correlation of the 897 players’ seasonal win performances now available with their corresponding linear-weight totals yields this general propensity, as depicted by the diagonal line in figure 1. The “clutch” or “non-clutch” performance of a player in a particular season then becomes the distance by which his total win performance in that season lies above or below the particular position on that diagonal determined by his linear-weight total. Figure 1 also shows these “clutchness” results for each season of David Ortiz’s career. His reputation for clutch ability was built in 2005 and 2006. His hitting in 2007 was even slightly better overall (the 2007 point is farther to the right of the graph) but less timely (the 2007 point is also lower), yielding a lower-than-average “clutchness” result.
However, no one doubts that baseball is a “percentage game”—that, because of batter-uncontrollability and therefore random variations such as “bad bounces” and “fat pitches,” good performances can produce bad results and vice versa. To what extent might David Ortiz’s historically superior clutch performances in 2005 and 2006 be matters of good fortune? This type of question motivated us to estimate the general magnitudes of these inevitable and unavoidable random variations in both win value and linear-weight performances, using a variety of computer-modeling approaches.
Another way of expressing this central concern is shown in figure 2, which compares the “clutch performance results” we have just defined (at the bottom) with a curve representing our various estimates (which all agree within 10 percent or so) of these random variations in clutch performance (or, in Bill James’s language, the density of the “fog”). As the graph suggests and as probability theory confirms, nothing in the overall distribution of “clutch-performance results” for the 897 most active batters over the past fifty years proposes that their “cause” is anything other than random fluctuations.
Because of both the importance of the result and the uncertainties resulting from any individual computer model, the largest component of this study involved devising and applying several independent computational approaches. The agreement among their results is encouraging.
Here are brief descriptions of these approaches:
- Direct simulation, or actual “play” of 1,220 games with 18 similar batters and using the same outcome probabilities regardless of “game situation.”
- Actual “clutchness” distributions are compared with a performance distribution that is undoubtedly random—in this case, the remainder from dividing the day of the month of the game by 10 is compared with actual seasonal win-performance-to-linear-weight “clutchness.”
Considering that Ortiz’s two greatest “clutch” seasons were consecutive, perhaps suggesting that “clutch ability” is real but fleeting, we recapitulated a key component of the original study by calculating the correlation coefficient between “clutch performance results” in all consecutive seasons of at least 250 BFPs each for every one of those 895 most successful batters. The resulting r2 value of .002 is as inconsequential as it looks. For comparison, the r2 value in consecutive seasons for OPS itself is 0.43.
Presumably batters feel pressure most strongly at the starts of their major-league careers, when they are still unproven. However the batting average of these 895 batters in their first hundred BFP, .260, is not very different from their collective career batting average.
Thus the results of the original study11 are yet again confirmed, this time by every analytic approach we could devise and mostly when 50 seasons of major-league play were used. Over this period there is no convincing evidence that any fluctuation of any batter’s performance in tense situations has had any cause beyond random variation. Furthermore, because overall batting performance is unaffected by game situation, there would be no honor in being identified as a clutch hitter. Why shouldn’t a major-league batting professional give his best effort regardless of the game situation?
This conundrum will no doubt continue, the conflict between the common feeling that tension undermines batting performances in critical game situations—a feeling expressed even by many of the most experienced and successful major-league batters—and the actual outcomes of such situations.
DICK CRAMER, co-founder of STATS, Inc., and a member of SABR since 1972, lives in Santa Fe, New Mexico, and is chief scientific officer at Tripos Discovery Informatics.
PETE PALMER is the coauthor (with John Thorn and David Reuther) of The Hidden Game of Baseball: A Revolutionary Approach to the Game and Its Statitiscs (Doubleday, 1985) and co-editor (with Gary Gillettte) of The ESPN Baseball Encyclopedia, fifth edition (Barnes and Noble, 2008). Palmer introduced on-base average as an official statistic for the American League in 1979 and invented on-base plus slugging, now universally used as a measure of batting strength. A member of SABR since 1973, Palmer is also a contributor to The Complete Baseball Record Book (The Sporting News) and The Official Major League Fact Book (The Sporting News) as well as Who’s Who in Baseball (Baseball Magazine).
Notes
- Richard Cramer, “Do Clutch Hitters Exist?” Baseball Research Journal (1977): 74–79.
- Eldon Mills and Harlan D. Mills, Player Win Averages: A Computer Guide to Winning Baseball Players (South Brunswick, N.J.: A. S. Barnes, 1970); 1970 data provided by Pete Palmer.
- Cyril Morong, Clutch Hitting Links, https://geocities.com/cyrilmorong@sbcglobal.net/ClutchLinks2.htm.
- Bill James, “Mr Clutch: Big Papi, Chipper, Pujols Come Through When It Counts,” sportsillustrated.cnn.com, http://sportsillustrated.cnn.com/2007/baseball/mlb/11/30/james.clutch/index.html, 30 November 2007; Bill James, “Underestimating the Fog,” Baseball Research Journal 33 (2004): 29–33.
- Tom Tango, Mitchel G. Lichtman, and Andrew E. Dolphin, The Book: Playing the Percentages in Baseball (N.p.: TMA Press, 2006).
- Ibid.
- On updating these results to include Retrosheet’s additional data back to 1954 and thereby adding Vic Wertz, his clutch contributions (during the last half of his career) averaged 14 runs/season more than his conventional statistics imply, making Wertz by far the highest extended clutch performer of the last half-century.
- SABR, sabr.org, Publications / Journals / Addenda; Retrosheet, http://www.retrosheet.org/lifetime_clutch.htm.
- John Thorn and Pete Palmer, Total Baseball (New York: Warner Books, 1989).
- Mills and Mills, Player Win Averages.
- Cramer, “Do Clutch Hitters Exist?” BRJ (1977).