

Comparisons: Is N.L. Really Better? Study Raises Doubts
This article was written by Bill Kross
This article was published in 1984 Baseball Research Journal
In addition to the traditional fireworks displays on Independence Day columnist Bill Conlin lit the fuse for a fireworks display that has not yet ended with an article on “Parity Between the Leagues” in the July 4, 1981 issue of The Sporting News. “The Lords of baseball”, wrote Conlin, “. . . had better start showing some concern over the widening gap between the National and American League . . . Of the ten leading hitters in the National League, all are charter members who have played their major league careers there. In the American League top ten, five players . . . are former National Leaguers . . . The league crossovers have not been nearly so kind to American League expatriates.”
Conlin cited the National League’s recent domination of the All-Star Game and a list of American League stars who were National League castoffs – Amos Otis, Mike Torrez, Miguel Dilone and Willie Randolph among others – as additional evidence of N.L. superiority.
The reaction, of course, was vehement. Many American League fans properly pointed to George Hendrick, Bill Robinson and Dave Collins as American League “expatriates” who more than held their own in the National League. The controversy rages on.
Recent N.L. dominance of the All-Star classic is puzzling if “parity” exists between the leagues. Beginning in 1963 and ending with 1982, the senior circuit won 19 of the 20 games between the two major leagues. Baltimore’s former manager, Earl Weaver, when asked a few years ago about the N.L. `s recent domination of the midyear classic, responded: “The only explanation I can give is they (the N.L.) end up with more runs.” However if the two leagues are truly equal, the American League should “end up with more runs” about half the time.
Take a series of coin flips as an analogy. If “parity” exists between the two sides, heads should appear as often as tails. So if the leagues are truly equal, a series of 19 N.L. wins in 20 All-Star Games should happen about once every 50,000 years!!
Since recent All-Star Game results are unlikely to be due to chance alone, a scientific examination of the possible causes of National League dominance is desirable. The most obvious possible cause, and the cause to which this research is addressed, is that the N.L. has a higher level of competition than the A.L.
Because of recent A.L. expansion, one might expect to find evidence of a slightly higher level of competition in the N.L. However, if overall N.L. superiority is the underlying cause of recent N.L. performance in the All-Star Game, then we should find overwhelming evidence of this superiority.
The only meaningful way to address this issue is to study the players who have played in both leagues and attempt to measure the relative performances of each player in each league. The procedure, however, must be put into perspective. First, it would not be fair to include the differential league performance of players such as Willie Randolph, who only had a “cup of coffee” in the N.L. Players like these suffered growing pains on the bench in the N.L. and matured later. So the sample was restricted to players who performed for at least two full seasons in each league.
Second, factors such as league expansion, rule changes, changes in the elasticity of the baseball, etc., affect a player’s performance from year to year. For example, the lowering of the pitcher’s mound and the shrinking of the strike zone that took place in 1969 had, of course, a positive effect on hitters and an adverse effect on pitchers. Hitters who were active in 1968 would probably (all other things being equal) have performed better subsequent to 1969, irrespective of the league in which they were playing. Conversely, pitchers should have performed better prior to 1969. In order to take cognizance of changes which affect the performance of all players, the performance of an individual player will be measured relative to a league average or median.
Measurement of relative performances is affected by the use of the designated hitter (DH) in only one league. Over the first eight years subsequent to the advent of the DH in the A. L., batting averages were 21 points higher (.262 vs. .241) and ERAs 48 points higher (3.85 vs. 3.37) than in the eight years before the DH. In the N.L. during this time, batting averages went up only six points (.257 from .25 1) and ERAs went up by 15 points (3.66 vs. 3.51).
With respect to hitting, the deployment of the DH increased team averages but had no effect on the raw averages of any other player.
Yes, we have ignored the fact that pitchers’ performances may deteriorate during a game because there are no creampuffs in the lineup, thus aiding other batters in the late inning. But this effect is probably negligible and generally not measurable. Since team averages are higher, while the raw averages of the eight other players in the lineup are unchanged, relative batting averages will be lower. Unless some adjustment is made to the league averages the results of this study would be biased toward a finding of A.L. superiority (for hitters).
This bias is not present in relative pitcher performances. True, the DH increases the league ERA, but also increases individual raw ERAs as well, leaving relative ERAs unaffected.
The use of the DH in only one league implies, for pitching, higher league ERAs, higher raw individual ERAs, and stable relative ERAs. For hitting, it implies higher league batting average, unchanged raw individual batting averages and lower relative batting averages. Hence no adjustments need be made to the league averages for pitchers, but in order to obtain a consistent measurement of relative batting averages the A.L. averages for hitters have been adjusted to generate an estimate of what that average would have been had pitchers batted in the A.L. For example, for batting averages (BA) the adjustment was computed as follows:
Adjusted A.L. league average = (Actual AL BA x (1 -Pct)) + (NL pitchers BA x Pct).
The “Pct” is an estimate of at-bats by pitchers as a percentage of total at-bats. This estimate is computed by simply taking the at-bats by designated hitters, subtracting the difference between the number of at-bats by pinch-hitters in the A.L. and N.L. (with an adjustment after the 1977 A.L. expansion), and dividing the result by total A.L. league at-bats. The N.L. pitchers’ average was estimated each year by computing the average for a sample of ten pitchers.
Four performance measure – two each for pitchers and hitters – were examined. The earned-run average (ERA) and the ratio of strikeouts to walks (K/BB) serve as the pitcher’s measure of performance, while the batting average (BA) and slugging percentage (SA) serve as the benchmarks for hitters.
From the 1981 edition of the Baseball Register published by The Sporting News a list was compiled of all players who were active in 1980 and met one of the following criteria:
- At least 800 at-bats in each league;
- At least 375 innings pitched in each league;
- At least 200 pitching appearances in each league.
A total of 68 players, 31 pitchers and 37 players, met the criteria. Next the two performance measures for each player were converted into relative lifetime measures of performance for each player in each league. For batting averages, this was accomplished by computing a relative batting average for each player for each year through 1980 (player batting average/league batting average), weighting each year’s relative average by the number of at-bats the player had that year and summing these (weighted) relative averages over the number of years that the player performed in the league.
Analogous formulae were used for each of the three other performance measures. The lifetime relative adjusted performance for hitters is computed relative to the major league average which is set at .260 for batting average and at .380 for slugging percentage. For pitchers, the major league KIBB ratio was set at 1.50 and the ERA was set at 4.00. The relative performance measures adjust for the effects of strike zone changes, league expansions, designated hitting and other changes that affect the raw performance measures. If the N.L. is truly superior, then we should find that many more players perform better (after adjusting for league averages) in the A.L. (against inferior competition) than they do in the N.L.
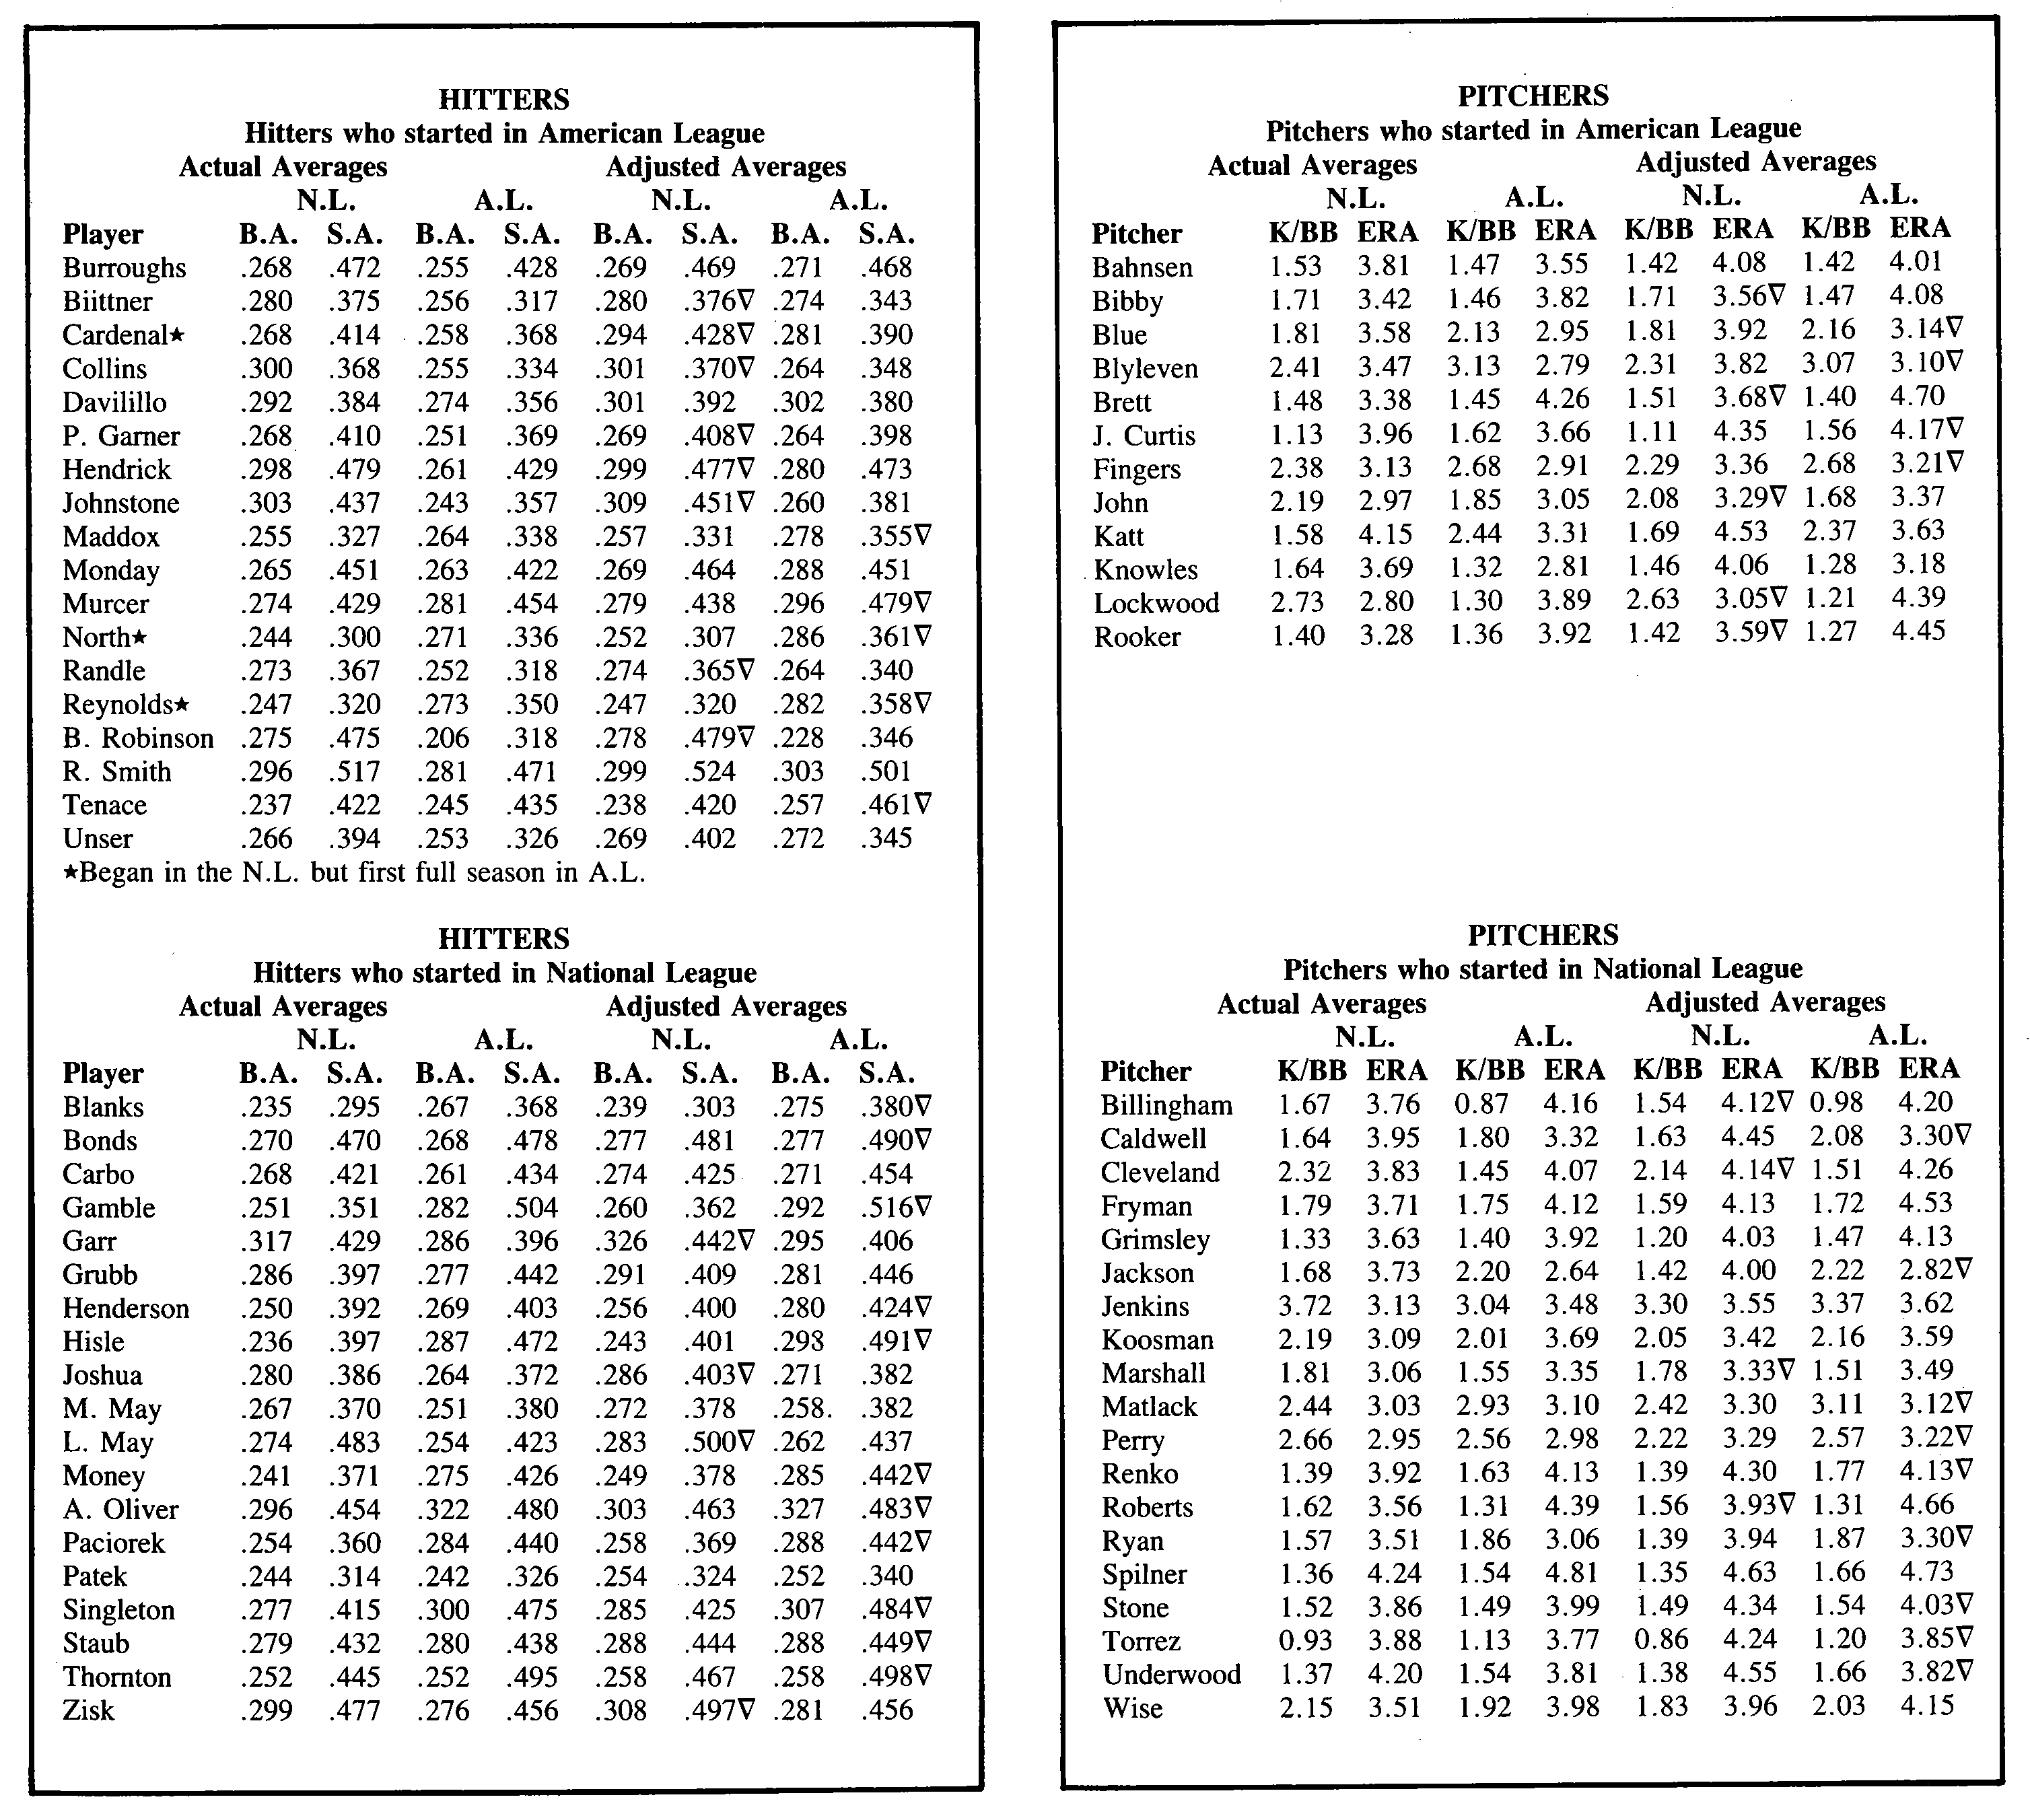
The accompanying table lists the raw (actual) and relative performance measures through 1980 for the 37 hitters and 31 pitchers who spent a good deal of time in each league. Twenty-one of the 37 hitters had better (or equal) relative batting averages and 20 had better relative slugging percentages in the A.L. For pitchers we find that 21 had better K/BB ratios and 16 had better relative ERAs while in the A.L.
When changing leagues, some players had one relative performance measure increase while the other decreased. To minimize ambiguity, let’s omit players who had performance measures changing in the opposite directions (i.e., BA improved but SA decreased in the N.L., etc.). Players who unambiguously performed better in one league vs. the other are identified in the table by a V after the slugging percentage or ERA in the league of superior performance. Twenty-eight of the 37 hitters were at least as good or better in both BA and SA for one of the two leagues. Sixteen were better in the A.L., 12 in the N.L. For pitchers, 15 turned in better performances in the A.L. while nine performed better in the N.L. Thus of the 52 players who gave unambiguously superior performances in one league as opposed to the other, 31 gave superior relative performances in the A.L. while 21 performed better in the N.L. Although these results are in the direction one expects given recent All-Star Game results, they are not significantly different from what we would expect by chance alone. Thus there appears to be no scientific evidence of N.L. superiority.
Because all players included in the sample had to “survive” in the second league for some period of time (i.e., 800 ABs ot 375 IP), the sample may be biased toward poorer performances in the league in which the players started. If the sample contains a high percentage of players who started in the A.L., better N.L. performances could be explained by this survivorship bias.
However, when the sample is broken up according to the league in which the players started, we see that 28 of the players identified by the V started in the N.L. while 24 started in the A.L. or about 55 percent of the total. Thus a survivorship bias cannot explain these results.
However, the reader will note that there is a survivor effect. For pitchers, ten performed better in the league in which they started while 14 performed better in their second league. For hitters, only nine did better in the league in which they started while 19 performed better in the second league.
Although more players performed better in the A.L. than in the N.L., the results are not significantly different from what we would expect if the two leagues have equal levels of competition. Thus the evidence is not supportive of N.L. superiority over the 10 to 15 years ending with 1980. I would speculate that the small difference observed might be due to the fact that the A.L. expanded to 14 teams in 1977 while the N.L. did not. More marginal players entered (or hung on in) the A.L., thus slightly reducing the overall quality of player performance. I am not speculating, however, when I state that NL. “superiority,” if it indeed exists, cannot explain 19 N.L. wins in 20 All-Star Games. I am not sure what the real explanation is (please do not claim “that’s baseball”), but with the superiority argument dispensed with, columnists and other researchers are free to pursue more plausible reasons for recent All-Star domination.
(Click image to enlarge)