
cWAR: Modifying Wins Above Replacement with the Cape Cod Baseball League
This article was written by Humbert Kilanowski
This article was published in Spring 2020 Baseball Research Journal
 Evaluating a player’s talent, ability, and contributions to his team is an important task of analyzing the game of baseball. In recent years, the prevalent metric for player evaluation has been Wins Above Replacement (WAR), which distills the evaluation into a single number that can be compared directly with that of other players. WAR measures a player’s contributions in units of games won as compared to the expected contribution of a readily available replacement player.
Yet this metric suffers from three shortcomings. First, many competing algorithms for computing WAR exist, and they do not agree on how players are to be ranked, demonstrating that the algorithms are imprecise and may be muddled by confounding variables. Second, the baseline for replacement level is arbitrarily chosen; rather than refer to an actual average of minor-league players who see action in the major leagues for part of the season, the baseline is selected so that the total of WAR across the major leagues is a fixed number. Third, in order not to give an unfair advantage to players who have a greater opportunity to contribute to scoring runs (based on their team, competition, or place in the batting order), WAR is designed to be context-neutral; yet this does not give any greater value to players’ performance in high-leverage or clutch situations, which are helpful in determining their value to their teams. Modifying WAR to account for this would make it more difficult to compare directly to other formulas.
To remedy the first two problems with WAR we have written an algorithm, based on the methods of FanGraphs and the openWAR project, using the data from the Cape Cod Baseball League—a high-ranked summer league for collegiate players—in which several confounding variables can be directly controlled and temporary players provide a built-in replacement level, and to address the third, we have experimented with adding a leverage term into the formula to improve the linear fit between a team’s aggregate WAR and its actual wins. Our Wins Above Replacement statistic, cWAR, can be used to evaluate and rank college players and aid the work of major league scouts, as well as be adapted to find a more effective baseline and more precise metric for the majors.
Summary of previous work
The computation of a single-valued metric to measure a baseball player’s overall contributions to his team dates back to 1984 with the “Total Player Rating” devised by John Thorn and Pete Palmer in their groundbreaking book, The Hidden Game of Baseball.1 This formula, rooted in the linear weights for each type of play, based on how many runs each play is expected to produce, has undergone many versions and modifications, such as Value Over Replacement Player (VORP) by Baseball Prospectus and Win Shares by Bill James, until the currently used statistic of Wins Above Replacement, which converts the number of runs a player contributes into units of wins, came into use around 2008.2 This statistic, WAR, is now so common that MLB.com uses it to describe players, and has even appeared on baseball cards alongside traditional metrics such as slugging percentage and earned run average.
Each of the three main sabermetric web sites (Baseball-Reference.com, FanGraphs, and Baseball Prospectus) has its own formula, and these often disagree in how players are to be ranked.3 While currently the formulas differ only in such details as how baserunning and defensive contributions are to be computed, or how much data should be used to calculate park factors, the algorithms did use different baselines for replacement level. Notably, Baseball-Reference and Fangraphs agreed on a unified replacement level in 2013, so that a hypothetical team full of replacement players would perform at a winning percentage of .294.4 This figure of .294 means that a league-average MLB team (with a record of 81-81 over a full 162-game season) would be worth 33 1/3 wins above replacement level, and consequently, the entirety of MLB would have 1000 WAR. This creates a convenient visual image of WAR as a large pie with one thousand slices to be distributed among all players, but the round figure is derived from an arbitrary estimate of how a replacement-level team would perform, which in the past two seasons has been very close to the actual worst team in the majors.5
Because of this, some analysts have sought a more reliable baseline. Some have chosen to work with Wins Above Average (WAA) instead, since league average is better defined than replacement level; yet this does not prove to be as applicable, since a team cannot call up a league-average player from the minors, nor easily trade for a league-average player. Another approach is to redefine replacement level; the authors of the openWAR Project have done so by taking the players on MLB rosters at any given time, identifying the 750 with the most in-game appearances (namely, the 390 batters with the most plate appearances and the 360 pitchers with the most batters faced), and then regarding all other players as replacement players.6,7 The average rate of run value among these replacement players then becomes the baseline, and this results in a higher total of WAR (1166.3 in 2012 and 1173.5 in 2013) for all of MLB. Yet even this does not accurately reflect replacement level. An All-Star player whose time is limited due to injury (such as Giancarlo Stanton in 2019) would count as a replacement player and skew the replacement level to be too high. Therefore, a replacement level criterion similar to that of the temporary player in the Cape Cod Baseball League may yield a more effective baseline, and this is one of the modifications that we make to the formula.
To improve further on our base model taken from the CCBL with a replacement level based on temporary players, another modification is the inclusion of a leverage term. This would give greater weight to a player’s performance in high-leverage situations. Current formulas for WAR only include leverage for relief pitchers; for FanGraphs’ formula (fWAR), only the leverage of the moment at which a pitcher enters the game is considered.8
Finally, there has been no evidence so far of any similar work done with the data of the CCBL to compute a WAR-like formula. The league’s official website, with statistics collected with PointStreak software, includes a page for “Sabermetric Stats.” The page only lists some rate statistics such as walks per plate appearance, isolated power, secondary average, and component ERA, with a listing for “runs created” without any explanation of how it is computed.9 Therefore, our project looks to be the first that calculates WAR for the Cape Cod Baseball League, using its temporary players as the baseline for replacement level.
Methodology of our research
The main data source for our research was a digital file graciously provided by the league’s official statistician of the collected boxscores from all of the regular-season games from the 2019 Cape Cod Baseball League season, formatted to be input as a data frame in RStudio. Our computer program to analyze this file was written in the language R, chosen for its ability to handle large data frames (particularly with its additional commands in a package called the “tidyverse”) and for its built-in statistical capabilities. Our algorithm for computing WAR for each player in the league involves the following steps.
First, we calculated the run expectancy matrix for the league. We found the empirical expected value of the number of runs that the team at bat would score, given the state (outs and base runners), until the end of the inning. This was done according to a method similar to the one in Analyzing Baseball Data with R (Marchi/Albert/Baumer), modified in order to work with our data set (the book’s algorithm is designed to work with Retrosheet data).10 After filtering the play-by-play data file, which includes a line for every pitch, to include only the plays during which either the state changes or a run scores, we counted the number of runs that the team at bat scores from that point until the end of the inning, and computed the average number of runs scored for each state across the whole season, excluding incomplete innings that ended before three outs were recorded. This matrix, however, contained some anomalies; for example, the state of runners on second and third with no outs had a higher run expectancy than bases loaded with no outs, since the samples were small (as few as 53 instances) and were easily skewed by a few high-scoring innings in the former case. To rectify this, we averaged 50 instances of each state from the major-league data from the 2019 season, normalized so that the basic state (bases empty and no outs) remained unchanged, meaning the MLB values were multiplied by (0.5354/0.5439). This gives the following run expectancy matrix. Notice that in the Cape League, the team at bat expects to score fewer runs with two outs than in the majors, and the run expectancies for a runner on first base only and second base only are closer together in the CCBL than in MLB. The run-scoring environment on the Cape is lower, since batters are hitting with wooden bats in competition, often for the first time.
Table 1: Run expectancy matrix for each state (outs and baserunners) for the Cape Cod Baseball League in 2019. The rightmost column (CCBL data buffered by 50 instances of the MLB data) is what we use for our run value calculations.
| Outs | Runners | CCBL (raw) | MLB | CCBL (buffered) |
| 0 | Bases empty | 0.5354 | 0.5439 | 0.5354 |
| 0 | 1st only | 0.9656 | 0.9345 | 0.9635 |
| 0 | 2nd only | 1.0790 | 1.1465 | 1.0856 |
| 0 | 3rd only | 1.4151 | 1.3685 | 1.3821 |
| 0 | 1st and 2nd | 1.5799 | 1.5371 | 1.5700 |
| 0 | 1st and 3rd | 1.9765 | 1.7591 | 1.8858 |
| 0 | 2nd and 3rd | 2.4286 | 1.9711 | 2.2363 |
| 0 | Bases loaded | 2.2813 | 2.3617 | 2.2962 |
| 1 | Bases empty | 0.2797 | 0.2983 | 0.2800 |
| 1 | 1st only | 0.5696 | 0.5641 | 0.5691 |
| 1 | 2nd only | 0.6924 | 0.7134 | 0.6933 |
| 1 | 3rd only | 1.0053 | 0.9528 | 0.9912 |
| 1 | 1st and 2nd | 1.0513 | 0.9792 | 1.0437 |
| 1 | 1st and 3rd | 1.2827 | 1.2186 | 1.2655 |
| 1 | 2nd and 3rd | 1.4694 | 1.3679 | 1.4444 |
| 1 | Bases loaded | 1.6460 | 1.6337 | 1.6392 |
| 2 | Bases empty | 0.0877 | 0.1147 | 0.0884 |
| 2 | 1st only | 0.2134 | 0.2422 | 0.2144 |
| 2 | 2nd only | 0.2780 | 0.3391 | 0.2817 |
| 2 | 3rd only | 0.3823 | 0.3907 | 0.3826 |
| 2 | 1st and 2nd | 0.4448 | 0.4666 | 0.4460 |
| 2 | 1st and 3rd | 0.4645 | 0.5182 | 0.4714 |
| 2 | 2nd and 3rd | 0.6128 | 0.6151 | 0.6115 |
| 2 | Bases loaded | 0.6667 | 0.7426 | 0.6778 |
The next step was to use the run expectancy of each state to calculate the average run value of each type of play, such as a single, walk, or out. This was done by creating a factor variable that gives a label to each play, and then using the “summarize” command in R to compute the average value of each play in units of runs. Following the algorithm from FanGraphs, we then converted these values to the linear weights to calculate weighted on-base average (wOBA) for each batter and wOBA allowed for each pitcher.11 Notably, the weights for singles, walks, and hit-by-pitch were higher in the CCBL than in almost any era of MLB.12 This suggests that batters reach base at a premium in the Cape League; the weight for a triple was nearly as high as that of a home run. The conversion factor to make wOBA on the same scale as on-base average (so that the league average for both statistics is the same) was comparable to that of MLB, namely 1.205 in the Cape League as opposed to 1.157 in the majors.13
Table 2: Linear weights for events in the Cape Cod Baseball League for the 2019 season. The leftmost column is calculated from the average change in run expectancy for each event, and the rightmost column contains the values used for calculating wOBA. Errors count as outs for the purposes of wOBA but have a run value slightly less than that of a single.
| Event | Run value | Value relative to out | Weight for wOBA |
| Out | -0.298 | 0.000 | 0.000 |
| Walk | 0.341 | 0.639 | 0.769 |
| Hit by pitch | 0.360 | 0.658 | 0.792 |
| Single | 0.492 | 0.790 | 0.951 |
| Double | 0.762 | 1.060 | 1.277 |
| Triple | 1.403 | 1.701 | 2.048 |
| Home Run | 1.445 | 1.743 | 2.099 |
A simple linear transformation applied to wOBA gives the rate statistic that measures a batter’s weighted runs created (wRC) when multiplied by his plate appearances. (For the purposes of wOBA and WAR, intentional walks and sacrifice bunts do not count as plate appearances, since they do not consist of a confrontation between the pitcher and batter.)14 The rate statistic of wRC/PA is used to compare the baseline for batters.
For pitchers, however, the algorithm is more complicated. Again, we follow the routine of FanGraphs and calculate each pitcher’s fielding-independent pitching (FIP) statistic, scaled to the league average of runs allowed.15 This was normalized by the number of games in which each pitcher appeared to produce the rate statistic of Wins Per Game Above Average (WPGAA).16 For the two cases in which a pitcher appeared only once in a game and never retired a batter, we used a scaled version of the pitchers’ wOBA against in order to avoid division by zero.
These two rate statistics, wRC/PA and WPGAA, are compared for each player to replacement level, which itself is determined with a criterion based on the temporary players in the Cape League. CCBL coaches set their rosters in the fall, several months before the next season, but roster vacancies are created for several reasons. Some of the players they choose suffer injury during the college season or play for a team that advances to the College World Series. Some also play for national teams for part of the summer, and others leave the Cape League before the season finishes—typically after the Cape League All-Star Game—to avoid the risk of injury. Coaches must add temporary players to fill out their rosters, chosen from among local colleges or lower-ranking summer collegiate leagues.
We have chosen to identify temporary players by both of the following criteria:
(a) the player only appears in games before June 30 (before players return from the College World Series) or after July 21 (the day of the CCBL All-Star Game), or appears in games over the course of fewer than seven days
(b) the player sees fewer than 40 plate appearances (for batters) or faces fewer than 40 batters (for pitchers).17
Any player who satisfies criteria in both (a) and (b) is identified as a temporary player, and the average wRC/PA and WPGAA among the temporary players is set as the baseline for replacement level. Notice that our routine departs from FanGraphs in that no separate baselines are used for starting pitchers and relief pitchers, since in the CCBL there is less of a distinction between the two than in MLB, especially early in the season. Also, pitchers do not bat in the CCBL, but any non-pitcher who pitches (typically at the end of the season) is counted as a temporary player among the pitchers. For each batter or pitcher, then, the difference between that player’s pertinent rate statistic and the baseline is multiplied by plate appearances or innings pitched, respectively, and then converted from runs to wins based on the average number of runs per plate appearance in the league. This yields the value of Wins Above Replacement for each CCBL player, which we can call cWAR.
This measure only accounts for batting and pitching, which are not all of the actions that contribute positively or negatively to a player’s team’s runs scored or allowed. In particular, baserunning and fielding are also areas in which a player can perform above or below replacement level. FanGraphs uses methods—Ultimate Baserunning (UBR) and Ultimate Zone Rating (UZR)—which require video analysis to determine when a baserunner should be credited for taking an extra base or when a fielder should be credited for making a play requiring above-average skill. Such information is not available to us from the Cape League database. What we have done is to find the average run value for non-batted ball events such as stolen bases (0.122) and caught stealing (–0.478), and added these contributions to each position player’s wRC totals, which in turn affect his WAR. Similarly, runs due to wild pitches (0.268) were incorporated into pitchers’ WAR totals. Notably, a stolen base in the CCBL has a lower value than that in MLB.18
Another modification that we made to the weights and run values was the park factors, following a method described in Marchi, Albert, and Baumer.19 We computed each team’s park factor as the ratio of the number of runs scored at home to those scored on the road, multiplied by 100. In our original model, we considered the park factors for the 2019 season only, and regressed them toward the mean by a factor of (44/162) to make the single 44-game CCBL season comparable to an MLB season.20 The average park factor was then computed for each position player and pitcher, and the player’s WAR was divided or multiplied, respectively, by the park factor, since a higher park factor favors hitters. A later modification includes a park factor computed from the past ten seasons combined to provide a more accurate value.
A final contribution to our values of WAR is a leverage factor. While we have not yet performed a complete analysis on how leverage and clutch performance affect WAR, some members of our research team have done a preliminary analysis, using the leverage values for each state and score differential as given by the “Inside The Book” website.21 The most comprehensive treatment of leverage that we have explored involves expressing each player’s contribution to runs scored as a discrete Riemann-Stieltjes integral.22 Each play’s run value (the difference in run expectancy before and after the play) is multiplied by the leverage at the start of the play, and these are summed together, so that the effective run value is the leverage integrated against the run expectancy matrix, rather than a simple RE24 which only totals the changes in run expectancy.
Table 3: Park factors for the ten ballparks in the Cape Cod Baseball League, with both the original (one-year) and modified (ten-year) values.
| Team | Home Park | Park factor
(one-year regressed) |
Park factor
(ten-year) |
| Bourne Braves | Doran Park | 102.3 | 90.1 |
| Brewster Whitecaps | Stony Brook | 111.5 | 115.2 |
| Chatham Anglers | Veterans Field | 104.9 | 98.9 |
| Cotuit Kettleers | Lowell Park | 94.4 | 100.4 |
| Falmouth Commodores | Arnie Allen Diamond | 108.6 | 104.8 |
| Harwich Mariners | Whitehouse Field | 95.3 | 85.2 |
| Hyannis Harbor Hawks | McKeon Park | 91.6 | 102.9 |
| Orleans Firebirds | Eldredge Park | 97.8 | 94.0 |
| Wareham Gatemen | Spillane Field | 104.2 | 100.3 |
| Yarmouth-Dennis Red Sox | Red Wilson Field | 101.0 | 112.2 |
With these considerations in place, we find that replacement level is 0.08387 runs created per plate appearance for batters, and 0.02846 wins per nine-inning game for pitchers. Comparing each player’s pertinent rate statistic to these baselines and multiplying by plate appearances or innings pitched, respectively, yields the desired cWAR statistic.
Testing of our research
We have tested our algorithm in two ways: first, by comparing our leaders in WAR for both position players and pitchers to the list of players who were given various awards at the end of the season; and second, by totaling the WAR for each team, and running a least-squares regression to the teams’ aggregate WAR and their actual winning percentage during the season.
Table 4: Top 10 position players by WAR in the CCBL in 2019, with their total change in run expectancy (RE24), weighted on-base average, runs created, and WAR.
| Player | RE24 | wOBA | wRC | WAR |
| Nick Gonzales, COT | 22.2 | .499 | 48.5 | 3.17 |
| Zach DeLoach, FAL | 9.9 | .453 | 33.7 | 1.97 |
| Austin Wells, Y-D | 10.5 | .422 | 36.1 | 1.92 |
| Hayden Cantrelle, FAL | 9.5 | .409 | 30.9 | 1.67 |
| Kaden Polcovich, CHA | 14.2 | .417 | 30.9 | 1.67 |
| Shay Whitcomb, ORL | 2.7 | .436 | 25.9 | 1.56 |
| Zavier Warren, BOU | 7.2 | .398 | 29.4 | 1.53 |
| Wyatt Young, Y-D | 13.0 | .412 | 27.5 | 1.37 |
| Niko Kavadas, HAR | 7.4 | .386 | 25.1 | 1.29 |
| Jared DeSantolo, HYA | 11.3 | .407 | 24.9 | 1.29 |
One position player, second baseman Nick Gonzales of New Mexico State University and the Cotuit Kettleers, has a significantly higher WAR, wOBA, and wRC than anyone else.23 This is confirmed in that he easily won the league MVP award as he led his team to the league championship, and he is the highest ranked prospect according to MLB.com among all players who played a full season in the Cape League.24 Typically, a higher wOBA leads to a higher WAR, but some players benefit from contributing more runs due to stolen bases (Hayden Cantrelle) or from being a power hitter in a more pitcher-friendly park (Niko Kavadas).
The list of position players with the highest WAR corresponded better with the end-of-season awards than the list of pitchers did.25 The pitchers also tended to have lower WAR values than the position players. This is likely because the pitchers tend to see less playing time than other position players; many pitchers are placed on innings limits by their college coaches for the summer, and teams carry many pitchers on their rosters, so that only four pitchers ended up pitching enough innings to qualify for the league’s ERA title.26 As a result, only one pitcher (Ian Bedell, who won the Outstanding Pitcher award) finished with a WAR higher than 1.
Table 5: Top 10 pitchers by WAR in the CCBL in 2019, with their total change in run expectancy (RE24), wOBA allowed, fielding-independent pitching metric, and WAR. The best pitchers have negative RE24 values since their performance causes a net decrease of runs.
| Pitcher | RE24 | wOBA | FIP | WAR |
| Ian Bedell, WAR | -15.0 | .186 | 1.58 | 1.06 |
| Sean Sullivan, COT | -9.4 | .242 | 1.98 | 0.91 |
| Ryan Cusick, BOU | -7.6 | .255 | 2.44 | 0.85 |
| Jacob Palisch, HAR | -14.5 | .214 | 2.24 | 0.81 |
| Carmen Mlodzinski, FAL | -9.3 | .201 | 2.33 | 0.75 |
| Logan Allen, HAR | -5.9 | .163 | 0.93 | 0.63 |
| Will Heflin, HAR | -10.9 | .223 | 1.98 | 0.63 |
| Brandon Pfaadt, WAR | -9.5 | .235 | 2.90 | 0.58 |
| Kolby Kubichek, CHA | -6.5 | .212 | 2.78 | 0.57 |
| Joseph Nahas, COT | -7.3 | .177 | 1.80 | 0.56 |
In addition to testing our results with a qualitative list of awards, we have also run a more quantitative test. Since each player’s contributions to his team are measured in units of wins, one could, in theory, add the WAR values for all players on a team and obtain a value comparable to the actual number of games that the team has won. Although WAR is often imprecise, this calculation can be used as a means of testing our WAR algorithm as compared to the methods used in MLB. We have run a least-squares linear regression between each team’s aggregate WAR and its winning percentage, counting each tie as half of a win and half of a loss.27
Results of our research
The plot shown in Table 6 demonstrates the linear fit between each team’s total WAR (x) and winning average (y), and the least-squares regression line is ŷ = 0.2841 + 0.0311 x, with a correlation coefficient of r = 0.8560. This is lower than the correlation coefficients for the WAR models used in the MLB for last season; FanGraphs’ algorithm gave r = 0.9438, and Baseball-Reference’s gave 0.9560 when applied to the MLB data from 2019. However, the CCBL data have a lower correlation due to the shorter season and smaller sample, and the linear fit is still statistically significant at the α = 0.001 level (t = 4.683 with 8 degrees of freedom).
Some teams (such as the Falmouth Commodores) won more games than their WAR would indicate, while others (such as the Cotuit Kettleers) won fewer, but no residual is as large as 0.071 in winning average. The team with the worst record in the league, the Hyannis Harbor Hawks, is an influential observation that drags the trend line down towards it slightly. While we have only done some preliminary work on considering leverage, an early result is that replacing RE24 with the sum of leverage multiplied by the run value for each play does decrease the residuals and make for a more accurate fit between team WAR and winning percentage.
Table 6: Plot of winning average (y) vs. total Wins Above Replacement (x) for the ten teams in the Cape Cod Baseball League in the 2019 season.
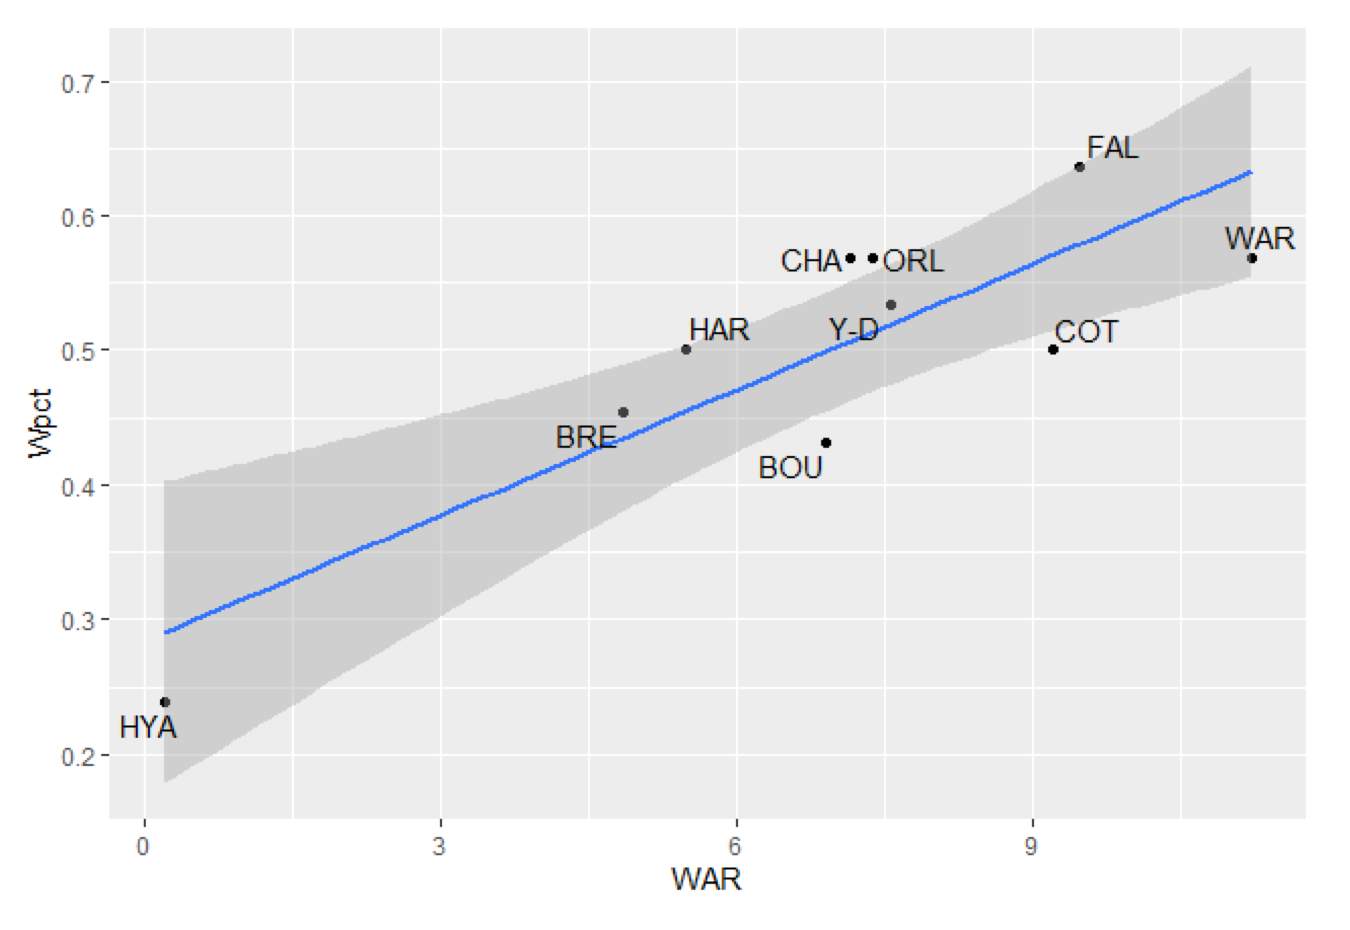
A further analysis of the regression line shows that its slope, 0.03109, is 36.8% higher than one would expect from a linear relationship in which an increase of team WAR by one would also increase a team’s win total by one. This would occur with a slope of 1/44, or 0.02273, for a 44-game season. Yet while the slope of our regression line looks alarmingly high, corresponding to 1.368 wins per WAR, its difference from 1/44 is not statistically significant at even the α = 0.1 level, as a one-sided t-test for Ha > 1/44 gives a P-value of 0.1216. Therefore, the higher slope can be attributed to the random effects of working with a small sample, and the intercept of 0.2841 is close to the baseline winning average in MLB: 0.2942.
If the influential observation (Hyannis) were to be removed, the regression line becomes y = 0.3833 + 0.01895x, with a higher intercept and lower slope, corresponding to only 0.834 win per WAR, also not a statistically significant difference from 1. Notably, the correlation coefficient of the fit drops to 0.5913, suggesting that the last-place team improves the fit. Naturally, the fit can be improved further by taking more data—keeping in mind that the Cape League decided in 2019 to reduce the schedule to 40 games in future seasons—in order to normalize the data properly.
Another observation comes from our comparison of our cWAR values with the end-of-season awards.28 While all of our top ten position players made the All-League Team, only five of the twelve pitchers from the All-League Team made our top ten. Notably, our second and third-ranked pitchers in WAR—Sean Sullivan and Ryan Cusick—did not make the team, and our list also includes some pitchers who did not pitch the full season (Logan Allen and Joseph Nahas) but still pitched well enough, with a low enough FIP, to make our top ten without qualifying for awards. Also, the winner of the league’s award for the best closer, Zachary Brzykcy, finished with a WAR of only 0.07. This is because as a closer, his innings were limited, and while he only allowed two runs all season, both scored on solo home runs, which greatly increased his FIP and diminished his WAR. This explains some of the discrepancies between our pitching WAR values and the league’s awards, but it should also be noted that for the whole league, pitchers’ WAR adds up to 12.5 while other position players’ WAR sums to 56.9.29 This suggests that WAR for pitchers ought to be scaled, or the baseline modified, to make the contributions from batting and pitching closer in magnitude.
Conclusion
The Cape Cod Baseball League is an environment in which confounding variables such as age and ability level can be directly controlled and which contains a built-in replacement level, resulting in a useful formula for Wins Above Replacement. Two important consequences for analysts and scouts in the major leagues result from this research. First, since professional scouts have become intent on recruiting players from college (rather than high school) since the sabermetric revolution as described in Moneyball, the importance of accurately ranking and evaluating college players has increased, and our project provides a way to do this.30 Second, our criteria for replacement level can be applied to the majors. By identifying conditions based on playing time and days spent on the roster, we can meaningfully determine who should be included among replacement-level players, and yield a more accurate baseline. In these ways, our analysis can contribute toward refining the methods that professional baseball analysts use in evaluating players.
Acknowledgments
I would like to thank Chris Thoms, the official statistician for the Cape Cod Baseball League, for providing us with the play-by-play data from the 2019 season; Jim Albert, for his encouragement and advice with the project; and all of my research students, especially Peter Graziano and Helen Nguyen for their work on the discrete Riemann-Stieltjes integral model for incorporating leverage, and Casey Sullivan and Thomas Zinzarella for calculating and explaining the ten-year park factors for the league.
Works Cited
Baseball-Reference.com, “WAR Comparison Chart.” https://www.baseball-reference.com/about/war_explained_comparison.shtml, accessed January 2, 2020.
Baumer, Benjamin S., Shane T. Jensen, and Gregory J. Matthews, “openWAR: An Open Source System for Evaluating Overall Player Performance in Major League Baseball.” arXiv:1312.7158v3[stat.AP], 2015.
Cape Cod Baseball League, “2019 CCBL All-League Team Announced.” http://www.capecodbaseball.org/news/league-news/index.html?article_id=2659, accessed January 6, 2020.
FanGraphs, “What is WAR?” https://library.fangraphs.com/misc/war, accessed January 6, 2020.
Lewis, Michael. Moneyball. New York: Norton, 2004.
Major League Baseball, “2020 Prospect Watch.” http://m.mlb.com/prospects/2020?list=draft, accessed January 5, 2020.
Marchi, Max, Jim Albert, and Benjamin S. Baumer. Analyzing Baseball Data with R, 2nd ed. Boca Raton, FL: CRC, 2018.
PointStreak, “CCBL 2019 — Stats.” https://pointstreak.com/baseball.stats.html?leagueid=166&seasonid=31871, accessed January 6, 2020.
Tango, Tom M., Mitchel G. Lichtman, and Andrew E. Dolphin, The Book, “Crucial Situations,” http://www.insidethebook.com/li.shtml, accessed January 6, 2020.
Thorn, John, and Pete Palmer. The Hidden Game of Baseball: A Revolutionary Approach to Baseball and Its Statistics. Chicago: University of Chicago, 1985.
Notes
1 John Thorn and Pete Palmer, The Hidden Game of Baseball: A Revolutionary Approach to Baseball and Its Statistics (Chicago: University of Chicago, 1985). The first edition was published in 1984.
2 Baseball Reference, “WAR Comparison Chart.” https://www.baseball-reference.com/about/war_explained_comparison.shtml, accessed January 2, 2020.
3 For example, to determine the players with the highest WAR in the 2017 MLB season, Baseball-Reference gives Corey Kluber (8.2) as the overall leader and Max Scherzer in the top five; while FanGraphs places Kluber fifth (7.2) and deems Chris Sale as the best pitcher, with Aaron Judge being the overall leader.
4 Dave Cameron, ”Unifying Replacement Level,” FanGraphs Blog, March 28, 2013, https://blogs.fangraphs.com/unifying-replacement-level/, accessed May 4, 2020.
5 In 2019, for example, the Detroit Tigers finished with a record of 47-114 (.292), and in 2018, the Baltimore Orioles finished 47-115 (.290); each had the worst record in MLB that year, slightly below replacement level.
6 This number is 750 before the 2020 season, when rosters expand to 26 players per team for a total of 780.
7 Benjamin S. Baumer, Shane T. Jensen, and Gregory J. Matthews, “openWAR: An Open Source System for Evaluating Overall Player Performance in Major League Baseball” (arXiv:1312.7158v3[stat.AP], 2015).
8 FanGraphs, “What is WAR?”, https://library.fangraphs.com/misc/war, accessed January 6, 2020.
9 PointStreak, “CCBL 2019 — Stats,” https://pointstreak.com/baseball.stats.html?leagueid=166&seasonid=31871, accessed January 6, 2020.
10 Max Marchi, Jim Albert, and Benjamin S. Baumer, Analyzing Baseball Data with R, 2nd edition (Boca Raton, FL: CRC, 2018), 113-116.
11 We chose the algorithm used by FanGraphs since it is the most transparent one in use by a major outlet.
12 FanGraphs. The only MLB eras with higher weights were World War II and the Deadball era.
13 FanGraphs. The factor was 1.226 for MLB in 2018 and tends to increase as the average runs per game decreases.
14 FanGraphs. The calculation is wRC = (((wOBA — league wOBA) / wOBA scale) + (league R/PA)) * PA.
15 The formula for FIP is 13 * home run rate + 3 * walk rate — 2 * strikeout rate, where hit batters count as walks and popups caught by an infielder count as strikeouts. A coefficient of 3.80 must be added, to bring the league average FIP (0.41) in line with the league average ERA (4.21).
16 FanGraphs. WPGAA is given by the pitcher’s runs allowed per nine innings (based on FIP), divided by the measure of the pitcher’s own run environment, known as Dynamic Runs Per Win.
17 The figure 40 is chosen as the typical number of batters a team sends to the plate in a game.
18 This means that a team should only attempt a stolen base when the runner has an 80% chance of succeeding, higher than the 75% in the majors.
19 Marchi, Albert, and Baumer, 263-266.
20 This is actually not a very accurate regression factor, since it does not take into account the actual correlation between the CCBL and MLB park factors. Our later modification, with the 10-year park factors, replaced it.
21 Tom M. Tango, Mitchel G. Lichtman, and Andrew E. Dolphin, The Book, “Crucial Situations,” http://www.insidethebook.com/li.shtml, accessed January 6, 2020. The Book itself does not have the table of leverage values, but the companion Web site does.
22 This is an integral from measure theory, , in which one function f is integrated against the change in another function g. If we let f represent the leverage factor and g the run expectancy, and apply the discrete version of the integral, , we have a way to incorporate leverage into the WAR formula.
23 His WAR of 3.17 translates to 10.6 WAR on a major-league scale. On this scale, the WAR for all position players totals 570 for a 162-game season. Gonzales is therefore comparable to Mookie Betts’ MLB-leading WAR in 2018.
24 Major League Baseball, “2020 Prospect Watch.” http://m.mlb.com/prospects/2020?list=draft, accessed January 5, 2020. Gonzales is ranked fourth; Spencer Torkelson, who is ranked second, played a week on the Cape, where he also played the previous summer, but spent most of last summer playing for the US national team.
25 Cape Cod Baseball League, “2019 CCBL All-League Team Announced,” http://www.capecodbaseball.org/news/league-news/index.html?article_id=2659, accessed January 6, 2020.
26 PointStreak. The minimum is 0.8 innings pitched per team game, or 35 1/3 innings for the season.
27 In the Cape League, a game is called off and counted as a tie if it remains tied after the tenth inning. Games may also end as ties due to weather, or darkness at one of the three fields (Cotuit, Brewster, or Yarmouth-Dennis) that does not have lights.
28 Cape Cod Baseball League, “2019 CCBL All-League Team Announced.”
29 This is a ratio of 4.552 for batters to pitchers, as opposed to 1.326 for FanGraphs and Baseball-Reference’s formulas for MLB.
30 Michael Lewis, Moneyball (New York: Norton, 2004), 16: “In any case, you only had to study the history of the draft to see that high school pitchers were twice less likely than college pitchers, and four times less likely than college position players, to make it to the big leagues. Taking a high school pitcher in the first round—and spending 1.2 million bucks to sign him—was exactly the sort of thing that happened when you let scouts have their way. It defied the odds; it defied reason. Reason, even science, was what Billy Beane was intent on bringing to baseball.”