

Deconstructing the Midas Touch: Gold Glove Award Voting, 1965-2004
This article was written by David Paculdo - Steven M. Day - Robert J. Reynolds
This article was published in 2005 Baseball Research Journal
Gold Glove Awards, first presented in 1957, are given annually to the best defensive players at each position in each league. Guidelines for Gold Glove Award voting now state that coaches and managers may vote for players in their league, but not for players on their own team. The guidelines do not suggest what characteristics the coaches and managers should consider in making their selections.
Using the non-strike player-seasons since 1965, we used regression models to predict award recipients by position based on plausible predictive variables, including fielding, offense, and reputation. The best-fitting models showed that defensive skills and having previously won a Gold Glove are strong predictors of winning another one in a current season. Measures of offensive skills and All-Star or post-season appearances are significant for some positions, in keeping with some better-known baseball stereotypes, such as the offensive role of third basemen. Number of wins and strikeouts also affect the chances of winning a Gold Glove as a pitcher.
The models achieve a satisfactory level of predictive ability, and we feel they improve upon previous work in this area, especially with the addition of models for pitchers and outfielders.
Introduction
The Gold Glove Award was conceived in 1957 when the Rawlings Corporation, the well-known manufacturer of baseballs and baseball equipment, presented awards for excellence in fielding to nine Major League Baseball players. Awards were given to players at each field position. Though separate at the beginning, the three awards for outfielders did not differentiate between field after 1960. Thus, in theory three left fielders could win the award in the same year.
Since 1958, the Rawlings Corporation has awarded Gold Gloves annually to 18 players, nine each from the American and National Leagues. In 1985 Rawlings gave an extra Gold Glove in the American League when a tie in the voting resulted with Dwight Evans of the Boston Red Sox and Gary Pettis of the California Angels both winning a Gold Glove for outfield.
In 1957, a committee of sportswriters chose the recipients. From 1958 until 1964 the active players in the leagues voted for the winners. Since 1965, Gold Glove Awards have been deter mined by the votes of managers and coaches of all the teams in each of the major leagues. Voting rules state that managers and coaches may only vote for players in their own league, and may not vote for players on their own team. The rules, however, offer no guidance as to what criteria should be used in deciding for whom to vote. Thus voters are free to use whatever criteria they feel are relevant.
What criteria make a player more or less likely to win a Gold Glove? Conventional baseball wisdom has a glib answer: whoever won last year. While there is undoubtedly some truth to this, it falls far short of telling the whole story. There must be a basis upon which the managers decide for whom to vote other than repeat winners – if not, when a current batch of winners retires, no new ones could be selected. In this paper we sought to determine those accomplishments and attributes that have consistently distinguished Gold Glove winners from the rest of the players in Major League Baseball.
We are aware of only one previous analysis that attempted to identify the characteristics of Gold Glove winners.1 In his 2005 study, Arthur Zillante tested the specific hypothesis that so-called “reputation effects” influence Gold Glove voting. Zillante’s reputation variables include post-season appearances, All-Star appearances, and previous Gold Gloves won. While Zillante’s work is thorough and often sensible, the current work represents an improvement in several important respects:
- Zillante reported separate models for each infield position, but did not provide models for pitchers or outfielders. Here we present separate models for each infield position, including pitchers, and a model for outfielders collectively.
- Zillante based his analyses on player-seasons from 1957 through 1999. The current work uses records from 1965 through 2004. This range is better suited to testing the Gold Glove voting patterns, as this is the entire period in which the award has been chosen by only managers and coaches. Before 1965, the award was chosen first by sportswriters and later by players, each of whom might have had very different standards for voting.
- We exclude strike seasons that interrupted playing time. These irregular seasons could possibly skew the results by providing incomplete player-seasons, which may have been judged differently from other years.
- We consider a wider range of predictor variables than did Zillante. We do not assume that the only variables that might be significantly associated with winning a Gold Glove are those that reflect the conscious decision-making of the voters. Due to his specific hypothesis of reputation influencing voting, Zillante constrained himself to such assumptions. Here we recognize that while some variables may be explicitly considered by voters, others may be highly correlated with the intangibles of excellent defense. Thus we have the ability to identify a variable that may have a strong impact on a player’s chance of winning a Gold Glove, even though coaches and managers maid not explicitly consider it in their decision processes.
Thus in this paper we use logistic regression analysis and a healthy dose of common sense to find variables that best predict Gold Glove winners in non-strike seasons since 1965.
METHODS
Player Performance Data
The data for this research were taken from the 2005 version of the Lahman Database. This source contains information on Major League Baseball from 1871 to 2004. More information on the database may be found on the Baseball Archive web site.
Specifically, the data used in this study are drawn from the fielding, hitting, pitching, master, and award tables of the data base. The raw data consist of one record for each player, in each position played, for each team, in each year in each of the major leagues. For example, Henry Aaron played both third base and outfield for the Milwaukee Braves in 1959; as such he has two fielding records for that year, one for each position. In the analysis, these records would act as two separate players, each with his own fielding records and Gold Glove outcome. Had he played third base for two different teams (in the same league) in the same year, however, those records would have been combined to create a single fielding record by adding the counting statistics. Thus “player-position-seasons” is the unit of analysis in our models; we will refer to them as “player-seasons” from here forward.
Table 1 shows the distribution of player-seasons by position and in five-year intervals. The table also lists the minimum number of games played for any one player-season to be included in the analysis. The minimum-game threshold was chosen by selecting all player-seasons that had as many or more games played than the mininum number of games played among all the Gold Glove winners (for all years) at that position. A minimum number of games was chosen instead of a minimum number of innings because the information on innings played at each position other than pitcher is unavailable for records prior to 2000.
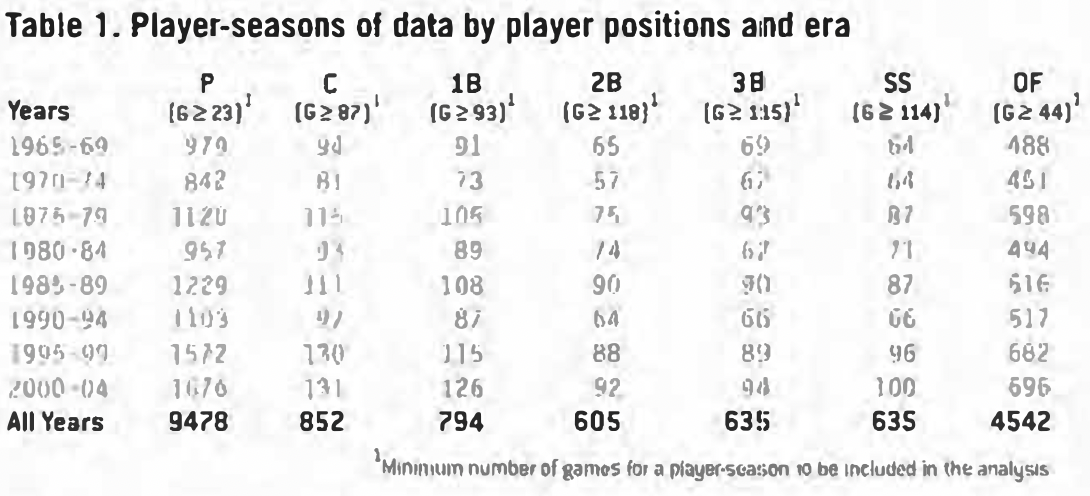
(Click image to enlarge)
For every position except first base and outfield there are 74 total Gold Gloves used in the analyses. This corresponds to 10 awards in each five-year interval, except in the eras 1970-74, 1980-84, and 1990-94. In each of these eras a single strike year was dropped from the analysis, resulting in eight Gold Gloves in each of those eras.
The outfield model contains a total of 223 Gold Glove Awards, as the outfield records were analyzed as a group rather than by position. The outfield records were grouped because the records for some players in the 1960s list them only as having played outfield (instead of left, center, or right fields), and because each voter casts three votes for outfielders without identifying left, right, or center field.
The first base model included only 73 Gold Gloves instead of 74, because Rafael Palmeiro’s 1999 Gold Glove was dropped from the analysis. Palmeiro’s award in that season is widely regarded as a reward for his offensive accomplishments; we dropped it here because his low number of games played at first base (28) made his award a severe outlier.
Hitting information used in the analyses were the counting statistics of offense, including the numbers of all types of hits, at-bats, sacrifices, hit by pitch, and RBI. Batting average, slugging percentage, and on-base percentage were all excluded from the analyses due to the statistical error associated with small numbers of at-bats for some players.
Fielding information consisted of the standard statistics of fielding: number of games at each position, assists, putouts, errors, double plays, fielding percentage, and passed balls. In each of the models presented here, fielding percentage is expressed as a percent between 0 and 100 rather than as a decimal number between 0 and 1.
Pitching data included all counting statistics for pitchers, including ERA and opponents’ batting average, though the latter two were not used for the same reasons that batting average and other offensive-rate statistics were not used. Offensive-rate measures (batting average, slugging, etc.) were excluded for pitchers (as for other positions). We decided to exclude these rate variables because they depended on the number of innings pitched and batters faced, information that was not always available; this led to uncertainty about the reliability of these variables due to the size of statistical error in the measurements of their effects.
All records had indicators of league, season (as calendar year), whether the player was an All-Star in that year, whether the player made the post-season in that year, and age in each season (as of July 1). We also calculated a number of variables, including career totals and average-per-game rates for each counting statistic. Variables were also created to indicate cumulative All-Star appearances. cumulative post-season appearances, and cumulative Gold Gloves won.
Gold Glove Distribution
Table 2 shows the distribution of all Gold Glove Awards in 1957- 2004. There were only 251 original winners of the slightly more than 850 awards given in that interval. About half the winners have won one or two awards each. Among the half who have won three or more awards, most have won between three and five, though there are 48 players (18%) who have won six or more Gold Gloves. This is no doubt the source of many sportswriters’ suggestions that the winner in any given year is whoever won the year before. In the absence of any other information, this is not a bad bet, and should be born in mind as the results from position specific models are presented.

(Click image to enlarge)
Statistical Analyses
We fit logistic regression models to the data, with the Gold Glove indicator as the outcome variable (yes/no). The logistic regression model fits the log (natural logarithm) odds of success for a binary variable (in this case win of a Gold Glove, yes or no) to a linear function of explanatory variables. The resultant parameter estimates can be used to calculate the probability of an event occurring based on the values of the explanatory variables for a given observation. Logistic regression is a robust method and is used widely in the health sciences. Further details on the methodology are available in standard statistics texts such as that of Hosmer & Lemeshow.
Stepwise selection of variables was used to determine which among the possible explanatory variables were most significant in predicting a Gold Glove win. Variables that were significant at the 5% level in the stepwise routine were initially retained. Linearity in the continuous variables was then tested using indicator variables and higher-order terms, and competing models were compared by way of the log likelihood tests and/or the Akaike Information Criterion.
We tested for significance of interaction terms, starting with each of the main effects crossed with each other. Significance in interaction variables represents an effect that is different for different values of main effects. For example, an interaction between putouts and league would indicate that the effect of number of putouts on a player’s chances of winning a Gold Glove is different in the American and National Leagues.
All data were extracted from the Lahman database and analyzed using the SAS system for Windows.
RESULTS
Pitcher Model
Table 3 displays the model for predicting pitching Gold Gloves based on all player-seasons with at least 24 games. The model shows that for pitchers, a combination of defensive opportunities, reputation, and pitching prowess is highly predictive of winning a Gold Glove.
In the pitchers’ model, defensive opportunities are represented by total chances per game. The value of this variable is calculated by dividing the total number of defensive chances in a season by the total appearances in that position in the season. In spite of the wide confidence interval associated with the odds ratio, this variable nonetheless has a strong and clear effect: accruing more putouts, assists, and even errors is a positive factor.
A previous win of a Gold Glove had a tremendous impact on a pitcher’s chance of winning an award. As we shall see, this was true at every position, but the pitching Gold Glove winners’ club is particularly hard to break into. Pitchers who have won previously are over 100 times more likely to win again as a pitcher who has not yet won. This is further reflected in the fact that once a player wins at least once, he is 1.36 times as likely to win another for each award he has won.
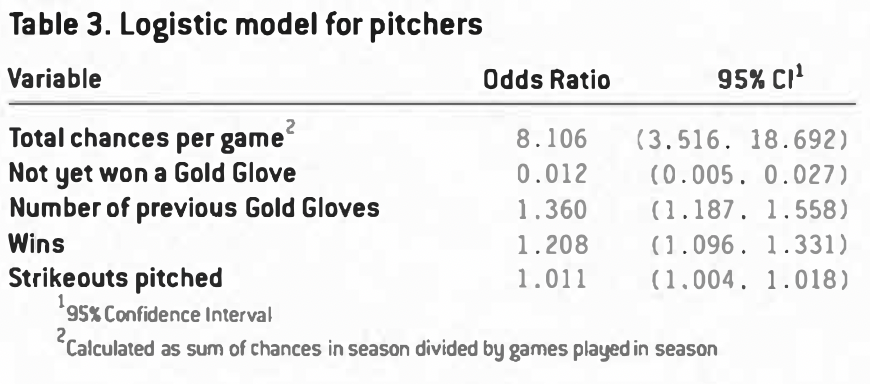
Wins and strikeouts are, perhaps not surprisingly, significant predictors of award winning. For each win credited to him, a pitcher is 1.208 times as likely to win a Gold Glove, and for each strikeout posted he is 1.011 times as likely to win a Gold Glove. Thus a pitcher who has 100 strikeouts in a season is 1.73 times as likely to win a Gold Glove as a pitcher who has only 50 strikeouts (1.011^5o = 1.73).
Catcher Model
The model for catchers relies on a broad mixture of variables: fielding measures, age, reputation, and offense. For catchers, at least 87 appearances in the season were required to be included in the analysis. The full model is displayed in Table 4.
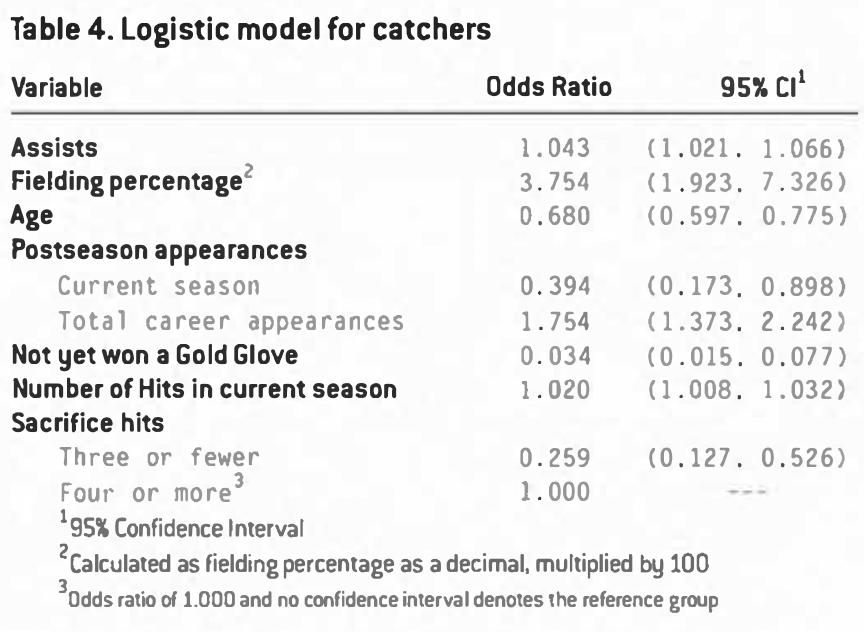
The offensive statistics included here are worth noting. While accumulating a higher number of hits improves the chances of winning an award, sacrifice hits have a threshold of three. A player who accrues three or fewer sacrifice hits suffers a severe penalty to his chances of winning a Gold Glove as compared to those who accrue four or more.
The reputation effects in this model relate to post-season appearances and whether or not the player has won a Gold Glove before. Notably, being in the post-season is a highly negative factor for winning a Gold Glove, but having been in many post-seasons is a positive factor. As expected, never having won a Gold Glove previously is a large negative factor.
First Base Model
The model for first base (Table 5) is based on player-seasons with at least 93 games, and contains fielding measures, age, and reputation. In particular, the chief skill of a first baseman, putouts, is highly significant, and a high number of putouts can substantially increase his chances of winning the Gold Glove. Fielding percentage matters as well, with each unit increase conferring an almost six-fold increase in the chances of winning. In this model, fielding percentage was expressed as a whole number, that is, the decimal fielding percentage multiplied by 100. To reduce the standard error on the parameter estimate (and thus the confidence interval of the odds ratio), these percents were rounded to the nearest whole number.
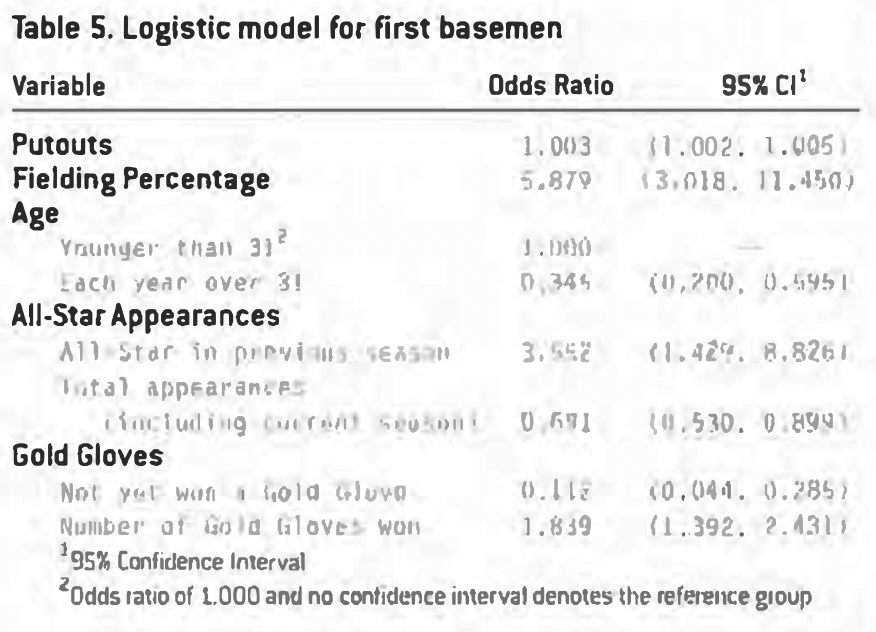
Reputation effects in this model include All-Star appearance in previous season. the total number of career All-Star appearances, whether or not the player has won a Gold Glove, and the total number of Gold Gloves won. As expected, never having won a Gold Glove is a highly negative factor, and winning multiple awards bestows an ever-increasing bonus. A surprising result came from the All-Star appearance variables; while going to the All-Star game is a large positive factor, each individual appearance is a negative factor. This finding is likely one of correlation rather than causation, as we can imagine no explanation why coaches or managers would (or should) discriminate against players who were All-Stars in the previous years.
A final important factor for first basemen is age. Once a player passes age 31, his chances of winning a Gold Glove decline precipitously. It is certainly possible to win a Gold Glove at age 31 and older, however, and it has happened a total of 20 times (27%).
Second Base Model
The model for second base is presented in Table 6. The model is based on all player-seasons with at least 118 appearances at the position.
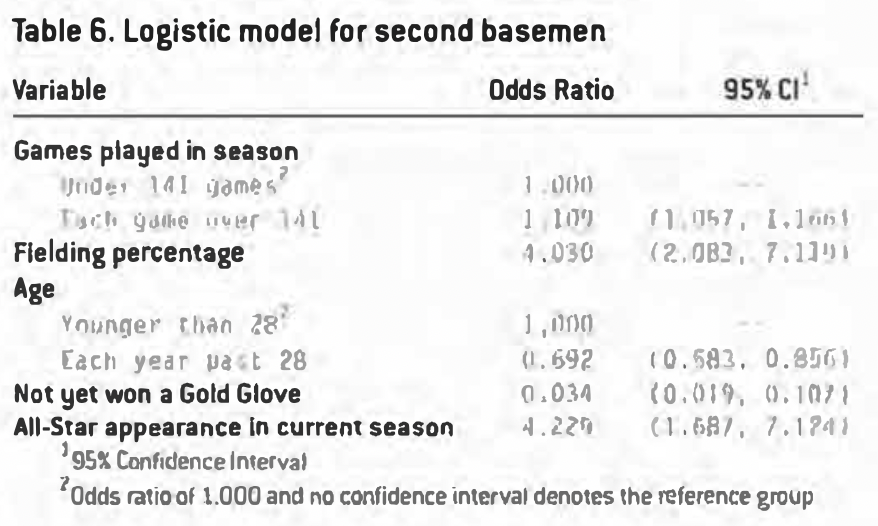
For second base, the number of games played is important. The chances of winning a Gold Glove are flat for those players who play only 141 games at second base. Thereafter, the chances rise by approximately 11% per game (odds ratio 1.109). This dramatic increase suggests that only full-time second basemen who log a substantial amount of playing time are serious contenders for a Gold Glove.
Fielding percentage is a strong predictor for this middle infield position. As one would expect (and has been seen in other models), the higher the fielding percentage, the higher the chances of winning a Gold Glove.
Age is again an important variable. The chances of a second baseman winning an award decline by more than 30% per year after age 28.
A player who has never won a Gold Glove is 0.034 times as likely to win as a player who has won previously. Being an All-Star makes a second baseman over four times as likely to win.
Third Base Model
The model for third basemen was fit to all player-seasons that had at least 115 games associated with them.
Among the fielding measures important for third base is assists. In the model, the chances of winning a Gold Glove are uniform until a player accrues at least 230 assists. After this number, the chances of winning a Gold Glove increase by 1.6% per assist. This is an enormous adjustment in light of the fact that a few full time third basemen have tallied 400 or more assists in a season. Thus, for example, compared to a third baseman with 200 assists, a player with 400 assists is 23.92 times more likely to win a Gold Glove.
As in the other positions so far, fielding percentage is a significant factor.. The chances of winning a Gold Glove almost double with each percent increase in fielding percentage.
For third base, a marker of long-term career consistency in fielding was also significant: the average putouts per game over the entire career of the player (up to and including the season in question). The chances of winning an award were flat for any career average under 8.4 putouts per game, and increase by almost four-fold for each unit change in this average after that.
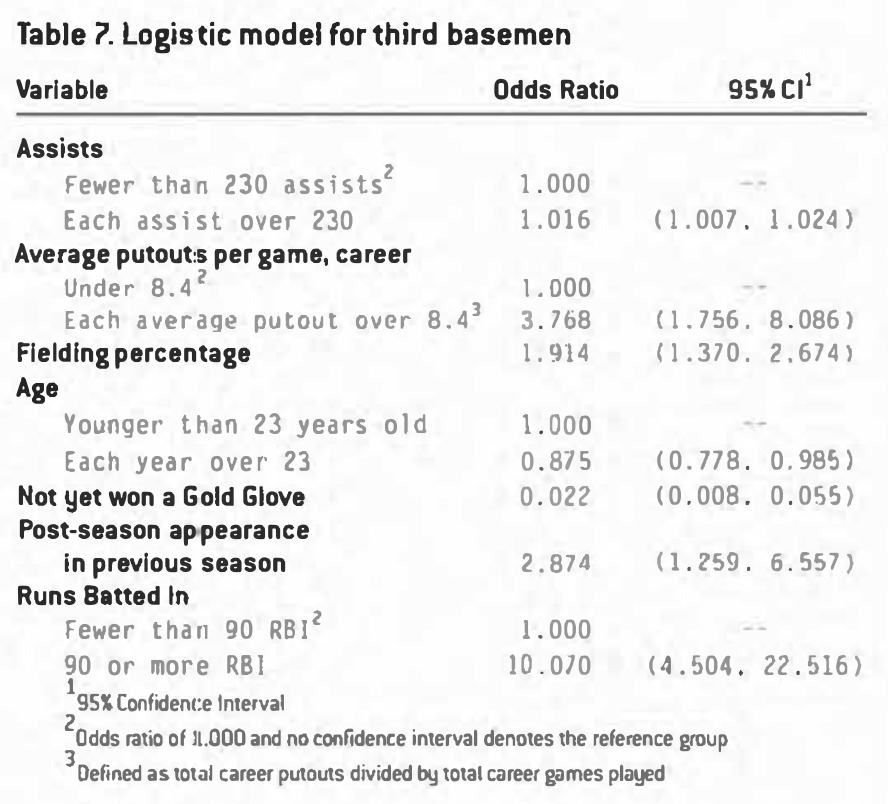
The third base model is influenced by reputation in much the same way as the other infield positions. Never having won a Gold Glove is a significant negative factor, making a player only 2.2% as likely to win the award.
An interesting finding in this model is that the number of Runs Batted In (RBI) significantly influences the chances of winning for players who have at least 90 of them. Though any causal explanations offered for this association would be purely speculative, RBI is a favorite offensive statistic of so-called “baseball men.” Thus it seems probable that this is something explicitly considered by coaches and managers in the voting process.
Shortstop Model
The model for shortstop is based upon player-seasons with games totaling 114 or more. The model uses fielding measures, age, and reputation, and is displayed in Table 8.
The total defensive chances are significantly related to the odds of winning a Gold Glove for shortstops. For each defensive chance, the player is 1.010 times more likely to win a Gold Glove. In addition to this, each unit of fielding percentage makes the player almost four times as likely to win an award. These two together will greatly reward the player who reaches and successfully fields a large number of balls.
The chances of winning an award at shortstop increase linearly with age up to 28 years, after which the risk is flat. The chances increase at almost 9% per year until age 27. This model of age suggests improvement in the odds through the 20s, with a peak in the chances of winning at age 27. After age 27, the flat risk suggests that the chances of winning an award are governed by factors other than age. This effect is likely due to increasing reputation as an excellent fielder up to age 28, after which voters perceive an equalization of talent between Gold Glove candidates. Were this effect due to increasing skill, the risk should plateau at age 28, and then decline in lockstep with declining physical ability; instead, the chances remain constant indefinitely.
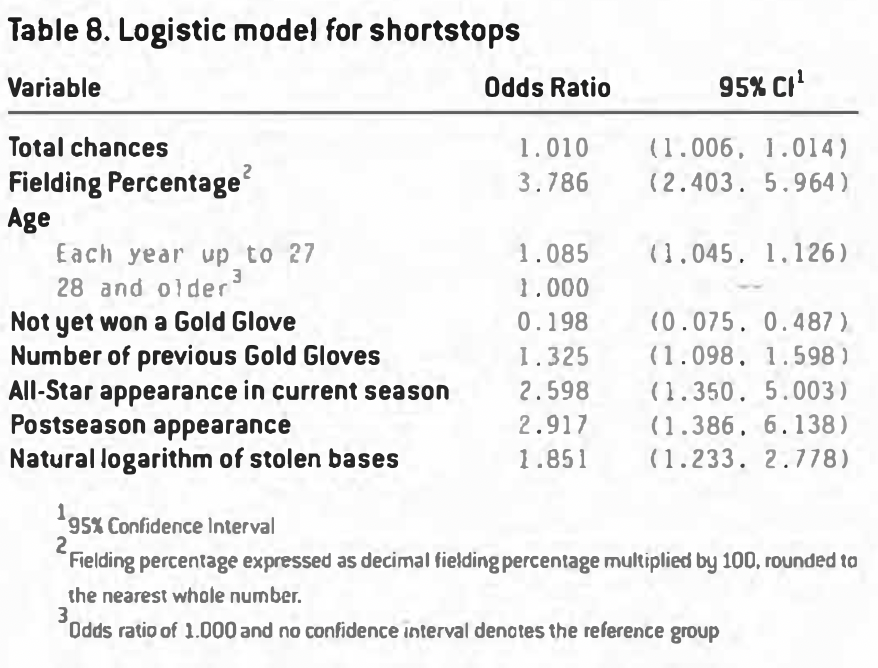
Reputation figures significantly into the chances of winning for shortstop (as it does for every position). Not yet having won a Gold Glove is detrimental to the chances of winning the first one. Having won before increases the chance of winning in a current season by 32.5% per award won. Being an All-Star increases the chances by roughly 260%, and making a post-season appearance makes a player almost 300% as likely to win an award.
Finally, one offensive measure significantly predicts Gold Glove winners at shortstop, that of the stolen base. In this model, an increase in one unit of the natural logarithm of the number of stolen bases in a season makes a player 1.851 times as likely to win an award. In essence this means that while a high number of stolen bases is good, it is subject to quickly diminishing returns, as it takes an exponential amount of stolen bases to continually raise the value of the natural logarithm. For example, it takes 3 stolen bases to get a score of 1.1, 7 stolen bases to score 2, and 20 stolen bases for a score of 3.
Outfield Model
Table 9 displays the logistic model for outfielders. This model is based on roughly four times the number of player-seasons as the other models. The difference mostly stems from the fact that the three outfield positions were aggregated into one model, but may also be due to the fact that many teams keep a larger staff of outfielders for platooning. The model includes only those player-seasons that had a game count of 44 or more.
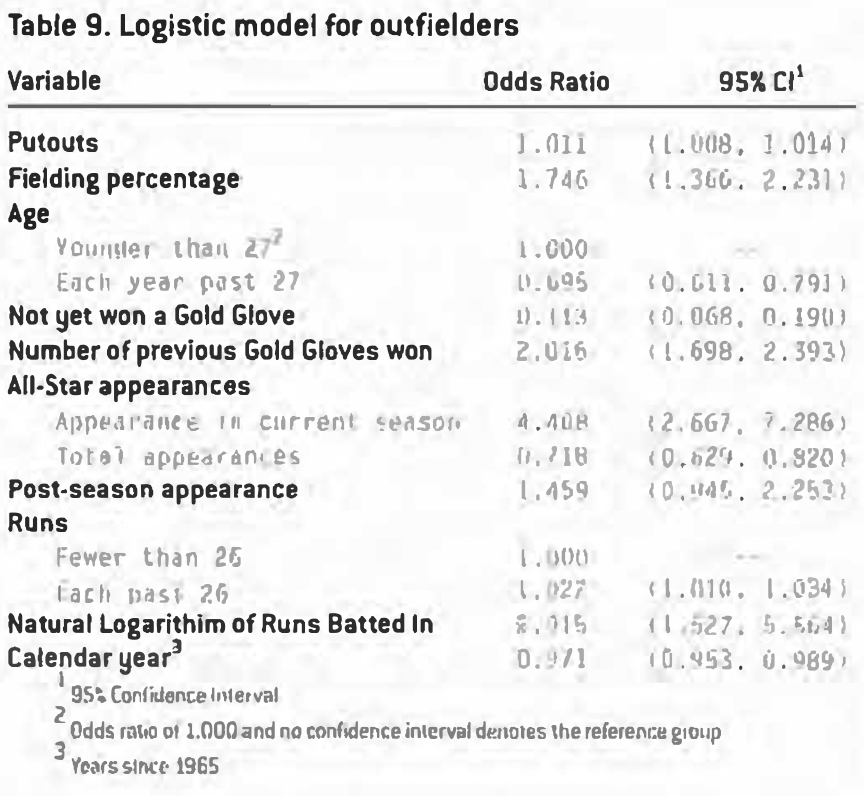
The fielding components to the model are putouts and fielding percentage, both of which are positive factors for winning an award. For each putout, the player is 1.011 times more likely to win a Gold Glove, while he is 1.746 times more likely to win for each unit increase in fielding percentage.
Age is important for outfielders as well. The chances are flat until age 27, after which they decline with age by approximately 30% per year.
The history of Gold Glove winnings is important; much like the other player positions, having won before is very helpful, with each additional award conveying more than twice the likelihood of winning again.
Total All-Star appearances and an All-Star appearance in the current season are both significant in the model. However, while an appearance in the current season is helpful, more appearances harm the chances of winning. To better understand this relationship, consider the following example: a player who appeared in the All-Star game twice before and also appears in the current season has an overall 1.53 times the chance of someone who has never gone to the All-Star game ([0.718]^3*[4.408]). A player who has appeared three times overall but does not make the All-Star game in the current season has 0.370 times the chance of winning a Gold Glove ([0.781]^3).
It seems then that going to the All Star game is a largely important factor for the first few appearances, but then the effect fades. When a repeat All-Star finally fails to make the All-Star game, it hurts his chances greatly.
Making a postseason appearance is also helpful; those who do it are almost 1.5 times as likely to win a Gold Glove.
Two offensive measures are significant in the model, and both help a player’s chances of winning an award. For each run over the 26th, players’ chances increase by 1.022 times. Each increase in the natural logarithm of RBI gives 2.915 times the chances of winning.
Finally, calendar year (expressed as number of years since 1965) is significant. Significance in this variable means that, on average, it is getting harder for all players to win a Gold Glove award each year that goes by. The chances of winning shrink at an average rate of 2.9% per year. In 2004, this reduction equates to (0.971)^40 = 0.308. This means that players today are only 0.308 times as likely to win a Gold Glove as players were in 1965.
This is a logical finding, but ultimately not an important one. As awards are given every year, it does not matter how likely one is to win in comparison to players of years past; everyone who is eligible for a Gold Glove has the same chance, all other factors being equal. The term for calendar year would only then be important if we wanted to compare the performances of two players from two different years. The year term would allow us to standardize the chances of winning an award for historical players who had the benefit of playing in smaller leagues. We include the variable here because it makes an overall significant contribution to the model, and thus should not be ignored.
Prediction
Having constructed models for each position, we then tested the models by using the calculated probabilities from the models to rank the likelihood of winning a Gold Glove at each position, by league and by year.
To do this, we ranked the players in each league and each year based on their probabilities of winning according to the appropriate model. We then examined the percentage of Gold Glove winners who received a #1 ranking from the model. The results are listed in Table 10.
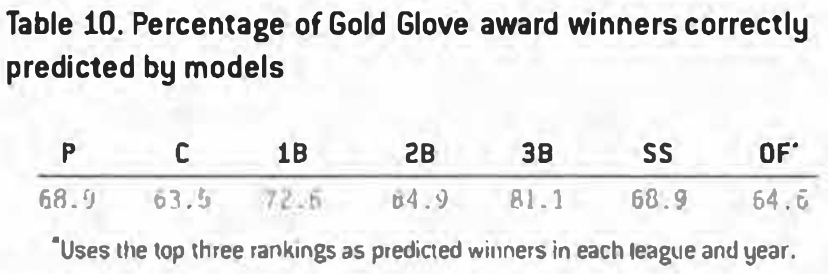
Table 10 shows that most of the models correctly predicted the winner 60-70% of the time. The notable exception is the third base model, which achieved a correct prediction rate of 81%. The outfield model is considered to have correctly predicted the winner when the winner was ranked number one, two, or three, since three awards are given every year.
Discussion
As mentioned in the Introduction, the models reported here do not necessarily reflect the thought processes of the coaches and managers when voting for Gold Glove winners. Instead, the models reported in this paper may be thought of as the characteristics that historically have been most strongly associated with the winners of Gold Gloves at the various positions.
These characteristics may be what sway coaches and managers when voting (consciously or subconsciously), or they may be characteristics that are highly correlated with the true attributes coaches rely on which are not accounted for directly here. Only a survey of the coaches and managers would be able to discern on what explicit criteria they cast their ballots.
Several general trends are common to all the models. The first and most important is the role of having previously won a Gold Glove. In every model presented, the indicator variable of not yet having won a Gold Glove is significant. Invariably it has a large effect, ranging from an odds ratio of 0.012 for pitchers to an odds ratio of 0.192 for shortstops (thus players who have won a Gold Glove before are from 5.21 to 83.33 times as likely to win one in the current season as a player who has not yet won).
In models in which the total number of Gold Gloves won before is significant, its effects are large, acting as the expected complement to never having won a Gold Glove before. The odds ratios given in the models range between 1.360 and 2.016 for each additional Gold Glove won. Overall, the effect is dramatic. Those who have not won before are not likely to start winning, but those who have won are likely to keep winning. Indeed this may say as much about the inherent talent of the players as it says about the effect of reputation.
As would be suspected, fielding percentage is present in nearly all models, and in each case is associated with greater chances of winning a Gold Glove. The association of high percentage of successful fielding with winning a fielding award would be the first and most basic hypothesis possible; as such the presence of this variable in most of the models lends face validity to the models presented here.
Raw fielding totals also figure prominently in some models. Since we are not using more complex fielding metrics here, the raw fielding statistics may indirectly capture exceptional fielding by showing not only the proportion of error-free plays, but the larger number of such plays made. In other words, the best fielders not only get their glove on the ball more often than other men in the leagues, they turn those opportunities into successful outs more often too.
Age was a significant predictor in all but pitching models. Whether or not voters use this criterion when casting ballots is again debatable, but the usual sharp decline in the chances of winning past each position-specific age threshold seems to suggest that if this is not the case, age is at the very least linked to something important related to fielding, such as an age range that is the best balance of skill and athletic ability for performing at position. If the skill versus athletic ability explanation is true, age should be accounted for more carefully when evaluating or projecting the careers of position players, as large changes in ability may come suddenly with age.
Conspicuous by its absence is a lack of differences in variables between leagues for any of the awards. This is not entirely unexpected, however; in spite of league differences, players, coaches, and managers are constantly moving between leagues, keeping the culture of the major leagues uniform. With the advent of interleague play in the 1990s, the cultural similarity between the leagues could have only increased. Most important, what makes a great player in one league shouldn’t be different from what makes a great player in the other (with the possible exception of pitchers who might also be great hitters, or designated hitters).
The article by Arthur Zillante fitted similar models to data from a different time period, and for fewer positions. Overall, the best of Zillante’s models correctly predict winning a Gold Glove 50-65% of the time, varying by position. These models are based on offensive, defensive, and reputation effects, with the best results naturally coming from the models that keep only statistically significant predictors.
There may be two reasons that Zillante’s models are less accurate than the models presented here. Zillante’s models are in all cases much simpler than the current set; he has fewer variables, and often has raw counting statistics for fielding instead of rate statistics. Noticeably absent from his models are age terms, which here contribute substantially to most models.
Where there are similarities between the present study and Zillante’s, the similarities are sometimes striking. The third base model in the current study has the same variables as the Zillante model, with the only differences between the models being different parameterizations of some variables, plus some additional variables in our model. Other models share common variables and similar odds ratio estimates.
The utility of the models presented here may be severely limited in time. The models have acceptable predictive value for the data used in this study, which span 1965 to 2004. This is not to say, however, that things will not change over time – slowly or rapidly. In an age in which long-standing records are being broken and the integrity of the players is under close scrutiny, it is tempting to think that the standards may change or that anything is possible. However, if history is our guide, the culture of baseball is slow to change, and the skills and other attributes common among winners of the Gold Glove Award will likely not change in the foreseeable future.
ROBERT REYNOLDS is a Senior Consultant Data Analyst with Kaiser Permanente in Oakland, CA. He holds a Master of Public Health in Epidemiology and a Bachelor of Science in Psychology, both from the University of Arizona. On most nights between the months of April and October, he can be found in section 319 of SBC Park.
STEVEN DAY earned a Ph.D.in Statistics from the University of California, Riverside and two Master’s degrees in Mathematics from the University of California, Davis. Mr. Day lives in Southern California and supports all Los Angeles baseball teams.
DAVID PACULDO is a Senior Researcher/Analyst affiliated with the Life Expectancy Project in San Francisco, CA. He is a graduate of the University of California, Irvine and holds a Master of Public Health from Dartmouth College. In addition to performing biostatistical research, he is a die-hard Chicago Cubs fan.
Notes
1. Zillante, A. (2005). “Reputation Efforts in Gold Glove Award Voting.” Paper presented at the Public Choice Society 2005 Annual Meeting.