

Did Batters of Long Ago Learn During a Game?
This article was written by Jay Wigley
This article was published in Spring 2021 Baseball Research Journal
Modern baseball analysis has established without a doubt that the longer a pitcher stays in the game, the better the batters will perform against him. Beginning in 1996, analysts evaluated the starting lineup’s plate appearances and later coined an acronym for the rule: TTOP, for the “Times Through (the) Order Penalty.” That is, “As the game goes on, the hitter has a progressively greater advantage over the starting pitcher.”1 Has this TTOP always been there? This article examines whether Deadball Era batters improved their performance against the starting pitcher in the same way as their modern counterparts. Using Retrosheet data for the seasons 1916–2019, we will see that while Deadball batters also learned their opposing pitcher during a game, the pattern of their learning was different.
The differences between the Deadball Era game and that of today are many, but two of them stand out when it comes to batters and pitchers.
First, Deadball Era baseballs were kept in play as long as reasonably possible, primarily to minimize team expenses. Whereas modern batters see a new ball at least at the beginning of every inning (and often several new ones are put in play during a single plate appearance), Deadball Era batters were trying to make quality contact with a ball that had been darkened by dirt and by the pitcher using a variety of foreign substances.
Second, Deadball Era batters aimed their hits between fielders, producing line drives into the outfield, not driving the ball out of the park, which was a futile approach in most ballparks of the time. Babe Ruth’s powerful uppercut swing, which helped transform the game in the 1920s, was a lesson not yet learned by hitters in the Deadball years.
Considering these two substantial differences in how the game was played, we might expect there to be a difference in how the battle at the plate progressed as batter and pitcher became more and more familiar with each other.
WHAT HAS ALREADY BEEN DONE
David Smith discovered the TTOP in 1996, writing about it in his article “Do Batters Learn During a Game?” He examined the outcomes of sequential plate appearances between starting pitchers and hitters in every game from 1984 to 1995. Smith’s study showed that batters learn faster than the pitchers can adjust during their first three times at the plate. He found the phenomenon consistent across both the American and National leagues and for both home and away batters. Thanks to the work of a host of folks at Retrosheet, our dataset has grown to allow us to examine the TTOP for every season since 1916.2 While Smith’s original study used the standard metrics of 1996 (batting average, on-base average, and slugging average), here we will rely on wOBA, an “all-in-one offensive rate statistic” on the scale of traditional on-base average.3 The wOBA measure uses season-specific values to weight hitters’ outcomes across all plate appearances.4 If you’re familiar with linear weights, you understand wOBA. But even without looking at a single formula, anyone familiar with standard on-base average (OBA) can think of wOBA as OBA’s smarter cousin.
DID DEADBALL BATTERS LEARN?
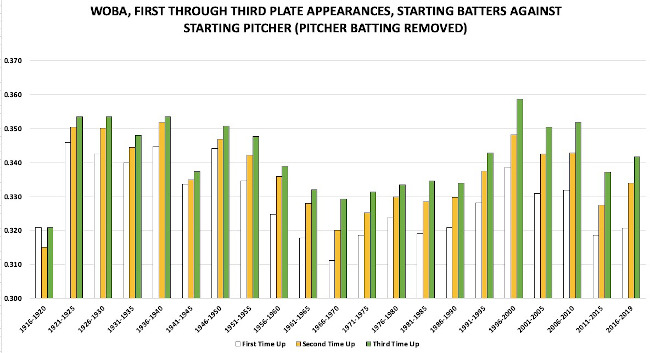
Figure 1 (following page) shows the wOBA of all batters (excluding pitchers at the plate) during their first three plate appearances against the starting pitcher, organized into five-year clusters from 1916 through 2019. We see that for all half-decades after 1920, batters improved their wOBA every time they faced the same pitcher in a game: The second time up is better than the first, and the third time up is even better than the second. The notable exception is the half-decade 1916–20.
There are some limitations with the data. For example, play-by-play for the seasons of 1916–27 is incomplete as I write in the summer of 2020; approximately 75 percent of games are available, a quantity that assures statistical significance. However, for seasons 1928 and beyond, all games are available from Retrosheet. Also, I have excluded the fourth time at the plate from Figure 1, as its wOBA is uniformly greater than the third time for all clusters through 1985 (including 1916–20). Therefore, the fourth time up is not different in 1916–20 and is not considered here.5
(Click image to enlarge)
Focusing on the Deadball years of 1916–20, the outcomes from first to third plate appearances expressed as wOBA form a “U,” with a dip in batter performance the second time around. For shorthand, we will name that Deadball dip the “STUD” (Second Time Up Dip). We also note that the batters improved their third-time outcomes to a level only equal to their first time up, but not improving on it. As mentioned above, the fourth time up is greater still for Deadball batters (not presented in Figure 1). In short, while these batters of long ago did learn, improving their performance during the course of a game, the pitchers maintained a remarkable advantage (illustrated by the STUD) until the batter came to the plate a fourth time.
A NOTE ABOUT 1920
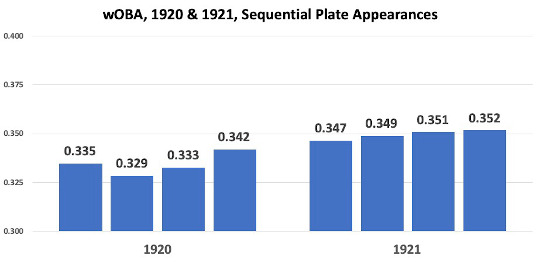
Many baseball historians and analysts consider the 1920 season at best wedged between two eras, and many place it fully with the 1920s for statistical analysis, and that makes sense when looking at traditional rate statistics like runs per game or slugging average, which suggest that the 1920 season had more in common with the 1920s than the 1910s. But when evaluating play-by-play data from 1920 compared to the season immediately afterward (Figure 2), the patterned performance of batters in 1920 games has more in common with the Deadball STUD we saw in Figure 1 than with seasons afterward.
(Click image to enlarge)
WHAT CREATED THE STUD?
Looking back at Figure 1, we can eliminate some potential causes of the STUD, such as the overall weak offensive statistics in the Deadball Era. We see the TTOP present consistently even during the reduced offense of the 1960s, and it remains steady even as offense rises significantly in the late 1990s, so the STUD isn’t a product of the run environment. The STUD was also not the product of differences in the rules. At times of other significant changes, such as changing the height of the pitching mound in the late 1960s or the addition of the designated hitter in the American League in the early 1970s, we see no disruption in the TTOP at all. The TTOP was stable through integration (1947) and expansion (1961 and five times since). Even the introduction of significant numbers of replacement players during World War II did not disrupt the TTOP, which Figure 1 shows to be a remarkably stable characteristic of post-1920 baseball.
The STUD must have been a result of the ball itself. The timing of the STUD’s disappearance is the tell. When the “no trick pitches” rule was issued early in 1920, umpires began replacing balls during games more frequently, even as the press complained.6 Prior to 1920, teams used a single baseball as long as possible. Every incident of contact loosened the ball’s cover, and that loose cover, darkened by dirt and tobacco juice, marred with cuts and scrapes, allowed pitchers to fling the ball with an erratic flight, reducing the chance of good contact by the batter. Changing the rules alone did not eliminate the STUD—implementing the change did, as umpires removed balls from play more often to enforce the new rule, which gave batters a cleaner, tighter ball to hit on a more regular basis. And when the power-hitting revolution took hold in 1921, following Ruth’s example, not only umpires but batters were replacing the ball more often by knocking more and more pitches out of the park.
How sure can we be that the condition of the ball is to blame for the STUD? And why did the STUD persist in 1920 (see Figure 2) when the ban on trick pitches was already in effect?
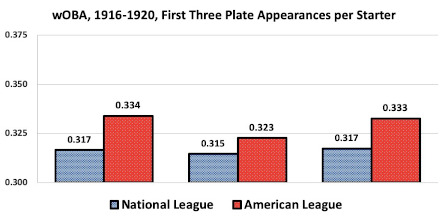
To explore those questions, we divide the 1920 data into two leagues. If the ball was to blame, we should find a STUD in common between the American and National Leagues during the Deadball Era, since league balls were nearly identical and manufactured on the same equipment. Figure 3 shows that while both leagues did demonstrate the STUD, National League batters had a smaller dip, only two points of wOBA, while American League batters dropped 21 points of wOBA their second time up.
(Click image to enlarge)
The difference in the league STUDs seems puzzling at first glance. League balls had only slight, primarily cosmetic differences: the color of some of the stitches.7 If the magnitude of the STUD was driven by how much each league played with a battered ball, the difference between the leagues’ STUDs should be related to the rate at which the ball was replaced. Thanks to a National League press release in December 1920, we can determine that NL teams used about 43 percent more balls per game in 1920 than they had in 1919.8 Focusing on only the National League for just those two seasons, I found that the NL STUD is typical for the Deadball Era in 1919 (about 6 points of wOBA) but nearly gone—less than two points—in 1920. The 1919 and 1920 American League STUD is fully present in both seasons, with a substantial gap of over 12 points (data not presented). The difference in the leagues for these two seasons supports the theory that the condition of the ball was responsible for the STUD. While examining data for only two seasons league by league is slicing very thin, the result is suggestive.9
Why might the AL umpires have been replacing the baseball less often than their NL counterparts? Imagine the situation in 1920: Ban Johnson, his authority waning as American League president, strives to keep the waters calm.10 All these new baseballs cost owners money. At some point in the season, he directs the umpires to cut down on ball replacement, tilting the balance toward the pitchers in the AL and deepening the STUD (as the data show). But after the death of Ray Chapman in August, a tragedy blamed as much on a ball that was difficult to see as on pitcher Carl Mays, the danger of Johnson’s directive becomes obvious. Soon, Kenesaw Mountain Landis is on his way in as commissioner, and there’s nothing to stop more frequent ball replacement in 1921—helping to boost the offense and drive everyone even more baseball crazy.11
WAS THE DEADBALL STUD CONSISTENT FOR VISITING AND HOME BATTERS?
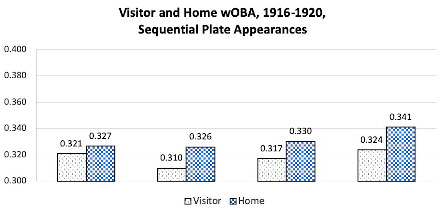
While AL and NL hitters swung at balls damaged to different extents, we can be sure that both the visiting and home teams swung at the same ball during a game. Yet Figure 4 shows that the difference between visiting and home batter performance was much greater than the difference between the leagues. From first to fourth times up, the visitors underperformed compared to the home team, but both teams’ batters improved after climbing out of the STUD. Both teams peak the fourth time up relative to their first three appearances. But while the better performance of any era’s home team batters is not unusual, we notice that the Deadball home team batters also enjoy another advantage: they seem to barely suffer the STUD effect at all.12 Their second-time-up performance is practically as good as their first! Why would the visiting batters’ STUD be so much larger, when both teams must have used the same battered, dirty ball?
(Click image to enlarge)
It’s the first inning. When the visiting batters took the field against the home pitcher in the top of the first, they swung at a clean ball with a tight cover. But in the bottom half, home team batters began with a ball that had almost certainly been in play for at least three batters. So the home batters faced a handicap in the first inning that the visitors did not. The visitors were sure of an advantage the home team could never have: beginning the game with a fresh ball. The home batters performed more poorly their first time up, rather than better-than-expected their second time up. Therefore, the visitors’ STUD is exaggerated while the home team’s STUD is minimized due to never batting with a clean ball in the first inning.
WHAT ABOUT THE PITCHERS?
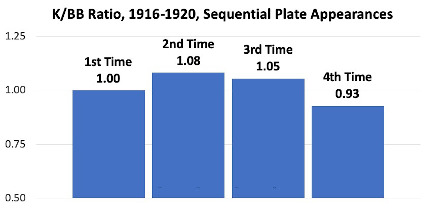
While wOBA is a fine metric to evaluate batter performance, we can learn more about the Deadball Era’s difference by examining the pitchers’ perspective. We will use the strikeout-to-walk ratio (K/BB), which measures how well pitchers control the ball as they attempt to make strikes look like balls and balls look like strikes. K/BB isolates two outcomes over which the pitcher has great influence. If the ball was becoming invisible and disfigured more and more until it was replaced, we would expect strikeouts to increase as walks decrease, as batters could not see the ball well enough to make contact or judge well a pitch’s path relative to the strike zone.
Figure 5 shows that in these late Deadball years, first-time-up batters struck out with the same frequency as they drew walks. But the pitchers gained an advantage of eight strikeouts per 100 walks the second time around, and only by the fourth time up did the batters’ walks exceed their strikeouts. Inducing the swing and miss became more and more difficult as the ball was replaced. Therefore, the decreasing advantage to the pitchers, especially the fourth time around, is expected. By then, batters had seen all the starter’s pitches and could see all of them well, thanks in part to a cleaner ball.
(Click image to enlarge)
What about the pitchers of the 1920s?
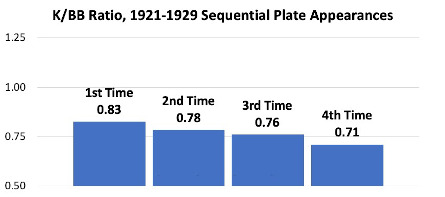
Consistent with other measures of offense like runs per game or wOBA, Figure 6 shows that the pitchers lost a lot of their advantage when the leagues eliminated trick pitches. Pitchers in the 1920s never again enjoyed any in-game improvement in K/BB as they had in the Deadball years (when facing batters their second time up). Each time through the order, we see a decreasing ability to fool the batter into swinging at a ball or letting a strike go by. Strikeouts never exceeded walks, not even close, not even for batters in their first time at the plate. And by the fourth time around, batters had seen the pitcher’s offerings enough to eliminate 12 strikeouts per 100 walks, on average, compared to the first time up.
(Click image to enlarge)
CONCLUSIONS
We can draw the following conclusions from our study of the TTOP for late Deadball Era batters and pitchers:
Batters in 1916–20 saw their performance (defined by wOBA) dip their second time at the plate compared to the first time up, an experience distinctly different from that of batters in seasons since 1920.
The second-time-up-dip (STUD) ended because umpires beginning in 1920 replaced the ball more often to enforce the rules change against trick pitches, a practice accelerated after the death of Ray Chapman in August of that year. Prior to 1921, the ball was not replaced often enough to eliminate the STUD phenomenon.
The 1916–20 STUD is consistent in both American and National Leagues, and for both home and visiting batters. However, the magnitude of the dip was greater for the visiting batters because they always began the game with a fresh baseball, while home batters almost never did. Thus the home batters in the first inning played with a disadvantage that disproportionally depressed their performance for that inning, compared to the first inning for the visiting batters.
The pitchers’ command of the strike zone (as evaluated by the ratio of strikeouts to walks) was better in the 1916–20 period, with strikeouts exceeding walks during batters’ second time at the plate. After 1920 through at least 1929, walks always exceeded strikeouts across all times up, with the batters’ advantage growing during the course of the game.
JAY WIGLEY first joined SABR in 1999 after discovering Retrosheet in 1996. His earliest baseball memory is the scoreboard animations at the Astrodome during a game in the early 1970s. Jay lives in Knoxville, Tennessee, where he works as a Quality professional in the medical device industry.
Sources
Steve Steinberg, “The Spitball and the End of the Deadball Era,” The National Pastime 23 (2003): 7–17.
David J. Gordon, “The Rise and Fall of the Deadball Era,” Baseball Research Journal 47 (Fall 2018).
Notes
- Tom Tango, Mitchel Lichtman, and Andrew Dolphin, The Book: Playing the Percentages in Baseball (CreateSpace Independent Publishing Platform, 2014), 191.
- Smith’s original study was most recently published in SABR 50 at 50: The Society for American Baseball Research’s Fifty Most Essential Contributions to the Game, edited by Bill Nowlin, et al., (Lincoln: University of Nebraska Press, 2020), and was last revised in 2005, using all the Retrosheet data available then. Both Smith’s and this study, therefore, used information obtained free of charge from and copyrighted by Retrosheet. Interested parties may contact Retrosheet at 20 Sunset Rd., Newark, DE 19711.
- Michael Lichtman, “Everything You Always Wanted to Know About the Times Through the Order Penalty,” Baseball Prospectus, November 5, 2013. https://www.baseballprospectus.com/news/article/22156/baseball-proguestus-everything-you-always-wanted-to-know-about-the-times-through-the-order-penalty. wOBA multiplies the run values of various offensive events, divides by a batter’s plate appearances, and produces a metric on the scale of on-base average.
- To calculate each wOBA in this study I used the weights provided by Fangraphs at https://www.fangraphs.com/guts.aspx.
- Batters since the late 1980s have shown a consistent decline in their fourth-time-up performance, as noted by Smith and The decline has been evaluated in some detail elsewhere. For example, see Smith’s study, as well as Lichtman, “Everything You Always Wanted to Know.”
- “A Waste That Should Be Checked,” The Sporting News, August 5, 1920. This view was likely a channeling of the owners’ frustration with the increasing expense of all those new baseballs.
- “The only difference [in the baseball itself] is the label and the red and blue stitches used in the American League ball as opposed to the red and black stitches used in the National League ” Russell Wright, A Tale of Two Leagues (Jefferson, N.C.: McFarland and Company, 1999), 11.
- “Most Successful Season,” The Brooklyn Daily Eagle, December 15, 1920. The story explains that 27,924 balls were used in the NL for the 1920 season, and provides comparable data for 1919. The total number of baseballs used would include spring training games, exhibition games, and batting practice balls, so a simple “balls per game” metric is not possible. However, we can compare the two seasons to derive the 43 percent estimate with confidence.
- There are other indications that NL umpires were stricter in enforcing the ban on trick For example, see the ejection of Slim Sallee for using a foreign substance on the ball, as described in “Giants Win Final Clash from Reds,” New York Times, June 12, 1920.
- For more on Johnson’s struggle to maintain authority over the AL owners, see Michael Lynch’s Harry Frazee, Ban Johnson and the Feud That Nearly Destroyed the American League (Jefferson, C.: McFarland and Company, 2008).
- “Umpires Criticize Mays,” The New York Times, August 19, 1920. The story, published three days after Chapman’s beaning, makes it clear that Johnson had directed umpires to leave nondangerous balls in play “as long as possible” at some point earlier that season.
- David Smith, “Do Batters Learn During a Game?” Retrosheet, June 7, 1996. https://www.retrosheet.org/Research/SmithD/batlearn.pdf. Smith explained in his study that the visiting pitchers must adjust to an unfamiliar mound, and the home batters are more familiar with the hitting background and idiosyncrasies of the home park. Such factors combine to produce a home batter advantage (compared to visiting batters) throughout the game.