

The Rise and Fall of the Deadball Era
This article was written by David J. Gordon
This article was published in Fall 2018 Baseball Research Journal
 If a modern fan could be transported back to a baseball game in 1908, to the strains of the new tune “Take Me out to the Ball Game,” he or she would feel right at home. The rules, the two major leagues, and many of the teams were similar then to what they are today. However, 1908 was also the offensive nadir of what is now popularly called the Deadball Era, a two-decade period of depressed run-scoring between 1901 (when the elevation of the American League to major league status doubled the number of major-league teams from eight to 16) and 1919 (the year Babe Ruth started hitting home runs in bunches).1 This was a period when all major-league teams combined to hit .254/.316/.332 (batting average/on-base average/slugging average), and the average game featured only 3.9 runs, 8.4 hits, and 0.15 home runs per team.2
The popular narrative attributes the dearth of offensive production during this period largely to the properties of the ball (hence “Deadball”), pointing to the change from a rubber center to cork in 1910, the abolition of the spitball and other ball-doctoring techniques in 1920, and a policy mandating the removal of dirty and damaged balls from the game (inspired by the death of Cleveland shortstop Ray Chapman, who was hit in the head by an errant Carl Mays fastball that he could not see in August 1920).3 But I believe this is an incomplete and overly simplistic narrative. While ball-centered theories help explain the end of the Deadball Era, they cannot explain why it began in the first place, since the ball was no “livelier” only seven years earlier (when scoring was at an all-time high) than it was in 1901.
I propose here a more holistic narrative to describe the rise and fall of the Deadball Era. I will describe how conditions in the 1870s, when major-league baseball began, favored a contact-oriented approach to hitting and produced an entertaining, high-scoring game; how changes in the rules governing pitchers, the adoption of fielding gloves, and the evolution and refinement of fielding gradually tipped the balance toward defense; how rule changes—designed mostly to favor hitters—helped ward off the inexorable decline of scoring in the 1880s and 1890s; how the advent of power pitchers in the late 1890s and the foul-strike rule in 1901–03 finally overwhelmed these measures and brought about the Deadball Era; and how the arrival of Ruth (and his imitators) led to the obsolescence of the “scientific” contact-oriented strategies in favor of a new hitting paradigm based on power and a free-swinging approach.
While it is impossible to completely sort out cause and effect in the many trends that shaped the game in its first 50 years, I believe this narrative fits the historic data far better than the simplistic dead ball/live ball dichotomy.
Specialized Statistics
In addition to the conventional stats, I have devised a statistic called Defensive Efficiency (DE), closely related to batting average on balls in play (BABIP). DE quantifies the percentage of balls in play that result in the batter being retired without reaching base safely, and counts reaching base on an error as equivalent to a hit. Specifically,
DE = 1 – (H + ROE – OPHR) / (AB – OPHR – SO + SH)
where H = hits, ROE = reached base on an error, OPHR = out-of-the-park home runs, AB = at-bats, SO = strikeouts, SH = sacrifice hits. Data for sacrifice hits is imperfect, since sacrifice bunts were not tracked until 1894 and sacrifice flies were not broken out as a separate category until 1954, but SH are only a minor component of this calculation. Data for inside-the-park home runs (IPHR) and OPHR, and for ROE and errors that only allow existing baserunners to take an extra base were obtained from Baseball-Reference.com’s Play Index tool, which contains tabulations of IPHR and ROE based on play-by-play data going back to 1925.4 Note that the data are 100% complete going back to 1974, 97% complete from 1950-73, but only 64-90% complete from 1925-49. The percentage of errors resulting in a baserunner ROE is quite constant over time, so I have simply multiplied total errors per game by 63.3%, the average of the 1974-2017 percentages, to determine ROE for each season. For HR, which has a strong decreasing temporal trend, I divided the 1925-73 IPHR totals by the percent coverage to correct for missing data (which assumes that IPHR/HR is the similar for the missing and covered data). For 1871-1924, I assumed that the percentage of home runs that were IPHR in each time period were as follows:
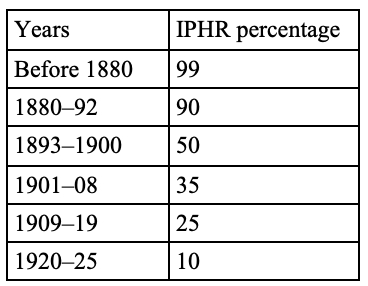
Even though a high proportion of HR before 1900 did not leave the ballpark, IPHR were never sufficiently frequent to have much impact on the calculation of DE.
I have also used a stat called BIP%, the percentage of plate appearances on which a ball is put in play. Specifically,
BIP% = 100%*(PA – BB – SO – OPHR – HBP) / PA
where BB = bases on balls and HBP = hit batsmen. This stat is basically one minus “three true outcomes” (TTO), with the slight correction that IPHR are counted as balls in play.5
In the beginning
When the National Association of Professional Base Ball Players was established in 1871, the rules were very different from what they are today or what they were during the Deadball Era.6 Pitchers delivered the ball from anywhere within a 6-by-6-foot pitcher’s box whose front edge was only 45 feet from the batter. The pitcher could take a short running start but was required to pitch underhanded. The batter could ask for a pitch to be high or low, and when the batter did not offer at a pitch, the umpire generally called “no pitch” unless the ball was where the batter asked for it (a strike) or the pitcher threw the ball in the dirt or behind the batter or persistently out of the strike zone (a ball). The first pitch was never called. The batter received a free base after three balls were called, but walks, like strikeouts, were rare. The real action took place after the ball was hit.
Many games were played in open fields or with distant fences, so there was no great incentive for a batter to hit the ball far, so long as he hit it hard and in play. Fielders played bare-handed and errors were common. The result was a highly entertaining but inelegant game, with lots of errors and lots of runs, mostly unearned. Despite the fact that the ball itself was similar to the ones used 30 years later in the Deadball Era, it is safe to say that no one who watched baseball in the 1870s would have dreamed of using the epithet deadball to describe what they saw.
So how did this free-wheeling, high-scoring game turn into the tight, low-scoring chess-matches of the Deadball Era? The answer is to be found not in the ball itself, but in two significant historic trends.
- The development and popularization of fielding gloves, which improved DE and made it harder to reach base by merely putting the ball in play.
- A series of rule changes that shifted power from soft-tossing pitchers who relied heavily on deception and finesse to bigger pitchers who could throw hard enough to succeed from 60 feet away.
In Table 1, I have summarized key rule changes that contributed most to the long-term decline in run-scoring and the evolution of the Deadball Era. The most important of these changes were probably the removal of restrictions on a pitcher’s delivery and the batter’s ability to call for a high or low pitch in the mid-1880s, and the addition in the early 1900s of the foul-ball strike, which accelerated the scoring decline that was already well underway. Rule-makers tried to mitigate this trend by making it easier to walk hitters and by increasing the pitcher-batter distance—most successfully in 1893, when they set the distance at 60.5 feet and eliminated the pitcher’s box, setting off a brief but spectacular scoring explosion in the mid-1890s. But eventually, the scoring decline won out and would persist until 1920.
Table 1: Key nineteenth- and early twentieth-century changes in official rules7
Pitching Distance
- 1871-73: 45′ (pitcher’s line)
- 1874-78, 80: 45′ (Front line at 45′; back line at 51′)
- 1879: 45′ (Front line at 45′; back line at 49′)
- 1881-85: 50′ (Front line at 50′; back line at 56′)
- 1886: 50′ (Front line at 50′; back line at 57′)
- 1887-92: 55.5′ (Front line at 50′; back line at 55.5′). Pitcher began delivery from back line.
- 1893-present: 60.5′ (hard rubber slab; no box)
Pitching Delivery
- 1879-82: Arm must be below waist
- 1883: Arm can be above waist
- 1884-1919: No restrictions
- 1920-present: Spitball outlawed (but 17 practitioners grandfathered)
Strike Zone
- 1871-86: Batter can call for high or low pitch
- 1887-present: Pitcher can throw anywhere in the strike zone
Base on Balls Definition
- 1871-78: 3 balls (but balls only called on pitches in dirt, behind batter, etc.)
- 1879: 9 balls (but every pitch must be called a ball, strike, or foul)
- 1880-83: 8 balls
- 1884-86: 6 balls
- 1887-88: 5 balls, batters awarded 1B on hit by pitch
- 1889-present: 4 balls, batters awarded 1B on hit by pitch
Strikeout Definition
- 1871-86: 3 strikes
- 1887: 4 strikes
- 1888-1902: 3 strikes
Foul Balls
- 1871-82: Not counted as strikes. But batter is retired on foul balls caught on the fly or on one bounce
- 1883-93: Not counted as strikes. Batter only retired on foul balls caught before hitting ground.
- 1894-1900: Foul bunts counted as strikes
- 1901-1902: Other foul balls counted as strikes unless the batter already had 2 strikes (NL)
- 1903-present: Other foul balls counted as strikes unless the batter already had 2 strikes (AL and NL)
The Bat
- 1871-84: Must be round
- 1885-92: One side may be flat
- 1893-present: Must be round
The Ball
- 1871-1909: Hard rubber core, balls replaced infrequently
- 1910-1919: Lighter cork core, balls replaced infrequently
- 1920-present: Lighter cork core, dirty or damaged balls replaced
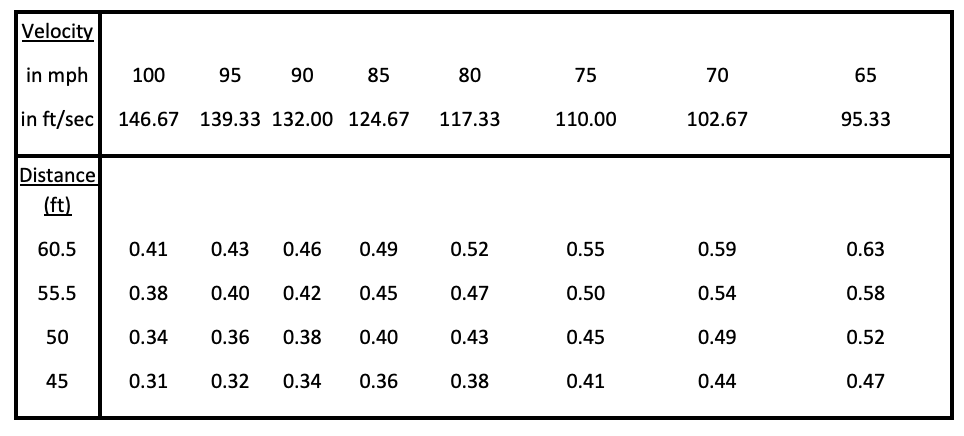
Let us pause for a moment to think about the profound implications of the changes in pitching distance.8 The three staples of pitching are velocity, command, and deception. Although we know that the top pitchers in the nineteenth century were masters of command and deception, there were no radar guns to tell us how hard they threw. However, what matters to a batter is not velocity per se, but how much time he has to react to a pitch, which is a function not only of velocity but the distance the ball travels to reach him. Mathematically, reaction time equals 0.341 times distance divided by velocity (where .341 = 60*60/5280 is the conversion factor from feet per second to miles per hour). So, in terms of batter reaction times (Table 2), a change in pitching distance from 55.5 to 60.5 feet is equivalent to nearly a 10 percent drop in velocity.
Table 2: Impact of distance and velocity on time (in seconds) from pitcher’s hand to batter
(Click image to enlarge.)
For example, a 100-mph fastball thrown from the post-1892 distance of 60.5 feet takes 0.41 seconds to reach the batter—similar to a 91.7-mph fastball thrown from 55.5 feet, an 82.6-mph fastball thrown from 50 feet, or a 74.4-mph fastball thrown from 45 feet. Given how difficult it is for modern hitters to catch up to a 100-mph fastball and the rarity of strikeouts in the nineteenth century, one does not need a radar gun to infer that 19th century pitchers generally did not exceed these velocities. For simplicity, I have ignored air drag and the length of a pitcher’s stride from these calculations.
Now, let us examine four simple graphs tracking the trends in scoring, fielding, home runs, and strikeouts from 1871–2017. While this article will focus primarily on trends in baseball’s first five decades, the subsequent decades provide a useful context and perspective.
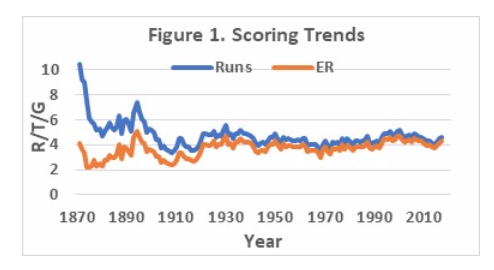
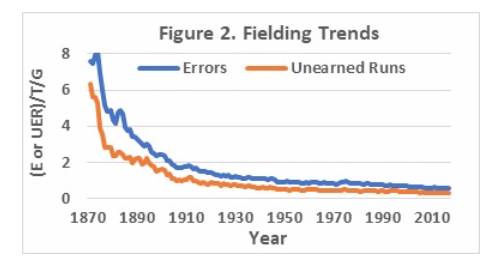
Scoring fluctuated wildly in baseball’s first half-century and has been relatively flat ever since (Figure 1). Perturbations like the scoring drought of 1963–72 and the high scoring of the steroid years seem small by comparison. There was also a steep downward trend in errors and unearned runs between 1870 and 1910, reflecting the development, popularization, and improvement of fielding gloves and increasing consciousness of the importance of defense (Figure 2). Fielding gloves had been used as early as 1869 by some catchers and first basemen to protect their hands from injury; they chose flesh colors for camouflage to avoid ridicule, since the use of such gloves was widely considered to be unmanly.9 As the frequency of games increased in the late 1870s and ’80s, and as the daily pounding to their hands became more painful, more padding was added. By the mid-1880s, gloves began to catch on, as other position players followed suit. By 1895, everyone wore a fielder’s glove. Most of the early gloves were pretty crude and lacked sufficient flexibility to do much more than knock down hard-hit balls and hope that a play could be made. It was only in 1920, when the Rawlings company created the Bill Doak glove with a web between the thumb and forefinger, that the glove began to be viewed as a defensive as well as a protective accessory.10 Fielding and fielding gloves have continued to improve since then.
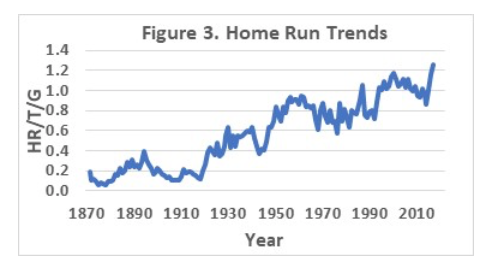
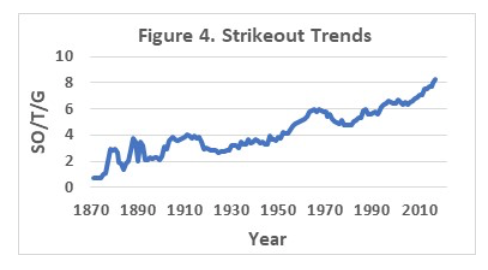
Home runs were relatively scarce in baseball’s first five decades but took off in 1920, and have been increasing in fits and starts ever since (Figure 3). The discernible peak in the steroid years is not the only one. Finally, strikeouts fluctuated in the 1880s, went up temporarily during the Deadball years with the implementation of the foul-strike rule, dropped in the 1920s and ’30s, then took off in the 1950s and are still rising today (Figure 4). While I will focus in this article on analyzing the trends in baseball’s first 50 years, the subsequent trends provide a useful context and perspective.
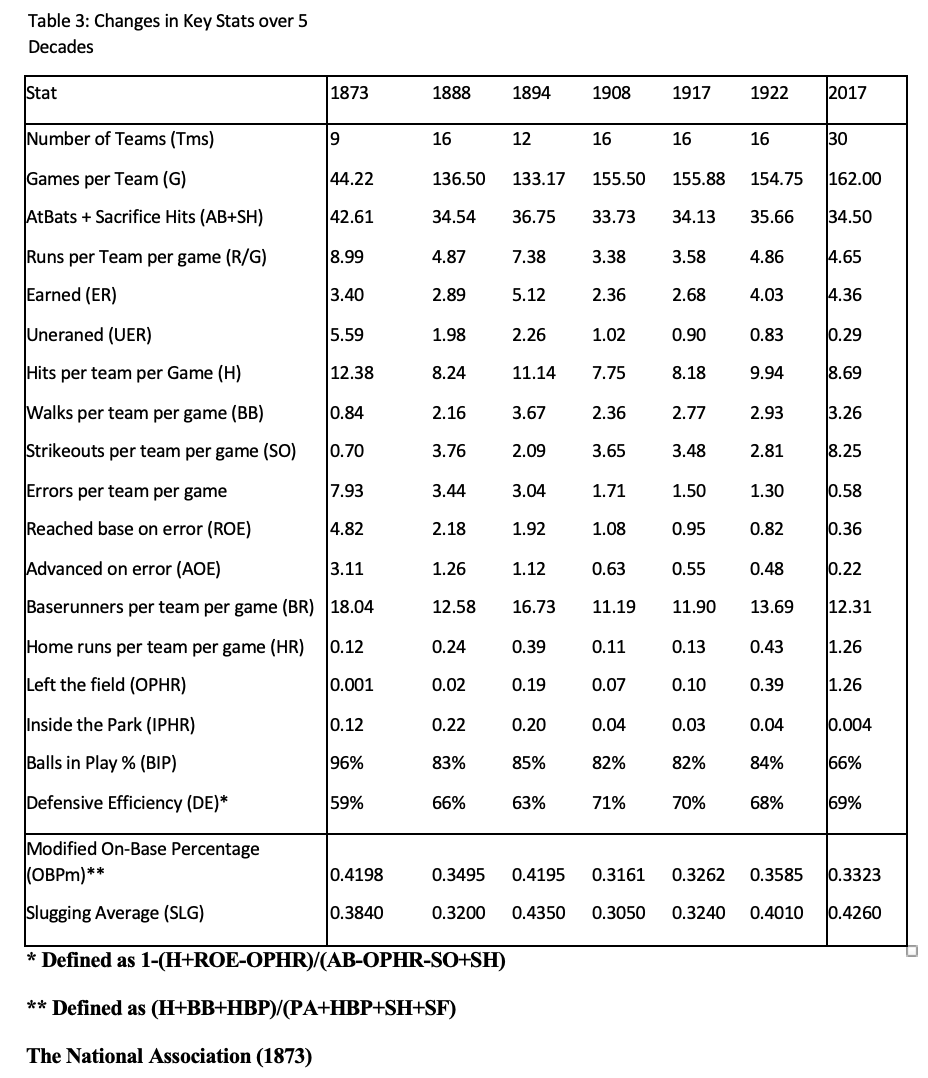
In Table 3, I have selected a one-season snapshot from each decade of the nineteenth century (1873, 1888, and 1894), the Deadball Era (1908 and 1917), and the beginning of the post-Deadball Era (1922), and compared them to baseball in 2017. In choosing these seasons, I have avoided atypical years like 1884, 1890, and 1915–16, when MLB lost players to the Union Association, Players League, and Federal League respectively, and 1918, when many players served in World War I. The italicized numbers in red represent estimates of data that were not tracked contemporaneously.
Table 3: Key statistical changes over 5 decades of MLB
(Click image to enlarge.)
The National Association (1873)
In 1873, baseball bore little resemblance to the modern game (Table 3). In addition to the rules differences summarized in Table 1, teams played only 44 games, and most teams used the same pitcher to start every game. Teams usually contained one or two backup pitchers (who usually played other positions as well), but pitchers finished what they started 91 percent of the time. Pitchers pitched underhand and tended to rely more on deception than velocity; hitters put the ball in play in 96 percent of plate appearances despite standing only 45 feet away from the pitcher. Walks (0.84 per team per game) and strikeouts (0.70 per team per game) were exceedingly rare, since batters were permitted to call for a low or high pitch and umpires most often called “no pitch” on balls out of the requested zone.
Fielding was abysmal in 1873, largely because fielders eschewed gloves. In the average game, the two teams would combine to make 16 errors and allow 11 unearned runs (out of 18 total runs); by contrast, a typical 2017 game featured only 9.3 runs, of which only 0.6 were unearned. Indeed, teams scored almost a full earned run more per game in 2017 than in 1873. DE in 1873 was only 59.4 percent (compared to 68.8 percent today). In other words, any hitter who could put the ball in play in 1873 had a 40.6 percent chance to reach base safely. With those odds, it would be foolish for a batter to take big swings and risk striking out, especially in ballparks where the odds of an OPHR were limited by distant or non-existent fences.
In this environment, a contact-oriented, “scientific” approach to hitting flourished. Even big, strong players like Chicago White Stockings star Cap Anson, who stood 6’0” and weighed well over 200 pounds, choked up on his bat and half-swung, using his wrists to generate line drives.11 No exit velocities and launch angles for him! This style became the model for most players and produced a very lively, high-scoring (albeit sloppy) brand of baseball.
The 1880s: A decade of change (1888)
The 1880s were a decade of constant tinkering with the rules (Table 1). By 1888, most of these changes were already in effect, although it still took five balls for a walk and pitchers still threw from a box 50 feet from home plate. With teams now averaging 136 games per season, most employed two principal starting pitchers to share the workload. However, pitchers still completed 96 percent of the games they started and racked up workloads of 500 innings or more—unheard of before or since. The frequency of walks and strikeouts increased, since umpires called every pitch and only five balls were needed for a walk. Therefore, the percentage of balls put in play fell from 96 percent to 83 percent of plate appearances. Crude fielding gloves were in widespread (but not universal) use by 1888. Thus, the frequency of errors had fallen by more than half (from 7.93 to 3.44 per team per game) and unearned runs had fallen correspondingly, from 5.59 to 1.98 per team per game.
Although DE increased from 59 percent in 1873 to 66 percent in 1888, a contact-oriented approach still made sense, since walks remained less frequent than errors and OPHR were still uncommon. Players could still reach base 33.8 percent of the time by putting the ball in play, and that is exactly what most of the powerful sluggers did. Four exemplars of this approach were Anson, who was still going strong at age 37, 6’0” Dan Brouthers, 6’2” Sam Thompson, and 6’3”, 220-pound “giant” (for his time) Roger Connor, who with 138 home runs was baseball’s career leader until Ruth came along, and whose impressive bulk inspired sportswriters to dub his team the Giants. Anson, Brouthers, Thompson, and Connor rarely struck out, with career strikeout rates ranging from Brouthers’s 3.1 percent to Connor’s 5.1.
The Roaring ’90s (1894)
If one considers only earned runs, the highest scoring season in MLB history was not 1930, when the entire NL batted .303, nor at any time during the steroid era, but in 1894, a mere seven years before the start of the Deadball Era, with the same ball and mostly (with one key exception) the same playing rules (Table 1). A year earlier, MLB had increased the pitching distance from 55.5 to 60.5 feet and had replaced the pitcher’s box with a rubber slab in order to boost offense, which succeeded far beyond anyone’s wildest dreams. This was a major disruptive change and raised the leaguewide ERA from 3.28 in 1892 to 4.66 in 1893 and to 5.33 in 1894. Many of the small, wily pitchers who thrived in the 1880s could re-calibrate their breaking pitches to the new distance, but there was nothing they could do to compensate for the 10% increase in the time it took their fastballs to reach home plate. This extra time for a batter to react demotes a plus fastball to adequate and an adequate fastball to batting practice. Most pitchers simply could not adapt to this loss of effective velocity. For example, the 32-year-old, 5’9” Bill Hutchinson, who was among the NL Top 10 in ERA at 2.76 in 1892 (and had a 2.81 ERA in 1891), immediately saw his ERA balloon to 4.75 in 1893 and 6.03 in 1894. Similarly, Hall of Famer John Clarkson, who stood 5’10” and turned 31 in 1892, saw his ERA, which had been 2.79 in 1891 and 2.48 in 1892, jump to 4.45 in 1893 and 4.42 in 1894. He promptly retired.
Younger players were not exempt. Diminutive (5’7”) rookie Nig Cuppy, who debuted with a 2.51 ERA in 1892 at age 22, saw his ERA rise to 4.47 in 1893 and 4.56 in 1894, although he went on to have a fine career. Other pitchers 25 years old or younger (like George Davies, Gus Weyhing, Harry Staley, and George Haddock) who populated the lists of ERA leaders in 1891–92 were less fortunate and never again posted an ERA under 4; all but Weyhing quickly fell out of the league. Bigger pitchers, like 25-year-old 6’2” Cy Young and 21-year-old, 6’1” fireballer Amos Rusie (as well as 5’10”, 22-year-old Kid Nichols), tended to fare better, but none escaped the league-wide rise in ERA in 1893–94. Indeed, all but Rusie saw at least a one-run increase in ERA.
The drastic change in pitching conditions continued to propel this high-scoring version of baseball up to the turn of the century. Although fielding gloves had now become almost universal, fielding had not improved all that much since 1888, perhaps because more balls were hit hard. There were still six errors and 4.5 unearned runs by the two teams in the average game, but walks were now more frequent than errors. The frequency of HR also increased from 0.24 per team per game in 1888 to 0.39 in 1894, a fact that is often overlooked and is probably attributable to the decimation of top pitchers. (The proportion of HR that left the park is not really known; the numbers in Table 3 are “guestimates.”) It was still unusual for any single player to hit 20 or more HR. Still, 85 percent of all PA resulted in balls in play, and defenses converted only 63 percent of these plays to outs. Hall of Fame outfielder Willie Keeler of the 1890s Baltimore Orioles, who stood only 5’4”, weighed only 140 pounds, and struck out only 136 times in 8,591 AB in his career (best ratio by far of any player ever), famously explained his success by claiming that he “hit ’em where they ain’t.”12 Actually, the secret to his success was to put the ball in play; the fielders did the rest. Few pitchers in the 1890s could stop him.

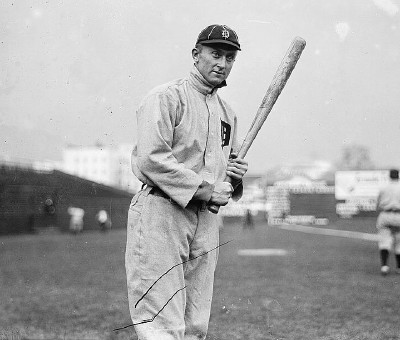
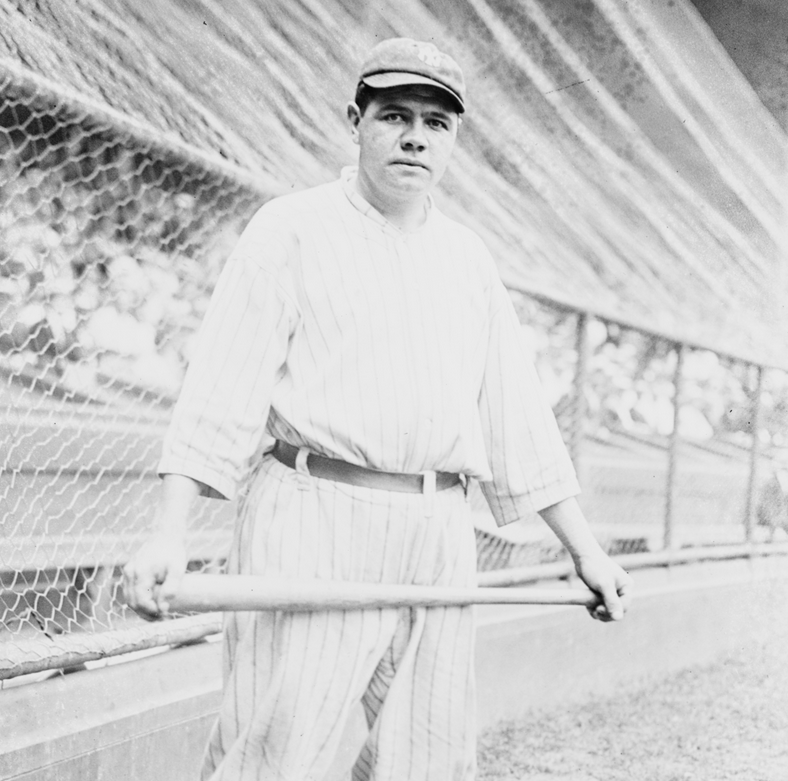
Pitchers like Christy Mathewson dominated baseball during the Deadball Era. (Library of Congress, Thompson Collection)
Low ebb (1908)
With scoring at an all-time high in 1894, the gradual scoring decline throughout the rest of the 1890s was barely noticeable at first—6.58 runs per team per game in 1895 to 6.04 in 1896 to 5.88 in 1897 to 4.96 in 1898. But after a small uptick in 1899–1900, the scoring decline picked up steam, falling below 4.5 in 1902–03, below 4 in 1904–07 and reaching an all-time low of 3.38 in 1908. The Deadball Era had taken hold.
So, how did that happen? First, a new rule counting foul balls as strikes was adopted in 1901 in the NL and 1903 in the AL (Table 1). Strikeout rates per nine innings immediately jumped by more than 50 percent in each league—from 2.45 in 1900 to 3.83 in 1901 in the NL and from 2.54 in 1902 to 3.86 in 1903 in the AL. Scoring had already been in decline before 1901, but this new rule almost certainly helped accelerate the trend. Second, fielding had taken a leap forward, as errors fell from 3.04 per team per game in 1894 to 1.71 in 1908. Batters continued to put the ball in play 82 percent of the time, but fielders now converted 71 percent of these balls into outs and allowed only one unearned run per team per game. Finally, a new generation of pitchers stepped into the breech: Christy Mathewson, Ed Walsh, Eddie Plank, Rube Waddell, and others. Some of them threw hard and others were armed with new pitches like the fadeaway, the spitball, and the knuckleball. It is also noteworthy that teams began to carry more pitchers and share the workload. In 1908, Walsh was the last pitcher to work more than 400 innings in a season.
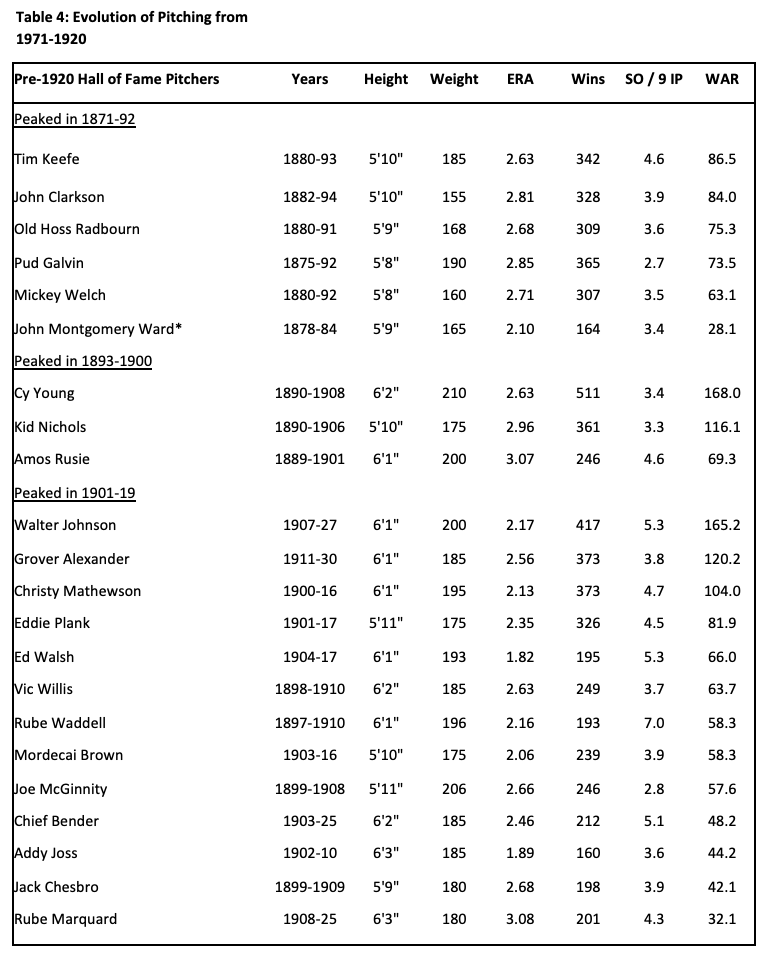
Table 4 lists all of the Hall of Fame pitchers who enjoyed their career peaks in 1871–92, 1893–1900, and 1901–19 in descending order of Wins Above Replacement (WAR).13 Pitchers were clearly bigger after 1892. Among the six pre-1893 pitchers who were selected for the Hall of Fame as players, none stood taller than 5’10, and only one, Tim Keefe, who packed 185 pounds on his 5’10” frame, struck out more than 4 batters per nine innings pitched (IP). The 16 Hall of Fame pitchers of 1893–1919 had a decidedly different look; 11 stood more than 6’1” and only one (Jack Chesbro) stood 5’9’’ or less. While most were not power pitchers by modern standards, Waddell averaged a previously unheard of 7 SO per 9 IP, and Walter Johnson, spitballer Walsh, and Chief Bender each averaged more than 5 SO per 9 IP.
Table 4: Hall of Fame pitchers from baseball’s first 50 years14
(Click image to enlarge.)
Instead of looking for new strategies to generate more runs to counter the falloff in offense, managers doubled down on the old small-ball strategies, treating every run as precious. If their teams couldn’t score a lot, they would use every trick in the book to capitalize on their scoring opportunities and to deny runs to the opposing team. Pitching, fielding, and speed took on new importance. Bunts, hit-and-run plays, and stolen bases moved to the fore, and power took a backseat. Home run rates fell by two-thirds (to 0.11 per team per game) from 1894 to 1908. The best position players following the turn of the century were Honus Wagner and Nap Lajoie, who hit for high average and excelled on defense as well. In 1906, a Chicago White Sox team nicknamed the “Hitless Wonders” upset the 116-win Chicago Cubs in the World Series after hitting only .230/.301/.286 during the season.15 But a closer inspection reveals that the Cubs only hit .262/.328/.339 that year—better than the Sox, to be sure, yet not exactly “Murderers’ Row.”
The Twilight of Deadball (1917)
The next decade saw the peaks of all-time great hitters like Ty Cobb, Tris Speaker, Eddie Collins, and Shoeless Joe Jackson— who (in the mold of Wagner and Lajoie) excelled in all aspects of the game except power—and the arrival of all-time pitching greats like Walter Johnson and Grover Alexander. The introduction of a new livelier ball with a cork center in 1910 barely moved the needle.16 Runs (3.59 per team per game), baserunners (11.81 per team per game), and home runs (0.13 per team per game) ticked up slightly from 1908, but contact-oriented one-run strategies continued to prevail. The percentage of balls put in play (82) and DE (71) did not budge at all.
By 1917, most teams used four-man rotations, allowing pitchers to rest more between starts. Also, relief pitchers were used more often, and the percentage of complete games fell from 88 percent in 1904 to 67 percent in 1908 and to 55 percent in 1917. However, the top pitchers of 1917 (Johnson, Alexander, Ruth) still completed more than 80 percent of their starts. Finally, errors and unearned runs continued to decline, to 1.5 and 0.9 per team per game respectively, cutting into the small increase in earned runs from 2.36 to 2.69 per team per game.
Babe Ruth and the paradigm shift (1922)
 By the early 1920s many of the elements for improved scoring were in place—a lighter, livelier ball, the phasing out of the spitball, and a new policy removing damaged balls from the game more frequently. But it would take the example of an extraordinary talent, ex-pitcher Babe Ruth, who became a full-time outfielder in 1919, to change the landscape. Rather than use the “scientific approach” championed by old school stars like Ty Cobb, who thrived in the Deadball Era by perfecting the art of using his contact skills, speed, and sheer meanness to extract every advantage from his prodigious talent, Ruth worried about nothing but swinging the bat as hard as he could and sending balls flying over the fence.17 Ned Williamson, who hit a flukish 27 HR for the Chicago White Stockings in 1884 when they changed the ground rules of their home field, White Stocking Park (186’ in LF, 300’ in CF, 196’ in RF) for a single season to allow balls hit over the fences to be called HR instead of doubles, held the record until Ruth broke it with 29 in 1919.18 At first, Ruth stood alone, outhomering his nearest competitor 29–12 in 1919, 54–19 in 1920, and 59–24 in 1921. But in 1922, imitators started crashing the party. Rogers Hornsby, a player in the Cobb mold who had played since 1915 without hitting more than nine homers in a season, suddenly hit 21 in 1921 and an MLB-leading 42 in 1922. The 30-home-run club would add 19 more hitters by 1930.19
But how could a single player, no matter how special, overturn a paradigm that had been in place for 50 years? To put it simply, the new paradigm worked. Ruth and Lou Gehrig anchored a powerful Yankees lineup that won six pennants and three World Series between 1921 and ’28. When they were finally displaced, it was by the Philadelphia Athletics, another powerhouse, who featured sluggers like Jimmie Foxx and Al Simmons. Every team wanted one or two of these guys and every player with the requisite size and strength wanted to be one. Baseball has always been a game of adjustments and imitation. When something works, it is quickly adopted by opponents.
On a more abstract level, small ball may have been the most effective run-scoring strategy under the conditions that prevailed in the nineteenth century, but it is an inefficient scoring strategy in an environment where fielders convert 70 percent of balls in play into outs. In just five years between 1917 and 1922, scoring increased by 36 percent, from 3.6 to 4.9 runs per team per game, despite continuing declines in errors and unearned runs. Perhaps surprisingly, strikeouts decreased in the 1920s, and more balls were put in play (84 percent) despite the tripling of the HR rate from 0.13 to 0.43 per team per game and a slight increase in walks. I attribute the small decline in DE (70 to 68 percent) to the fact that more balls in play were being hit hard. Viewed through a historical lens, the surprise is not that this paradigm shift took place, but that it took so long.
To be sure, the aforementioned ball-related changes laid the groundwork for the paradigm shift embodied by Ruth. But the chronology doesn’t really fit so neatly:
- Ruth’s first monster season in 1920 (when he hit 54 HR) came a decade after the cork core was introduced to make the ball lighter and livelier. What took so long?
- Ruth’s 54-HR season also pre-dated Chapman’s fatal beaning and was accomplished before the new policy on replacing dirty and scuffed baseballs took full effect.—though not as many as in previous seasons.
- When the spitball and similar pitches were phased out in 1920, only 17 pitchers threw the pitch regularly. These 17 pitchers were grandfathered and continued to use the pitch legally until they retired; the last one was Burleigh Grimes, who retired in 1934. Of course, anyone who knows anything about Gaylord Perry understands that the practice of deliberately defacing or applying foreign substances to the ball to get extra movement did not end in 1934.20 It seems implausible that such a small and gradual change could have changed baseball so quickly and profoundly.
However, whatever role these ball-related changes may have played in ending the Deadball Era, one thing is certain. These changes had nothing to do with how the Deadball Era started in the first place.
- The modern game: Fast forward (2017)
The changes Ruth set in motion in 1919 have grown more extreme in the ensuing century. Most strikingly, HR rates have nearly tripled from 0.43 to 1.26 per team per game between 1922 and 2017 (Figure 3), and strikeouts have skyrocketed from 2.81 to 8.25 per team per game (Figure 4). The average pitching staff today has more SO per 9 IP than Waddell, the top strikeout pitcher of baseball’s first half century! A detailed analysis of this trend is beyond the scope of this essay, but it surely must have a lot to do with 13-man pitching staffs and the rise of the relief pitcher. The concomitant rise in bases on balls to 3.26 per team per game is less dramatic. As gloves have improved and fielders become more athletic, error rates have continued to fall to where they now reside at 0.58 per team per game (less than half the 1922 rate), with unearned runs down by 65 percent to 0.29 per team per game (Figure 2). Baseball has increasingly become a game of the “three true outcomes” (walks, strikeouts, and home runs), with only 66 percent of plate appearances ending in balls put in play, but DE has held steady at 69 percent. Finally, scoring has had ups (the steroid era) and downs (the late 1960s), but has mostly remained between 4 and 5 runs per team per game (Figure 1).
Now, in 2018, MLB may be in a place similar to where it was at the end of the nineteenth century, except that now baseball is stuck in a long-ball paradigm that is beginning to show cracks. The decline of balls in play has made it harder to string together hits and productive outs, and has thereby produced a game full of long dead patches punctuated by staccato bursts of scoring, often driven by home runs. The 2014–15 Kansas City Royals bucked this trend, but only briefly. Since walks and strikeouts typically consume more pitches per batter than balls put in play, and frequent pitching changes (accompanied by breaks for TV commercials) are time-consuming, games have become longer. Modern analytics have brought us extreme defensive shifts to further enhance defensive efficiency, and hitters, instead of bunting and hitting to the opposite field to counter these shifts, have doubled down on long-ball strategies to try to yank the ball over the shifts. According to the late Orioles manager Earl Weaver, “Pitching keeps you in the game. Home runs win the game.”21 That aphorism may still be apt, but one wonders if hordes of smoke-throwing relief pitchers shuttling to and from the minors daily, fortified by defensive shifts that batters are too stubborn to break, will soon bring the game to a tipping point similar to the Deadball Era.
Conclusions
“Deadball” is largely a misnomer. The ball was no “deader” than it had been when offenses were riding high a few years earlier. Moreover, the many devoted fans of the aggressive and closely contested games of 1901–19 found the games to be anything but “dead.” The process leading to “deadball” was set in motion 30 years earlier by rules and conditions that incentivized contact over power and produced plenty of baserunners and scoring. But when fielding improved and the restrictions on pitchers’ deliveries were removed, it became increasingly difficult to string hits together into runs. Baseball rule-makers repeatedly tinkered with the rules to curb this trend, but these efforts were of no lasting avail. Even in 1893, when the pitcher’s box was replaced by a more distant pitching rubber, the resulting scoring explosion petered out before the end of the decade, as bigger, harder-throwing pitchers replaced the old ones. Rather than devising strategies to open up scoring, managers doubled down on the old strategies and emphasized run prevention and squeezing the most out of their own scoring opportunities. While this led to some good, exciting baseball, these old tried-and-true strategies were suboptimal for scoring runs in an environment where defenses converted 70 percent of balls in play into outs.
When Babe Ruth started breaking home run records in 1919, the paradigm shifted dramatically. The success of Ruth’s Yankees in the 1920s spawned imitators who swung for the fences, even at the risk of whiffing or popping the ball up. The bottom line is that teams that adopted the new paradigm scored more runs. Baseball’s evolution has continued to move inexorably from small ball to long ball since the 1920s. We are now in an environment where the long-ball paradigm may be reaching its natural limit, as strikeouts skyrocket and balls in play decline. Another adjustment or recalibration may loom ahead: perhaps the resurgence of some small-ball strategies, perhaps enforcement of limits on the seemingly endless supply of hard-throwing relievers, or perhaps something entirely new.
DAVID J. GORDON is a native Chicagoan who grew up in the 1950s within earshot of Wrigley Field. After graduating from the University of Chicago, he moved to Chevy Chase, Maryland, and spent 43 years in public health and biomedical research at the National Institutes of Health. In retirement, he has come full circle to write a historical book on major league baseball and its greatest players. Dr. Gordon is married (Susan) and has two adult children (Sam and Emily).
Notes
1. “Deadball Era,” Baseball-Reference.com, https://www.baseball-reference.com/bullpen/Deadball_Era.
2. All player and MLB average statistic are taken from Baseball-Reference.com, https://www.baseball-reference.com/.
3. Zachary D. Rymer, “The Evolution of the Baseball From the Dead-Ball Era Through Today,” Bleacher Report, June 18, 2013, https://bleacherreport.com/articles/1676509-the-evolution-of-the-baseball-from-the-dead-ball-era-through-today; “Spitball,” Wikipedia, https://en.wikipedia.org/wiki/Spitball, accessed September 11, 2018; Don Jensen, “Ray Chapman,” SABR Biography Project, https://sabr.org/bioproj/person/c2ed02f9.
4. Play Index, Baseball-Reference.com, https://www.baseball-reference.com/play-index/ Queries: IPHR — https://www.baseball-reference.com/play-index/event_finder.cgi?request=1&year=2017&year_to=2017&divisory=1&from=button&type=b&event=23&criteria138=hit_location—IPHR-8—to_Location_IPHR%408—locat&criteria139=hit_location—IPHR-7—to_Location_IPHR%407—locat&criteria140=hit_location—IPHR-9—to_Location_IPHR%409—locat. ROE: https://www.baseball-reference.com/play-index/event_finder.cgi?request=1&year=2017&year_to=2017&divisory=1&from=button&type=b&event=18. Play-By-Play Coverage: https://www.baseball-reference.com/about/coverage.shtml
5. Diane Firstman, “The Growth of ‘Three True Outcomes’: From Usenet Joke to Baseball Flashpoint,” Baseball Research Journal 47, no. 1 (Spring 2018), https://sabr.org/research/growth-three-true-outcomes-usenet-joke-baseball-flashpoint#_edn1.
6. Bill James, The New Bill James Historical Baseball Abstract, (New York: Free Press, 2001), 8–12.
7. “Baseball Rule Change Timeline,” Baseball Almanac, http://www.baseball-almanac.com/rulechng.shtml. Accessed September 11, 2018.
8. Eric Miklich, “The Pitchers Area,” 19th Century Baseball, http://www.19cbaseball.com/
9. egdcltd, “Baseball Glove History and Evolution,” InfoBarrel Sports, December 21, 2011, http://www.infobarrel.com/Baseball_Glove_History__Evolution .
10. John Thorn, “Why Did the Baseball Glove Evolve So Slowly?” Our Game, June 9, 2014, https://ourgame.mlblogs.com/why-did-the-baseball-glove-evolve-so-slowly-bff30f33737a.
11. David Fleitz, “Cap Anson,” SABR Biography Project, https://sabr.org/bioproj/person/9b42f875.
12. Doug Skipper, “Willie Keeler,” SABR Biography Project, https://sabr.org/bioproj/person/074d42fd.
13. “WAR Explained,” Baseball-Reference.com, https://www.baseball-reference.com/about/war_explained.shtml.
14. “Hall of Fame Explorer,” National Baseball Hall of Fame, https://baseballhall.org/explorer. Accessed September 11, 2018.
15. “1906: The Hitless Wonders,” This Great Game, http://www.thisgreatgame.com/1906-baseball-history.html.
16. Rymer, “The Evolution of the Baseball.”
17. Allen Wood, “Babe Ruth, SABR Biography Project, https://sabr.org/bioproj/person/9dcdd01c.
18. Leonard Koppett, Koppett’s Concise History of Major League Baseball (New York: Carroll & Graf, 2004), 49.
19. “Year-by-Year Top-Tens Leaders and Records for Home Runs,” Baseball-Reference.com, https://www.baseball-reference.com/leaders/HR_top_ten.shtml. Accessed September 11, 2018.
20. Mark Armour, “Gaylord Perry,” SABR Biography Project, https://sabr.org/bioproj/person/f7cb0d3e.
21. Warren Corbett, “Earl Weaver,” SABR Biography Project, https://sabr.org/bioproj/person/0cfc37e3.