

Home Runs: More Influential Than Ever
This article was written by J.P. Caillault
This article was published in 2002 Baseball Research Journal
The baseball media have made a lot of noise the past two seasons about how baseball’s home run explosion possibly reached its zenith in the 2000 season, since the number of home runs per game in the 2001 and 2002 seasons was lower than in 2000.
Even the number of runs scored per game was lower, too. Batting averages, on-base percentages, and slug-ging percentages all declined; ERAs did, too. The new, larger strike zone had contributed to the leveling of the playing field between batters and pitchers. Or so the story went.
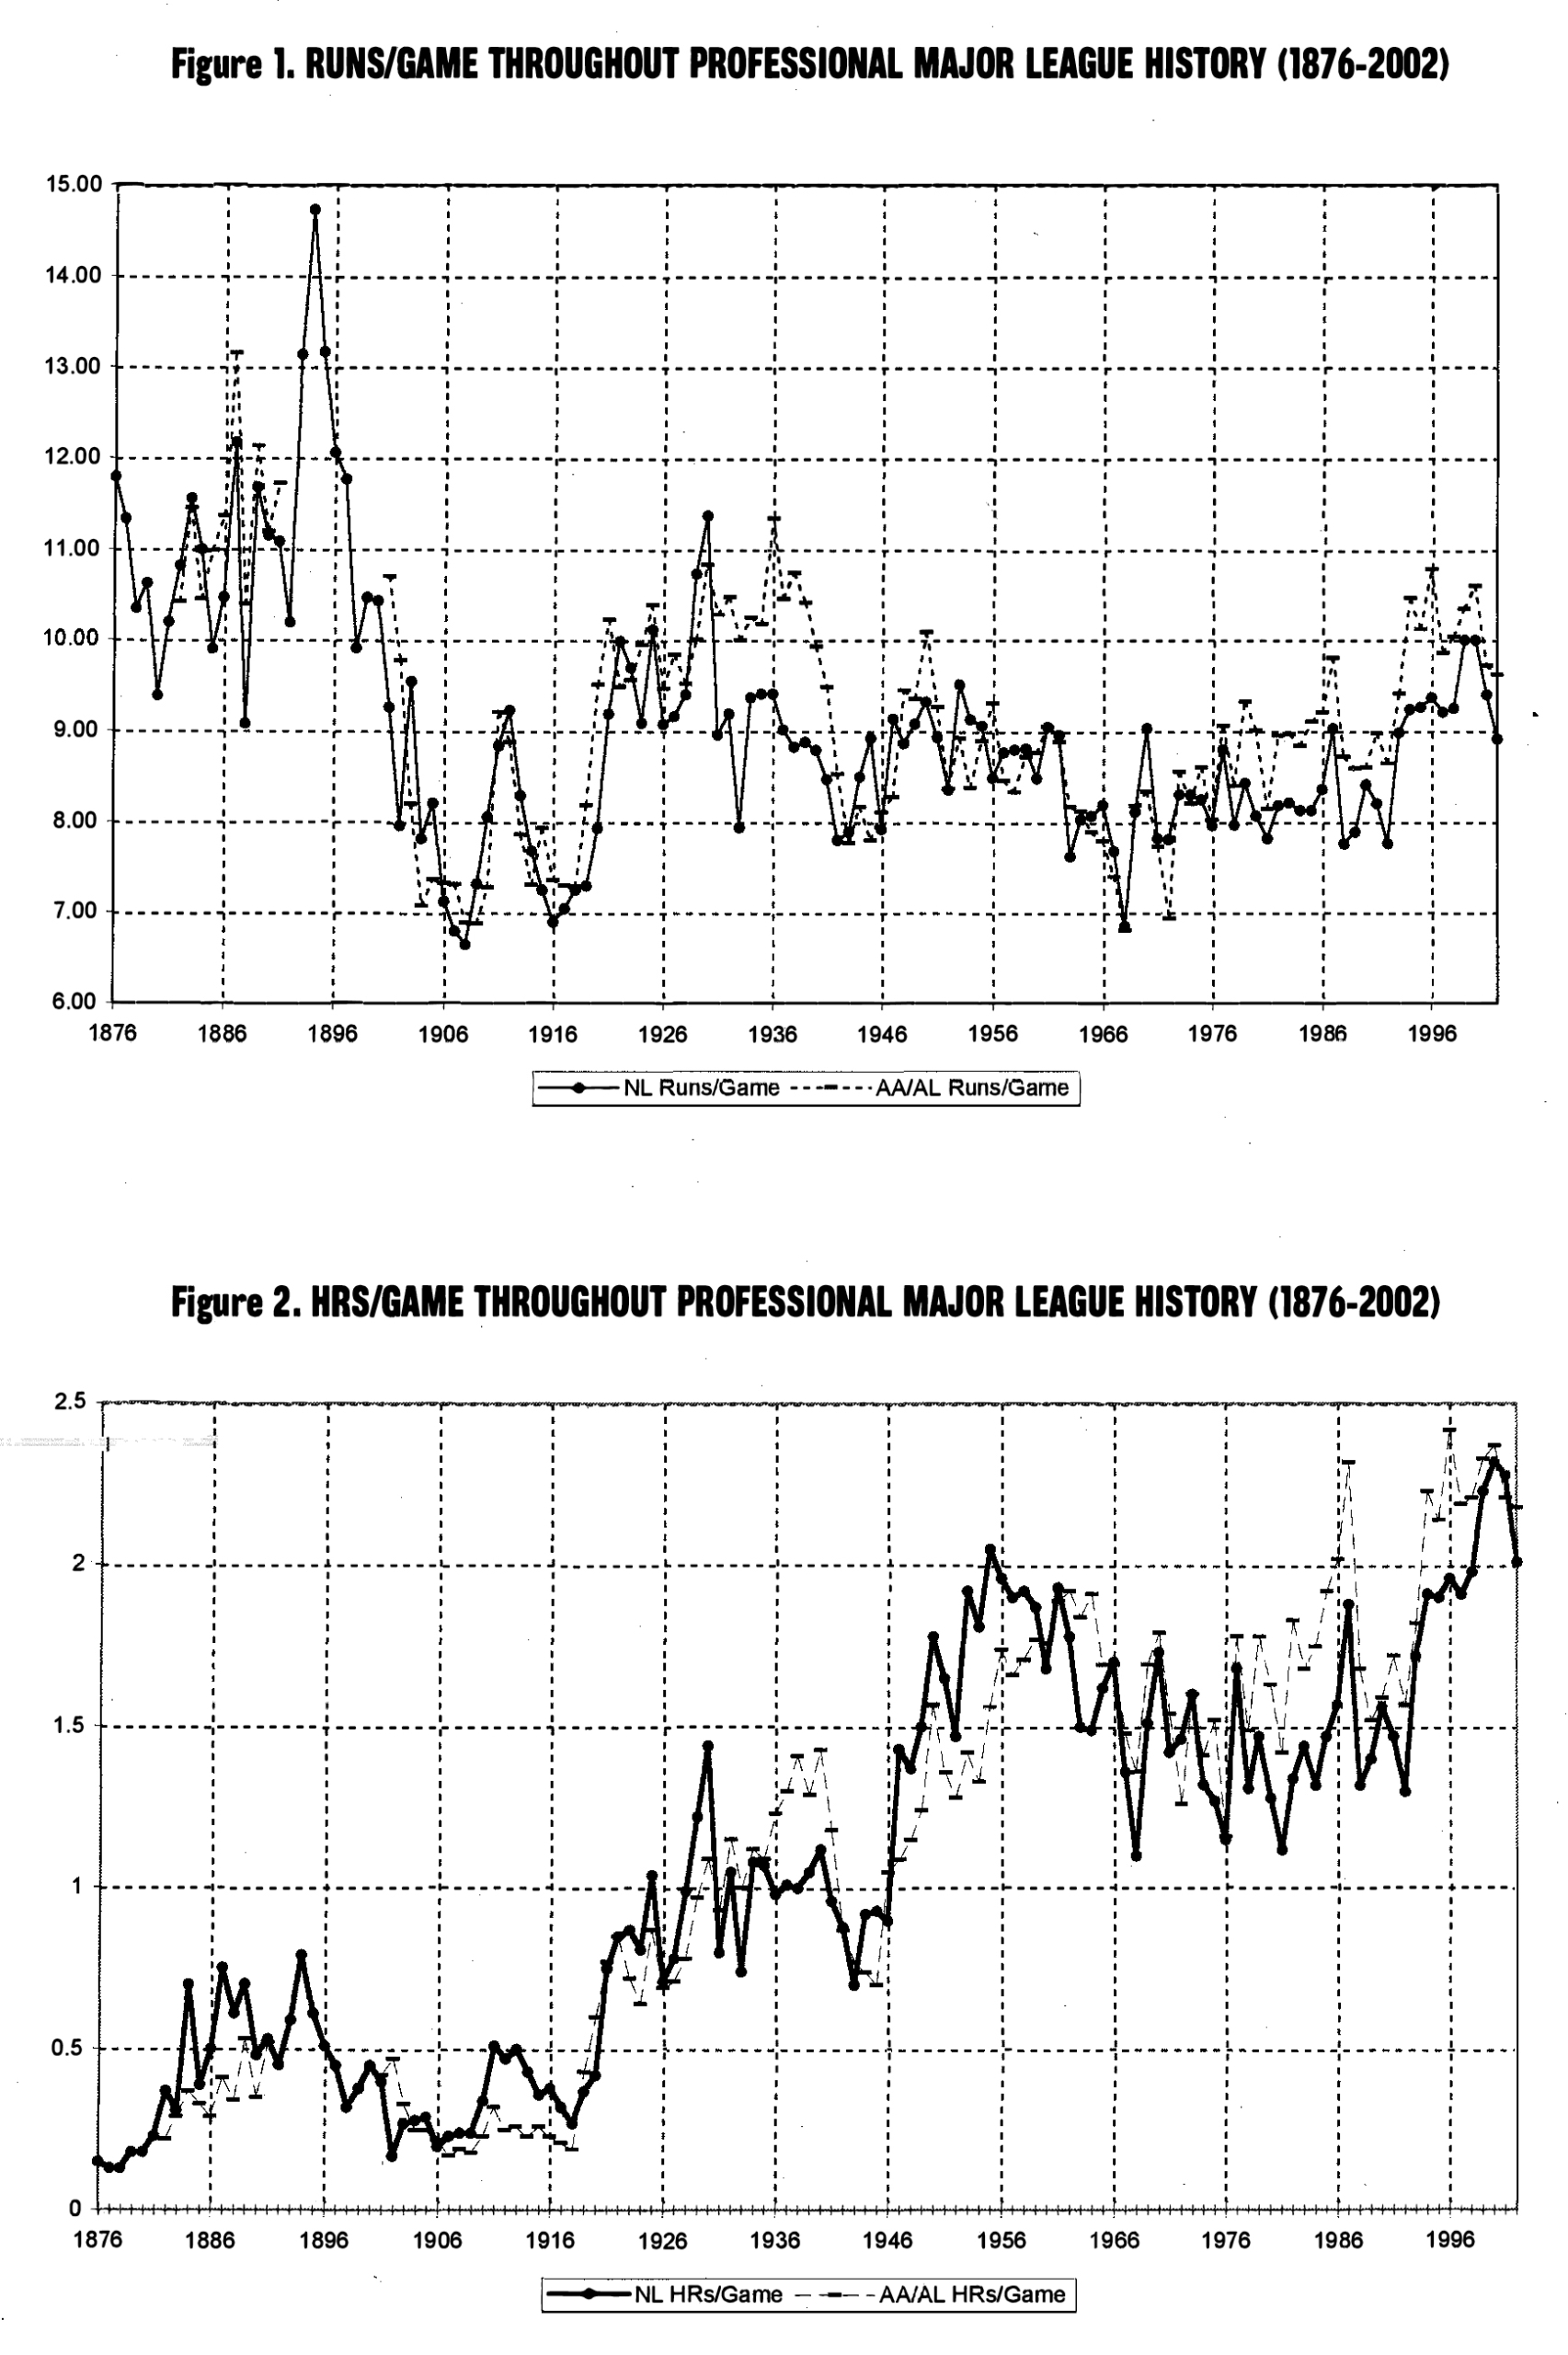
But although all those things occurred, they didn’t convey the larger truth-that the influence of home runs continued to increase, as it has for most of the last 100 years. A plot of the number of runs scored per game in each league as a function of year is shown in Figure 1 (statistics from the Union Association-1884; the Players’ League-1890; and the Federal League-1914-15, are not included in any of the Figures used in this article. None of those leagues existed long enough to contribute in a meaningful way to the long-term trend discussed).
Image
There has been quite a bit of fluctuation over the 127-year history of major league baseball, with runs scored per game varying by roughly a factor of two from its liveliest years (the mid-1890s) to its deadest era only 15 years later (the late-1900s). And the variation has been anything but monotonous.
The first decade and a half (1876-1892) fluctuated wildly, with changes from year to year sometimes as large as 33%. For example, National League and American Association teams were scoring more than 12 and 13 runs per game, respectively, in the high-scoring 1887 season, then declined to the 9 and 10 run per game range the following season, 1888. And then they bounced back to around 12 runs per game in the very next season, 1889!
After the American Association folded (following the 1891 season), the NL saw higher and higher scoring games for a couple of years, reaching the all-time peak of nearly 15 runs per game in 1894. But then scoring in the NL (and the American League, which came on board in 1901) tailed off nearly every year thereafter until it reached its nadir of about 6.5 runs per game in 1908. Then a steady rise for four years, followed by a steady decline for four. That was followed by the climb back to about 10 runs per game that was reached in the early 1920s. The AL and the NL parted ways in the 1930s, with the AL teams scoring anywhere from one to two runs per game more than their NL counterparts during that period. Both leagues declined during the WWII years, bounced back in the 1950s, and declined again in the 1960s.
The 1970s and 1980s were pretty steady (with the AL and its DH always scoring more). Then another climb began in the 1990s, in particular 1993. And, as can clearly be seen in Figure 1, there was indeed a decline in 2001 and 2002, just as the media told us. What they didn’t emphasize, though, was that the to scoring levels in those two seasons were still higher than they’d been at almost any time during the entire 40-year period between the early 1950s and the early 1990s. And because the number of runs scored per game in the late 1990s and early 2000s is not at record high levels, many baseball people think there’s no cause for concern. In fact, many fans think high scoring is exactly what the game needs to keep it competitive with football and basketball. In terms of home runs, the whole truth is even more elusive.
Figure 2 shows a plot of the number of home runs per game in each league as a function of year. The general pattern of increase is quite obvious just from a quick glance at the figure. There are the expected peaks and valleys throughout baseball’s rich history, but it is clear that, except for the 1987 season, there have never been more home runs per game than in the last few seasons. But the media pointed to those last three pairs of data points and claimed that the tide had turned, that baseball has come to its senses and is returning to an appropriate balance between its offenses and its defenses.
However, a closer look shows that the influence of home runs has continued to grow. Figure 3 is a plot of the number of runs per home run. After a brief love affair with the home run in the 1880s and 1890s, the leagues began the deadball era In that period there were nearly 47 runs scored for every home run (1902 NL), and still as many as 15-20 when Babe Ruth, in 1919-1920, revolutionized the way the game was played. Ever since, though, the influence of home runs has been in near steady ascension (with the usual exception of the WWII years).
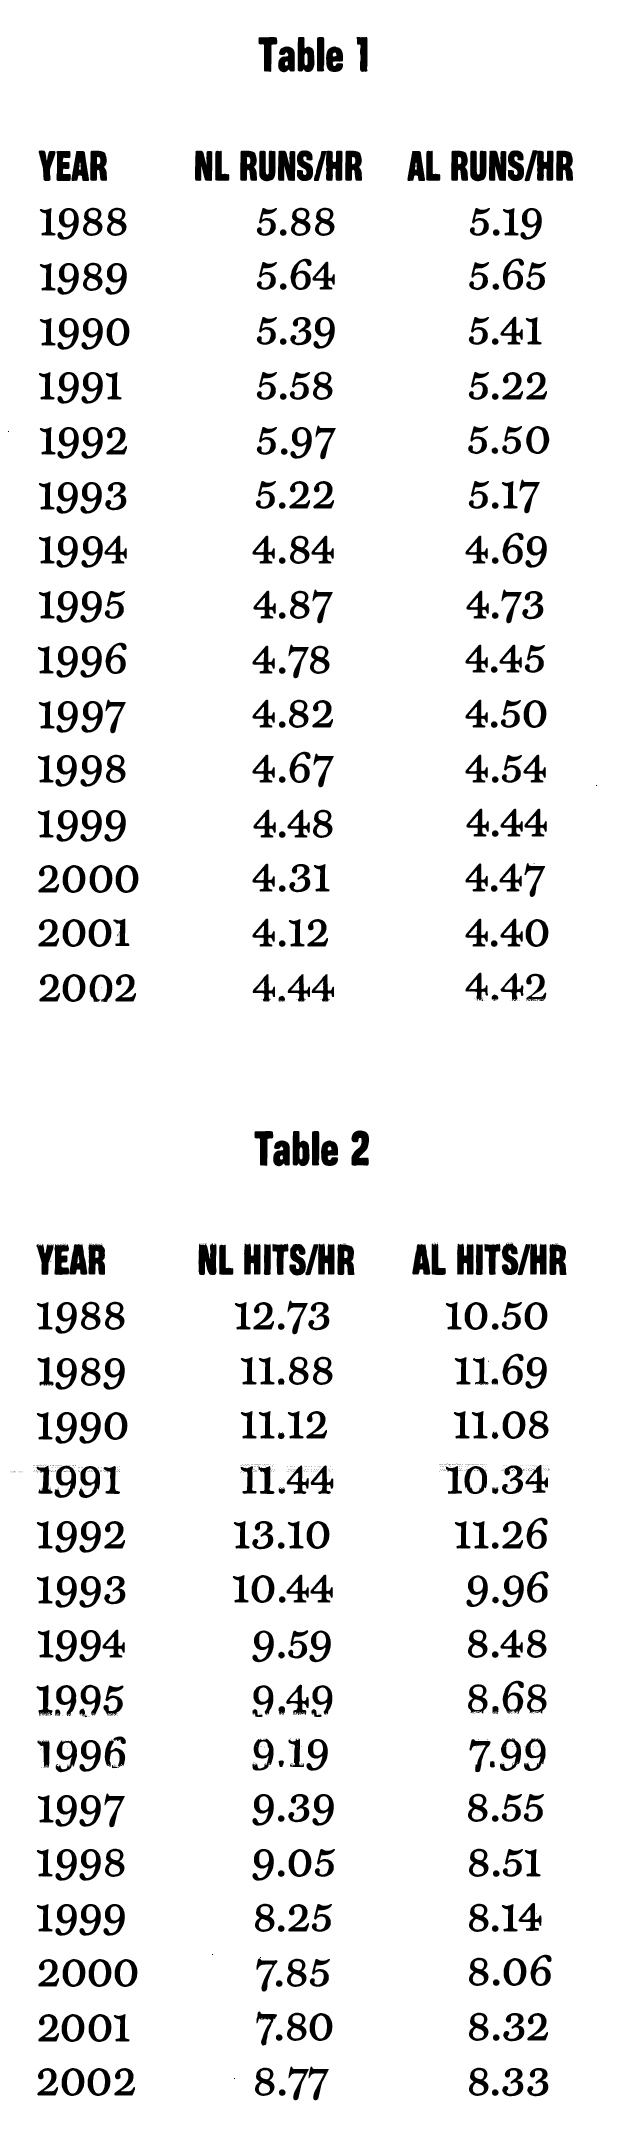
The all-time lowest number of runs scored per home run was recorded in 2001 in the National League-4.12. That number-one home run for every four runs scored-should be alarming to baseball purists. In fact, if we extrapolate from the trend in the NL the last 15 years (by using a simple least-squares linear regression program to find the best-fit straight line to the data in Table 1), then we come up with the startling conclusion that in the year 2028 the ratio of runs scored to home runs will be 1.00. Every single run scored in the NL will be the result of a home run! All other hits and walks will be meaningless!
Is this the path that baseball wants to travel? It’s analogous to saying that every basket scored in the NBA will come from a dunk or that every point scored in the NFL will be the result of a 50-yard TD pass. Those plays, like home runs, are exciting, but only because they don’t happen too often.
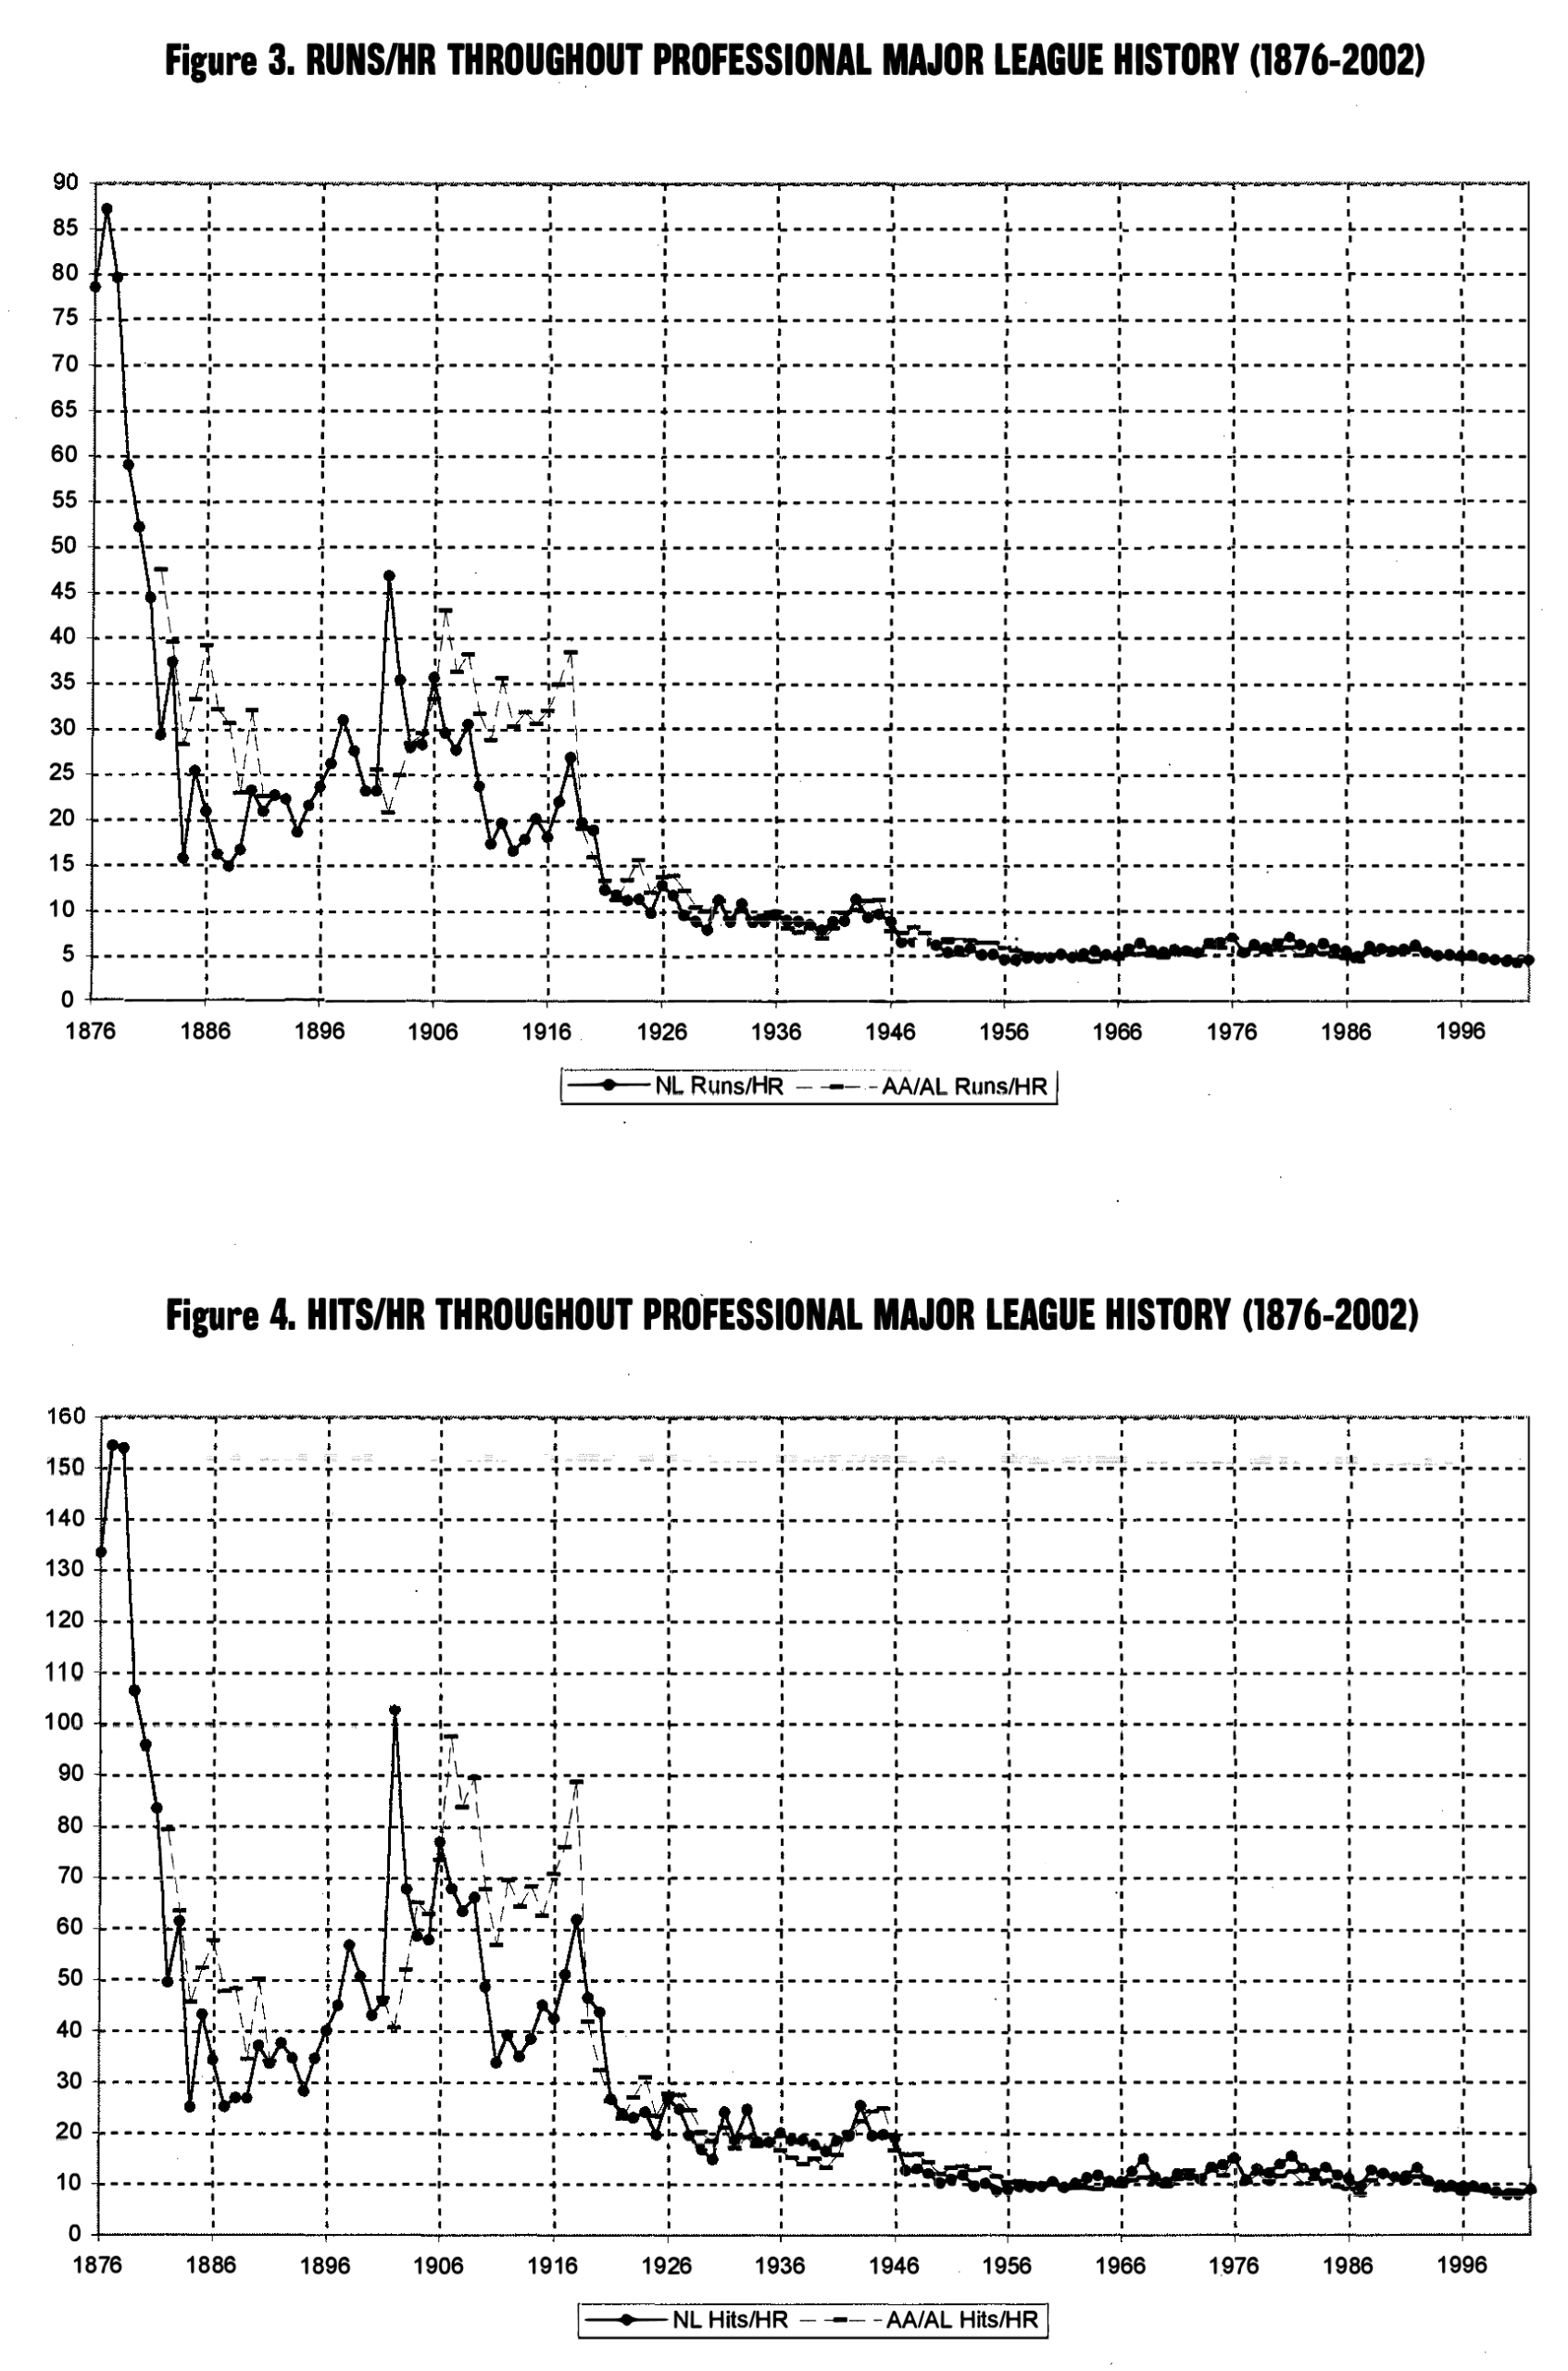
Can the trend shown in Figure 3 be supported by any other numbers? Yes. The history of the ratio of hits per home run is plotted in Figure 4. The plot looks nearly identical to Figure 3, indicating a steady increase in the fraction of hits that are home runs. An extrapolation of the NL’s previous 15 years’ worth of hit/HR ratios (see Table 2), similar to that described above for the ratio of runs/HR, leads to the frightening conclusion that every hit in the NL will be a home run by the year 2021! This hypothetical scenario is even more alarming than the one stated in the preceding paragraph because there wouldn’t even be singles, doubles, or triples to break the monotony. It would be the equivalent of bringing the outfield fences in so close that they’d be right behind the infield. (The trends in the American League are not as severe as those in the NL, but they trail the NL only by about a decade — 2038 and 2028 would be the corresponding years for the AL to reach these freak show situations.)
I realize that these extrapolations are extremely unlikely to happen. But the mere fact that the numbers point in this direction should be enough to cause baseball’s bigwigs to rethink their love affair with the home run before it’s too late, before baseball becomes all too predictable and a mere shell of its former exciting and unpredictable self.
JEAN-PIERRE CAILLAULT is a Professor of Astronomy at the University of Georgia. He has taught classes on the physics and the history of baseball, published articles in Baseball Digest, and is the author of the forthcoming A Tale of Four Cities: Nineteenth Century Baseball’s Most Exciting Season; 1889, in Contemporary Accounts.