Mark McGwire’s 162 Bases on Balls: More Than One Record in 1998
This article was written by John F. Jarvis
This article was published in 2000 Baseball Research Journal
In addition to setting the major league single season record with his seventy home runs in 1998, Mark McGwire set a National League record with 162 bases on balls. This tied him with Ted Williams, who did it twice (1947, 1949), for second on the major league single season list behind Babe Ruth’s 170 in 1923. In each of these four seasons, the leader in walks was also the season home run leader.
Twenty-eight of McGwire’s bases on balls were intentional (IBB). In this category he was one behind the 1998 major league leader, Barry Bonds. Bases on balls that aren’t official “intentionals” will be referred to as unintentional bases on balls (UBB) in this article.
Besides IBBs, there is the much commented on practice of pitching around a strong hitter. That is, the pitcher doesn’t officially give an IBB but doesn’t give the hitter any legitimately good pitches either. There is no serious attempt to get the hitter out and a UBB usually occurs. How many of his UBBs are pitching-around BBs?
Being hit by a pitch (HP) can be considered to be a very intentional base on balls. McGwire was hit an unremarkable six times during the 1998 season. Jason Kendall, the season leader in the HP category was hit 31 times.
McGwire’s 70 home runs came in just 509 at bats, a rate of one homer every 7.3 at bats. Obviously, McGwire’s 162 walks cost him a lot of at bats. While UBBs are an inevitable part of the game, the intentional variety purposely prevents hitting. A measure of opportunities for hitting lost through “intentional” passes can be estimated by adding the fraction of his 134 unintentional UBBs that represent pitching around to his 28 IBBs. Of course, this requires identifying pitching-around UBBs.
According to TV play-by-play announcers, an IBB is usually indicated (managers don’t seem to do this as often as the game announcers suggest they should) any time there is a runner on second and none on first. In actuality the IBB tactic is employed in a somewhat more subtle manner than this. IBBs given outside of well-defined tactical situations could be called gift BBs. Another question that arises is how many of McGwire’s official IBBs came in situations where tactics wouldn’t suggest one?
If managers use the IBB in a consistent way and if there are not an excessive number of pitching-around BBs, various statistical pattern recognition methods can be used to create a classifier that labels each situation as matching an IBB tactical situation or not. The actual event is known and is not subject to being changed. Only the situation in which it occurs, the context for the event, is being classified. The particular statistical tool that seems most appropriate for this task is the neural net (Neural Networks, Laurene Fausett, Prentice Hall, 1994). While the term neural network suggests artificial intelligence or other exotic techniques, it is a well-defined statistical procedure that uses standard numerical computations.
Creating a neural net requires determining a list of events—UBBs and IBBs—and the game situation—event context—in which they occur. This list becomes the input to the neural net training procedure. The training procedure adjusts its internal numerical coefficients to minimize the mismatches between its output and the actual events recorded in their contexts.
Using the Retrosheet, Total Sports and Gary Gillette/Pete Palmer play-by-play accounts for 1979- 1999, I tabulated all UBB (266,062), IBB (26,557) and HP (20,051) events and their contexts. I noted: inning, outs, runners on base, relative score, player receiving the pass and player following the pass. Relative score is the difference between the offensive team and defensive team runs at the time of the event. Batting ability is given by a recent at bats slugging average.
I formed neural net training sets by taking all recorded IBBs and a similar number of UBBs chosen at random from all the available events. I did not use HPs in the training process. Once the neural net has been trained, it can be used to classify the context in which a particular event occurred.
For those technically inclined, the neural net used is a standard two layer perceptron back propagation trained net with one layer of hidden units. Eight input units are used (corresponding to each parameter in the recorded context where each base is presented separately) and nine hidden units are used. A hidden unit is a weighted sum over the input unit values plus a constant. The result of the hidden unit sum is passed through an activation function to generate its output. The activation function in this case is sigmoidal, having asymptotic values of +1 and -1 and a slope of 1.0 at x=o. The output unit is a sum of a constant term and the weighted outputs of the hidden units. Subjecting the output unit sum to the same activation function completes the neural net calculation. This neural net requires ten times the computation of evaluating a linear regression equation for the same number of input parameters in addition to the activation function evaluations. An iterative training procedure determines the coefficients in the neural net by minimizing the sum of the squared error between the output and given value for all the events in the training set. This neural net contains 91 coefficients which, unlike a linear regression formula, do not have an interpretation in terms of the input parameters.
When presented with a particular game context, the trained neural net generates a number between +1, most IBB, like and -1 which is most BB, like. I set the decision point in declaring a particular context UBB or IBB midway between the average of the neural net output values for the training set IBB event contexts and the average of the UBB event neural net outputs. Repeating the training using other randomly chosen groups of BBs produces essentially the same results. Splitting the data by league or decade (’80s and ’90s) also produces equivalent results.
We can assess the relative importance of each parameter in the event context for determining if an IBB should be offered can be assessed by training eight additional neural nets, each with one of the eight input parameters not used. We rank the importance of each data item by how much the accuracy of the neural net is degraded by its absence. Using this procedure, the ranking of the data items from most to least important is: a runner on second, a runner on third, a runner on first, the relative score, the inning, the number of outs in the inning, the slugging average of the batter following the event, and, finally, the slugging average of the batter receiving the IBB. This ordering is largely confirmed by correlation coefficients calculated from the same data (Table 1). The relative unimportance of hitting prowess is surprising. Still, there is some vindication in this for my single-minded announcer.
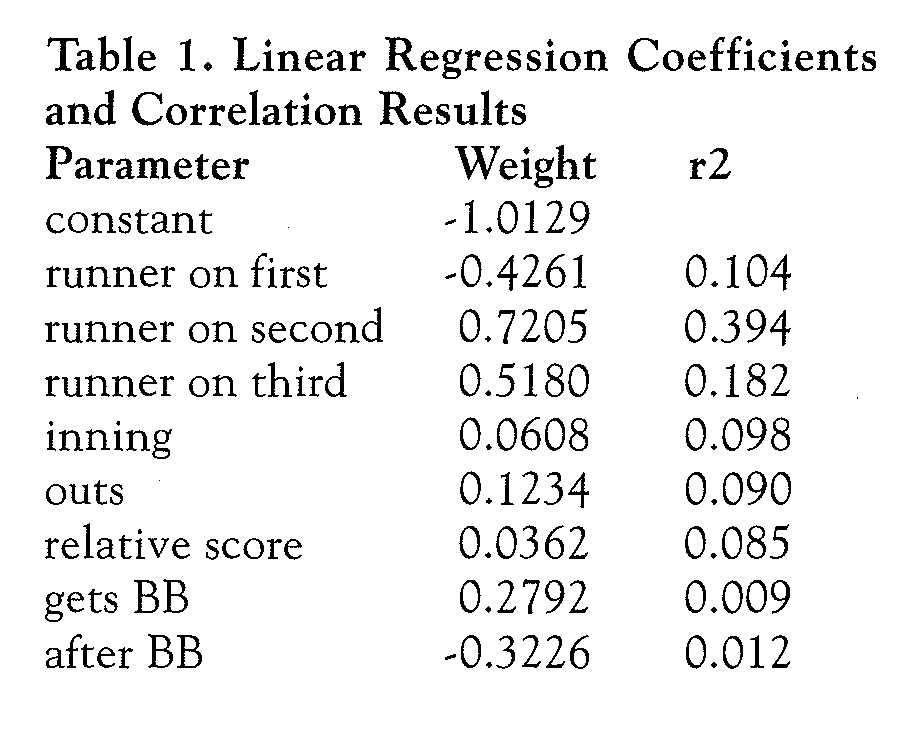
Linear regression can be used in a way equivalent to the neural net to classify UBB/IBB situations. A linear regression done on the same data yields the results given in Table 1. Also included in Table 1 are the correlation coefficients between the input parameters and the UBB/IBB values. In the regression, bases have the value 1 if a runner is present, and 0 otherwise. Innings are in the range 1-10, with all extra innings given the value 10. Outs have the value 0, 1, and 2. The remaining three parameters are defined as for the neural net.
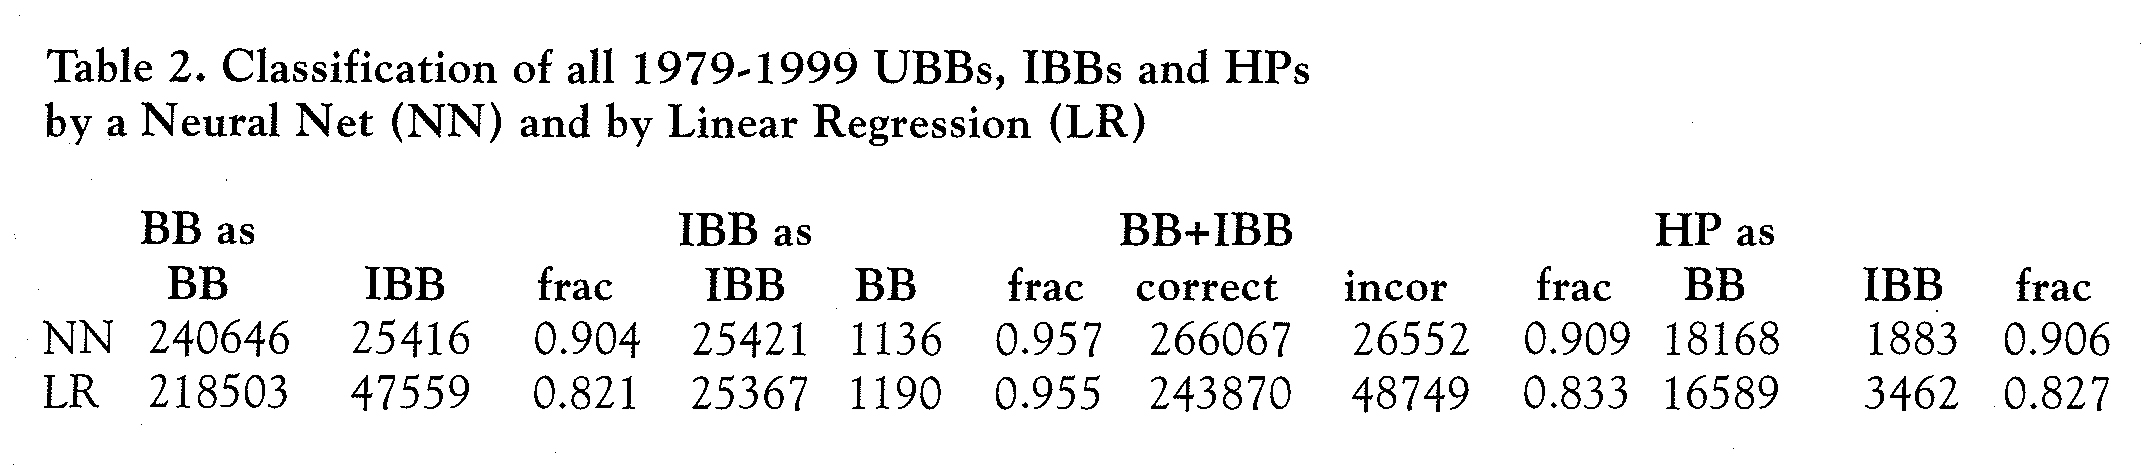
Table 2 compares the classification results of the neural net and linear regression on all the 1979-1999 data. The neural net reduces misclassifications by thirty-eight percent compared to the linear-regression-based classifier.
Players in Table 3 were selected because they were season leaders in BB, IBB, HP, or HRs and are ordered by total BBs. McGwire, of course, was the HR and BB season leader. Jason Kendall was the 1998 leader in HPs with 31. Andres Galarraga was tied for second in HP. Sammy Sosa was second in season home runs. Barry Bonds, Ricky Henderson and Frank Thomas were second, third and fourth in BBs. Bonds was the major league leader in IBBs with McGwire second in this category. Ken Griffey Jr. was third in home runs. The last line presents the totals for the eight players.
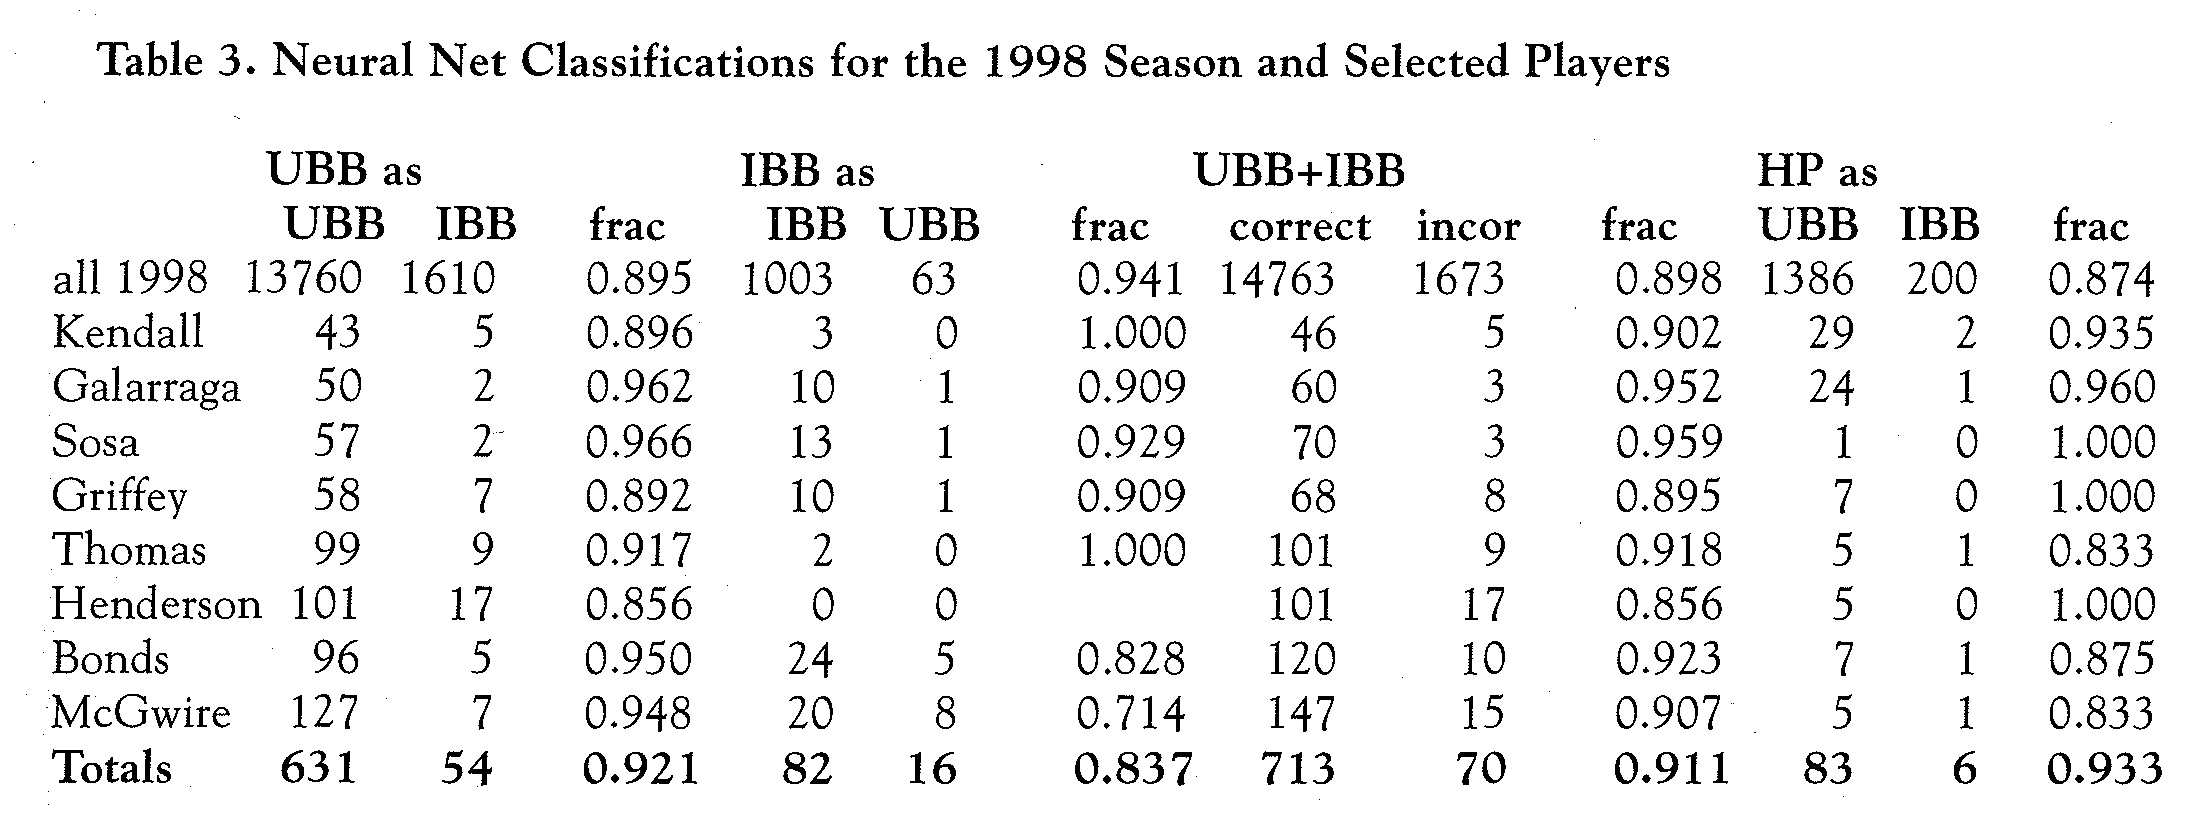
For the entire 1998 season, the neural net classifier correctly labels almost ninety percent of UBBs and ninety-four percent of IBBs. About eighty-seven percent of HP events occur in UBB situations, not greatly different than the fraction of UBBs classified as UBBs by the neural net.
The practice of pitching around a batter can be identified with UBB situations classified as IBB. Comparing the totals suggests that this occurred slightly less often for the selected players. McGwire clearly didn’t receive a disproportionate number of pitching-around UBBs. Ricky Henderson, who didn’t get any free passes either, had a slightly higher fraction of UBBs that came in IBB situations. Opposing teams will pitch carefully to Henderson, but they really don’t want him on the bases.
IBBs classified as coming in UBB situations are in the category of gift IBBs. Except for Bonds and McGwire, the selected batters as a group receive these passes at about the same rate as the league as a whole. Bonds, who received a very rare IBB with the bases loaded, and especially McGwire, are clearly in a different category, receiving many more of these gift IBBs than the season average.
The HPs received by the selected hitters classify as BBs at a slightly higher, but not statistically significant, rate than the season average. The league leaders in BBs, IBBs and home runs are not among the season leaders in HPs. There is no evidence from this small selection of players that HPs were used instead of lBBs or that they were specifically directed at the home run leaders.
The excellent agreement achieved by the neural net in classifying BB and IBB situations confirms that the IBB is given only in well-defined tactical situations, and justifies the original assumption made in the training of the neural net. The low incidence of pitching-around BBs and gift IBBs suggests that McGwire’s high BB total is more a function of his discrimination at the plate than opposing managerial intent.
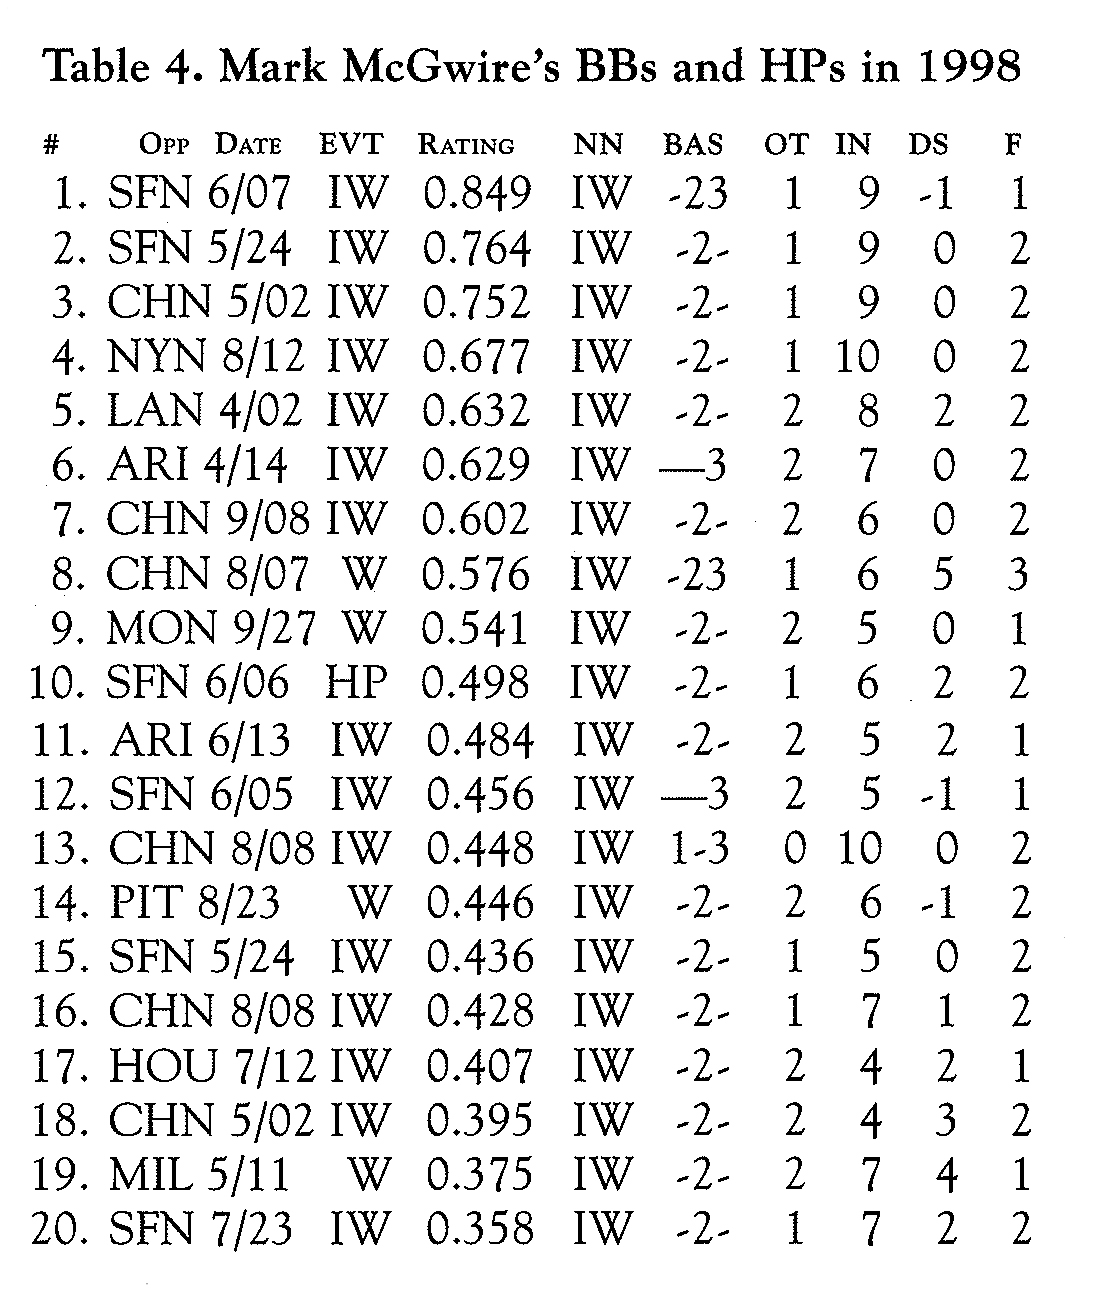
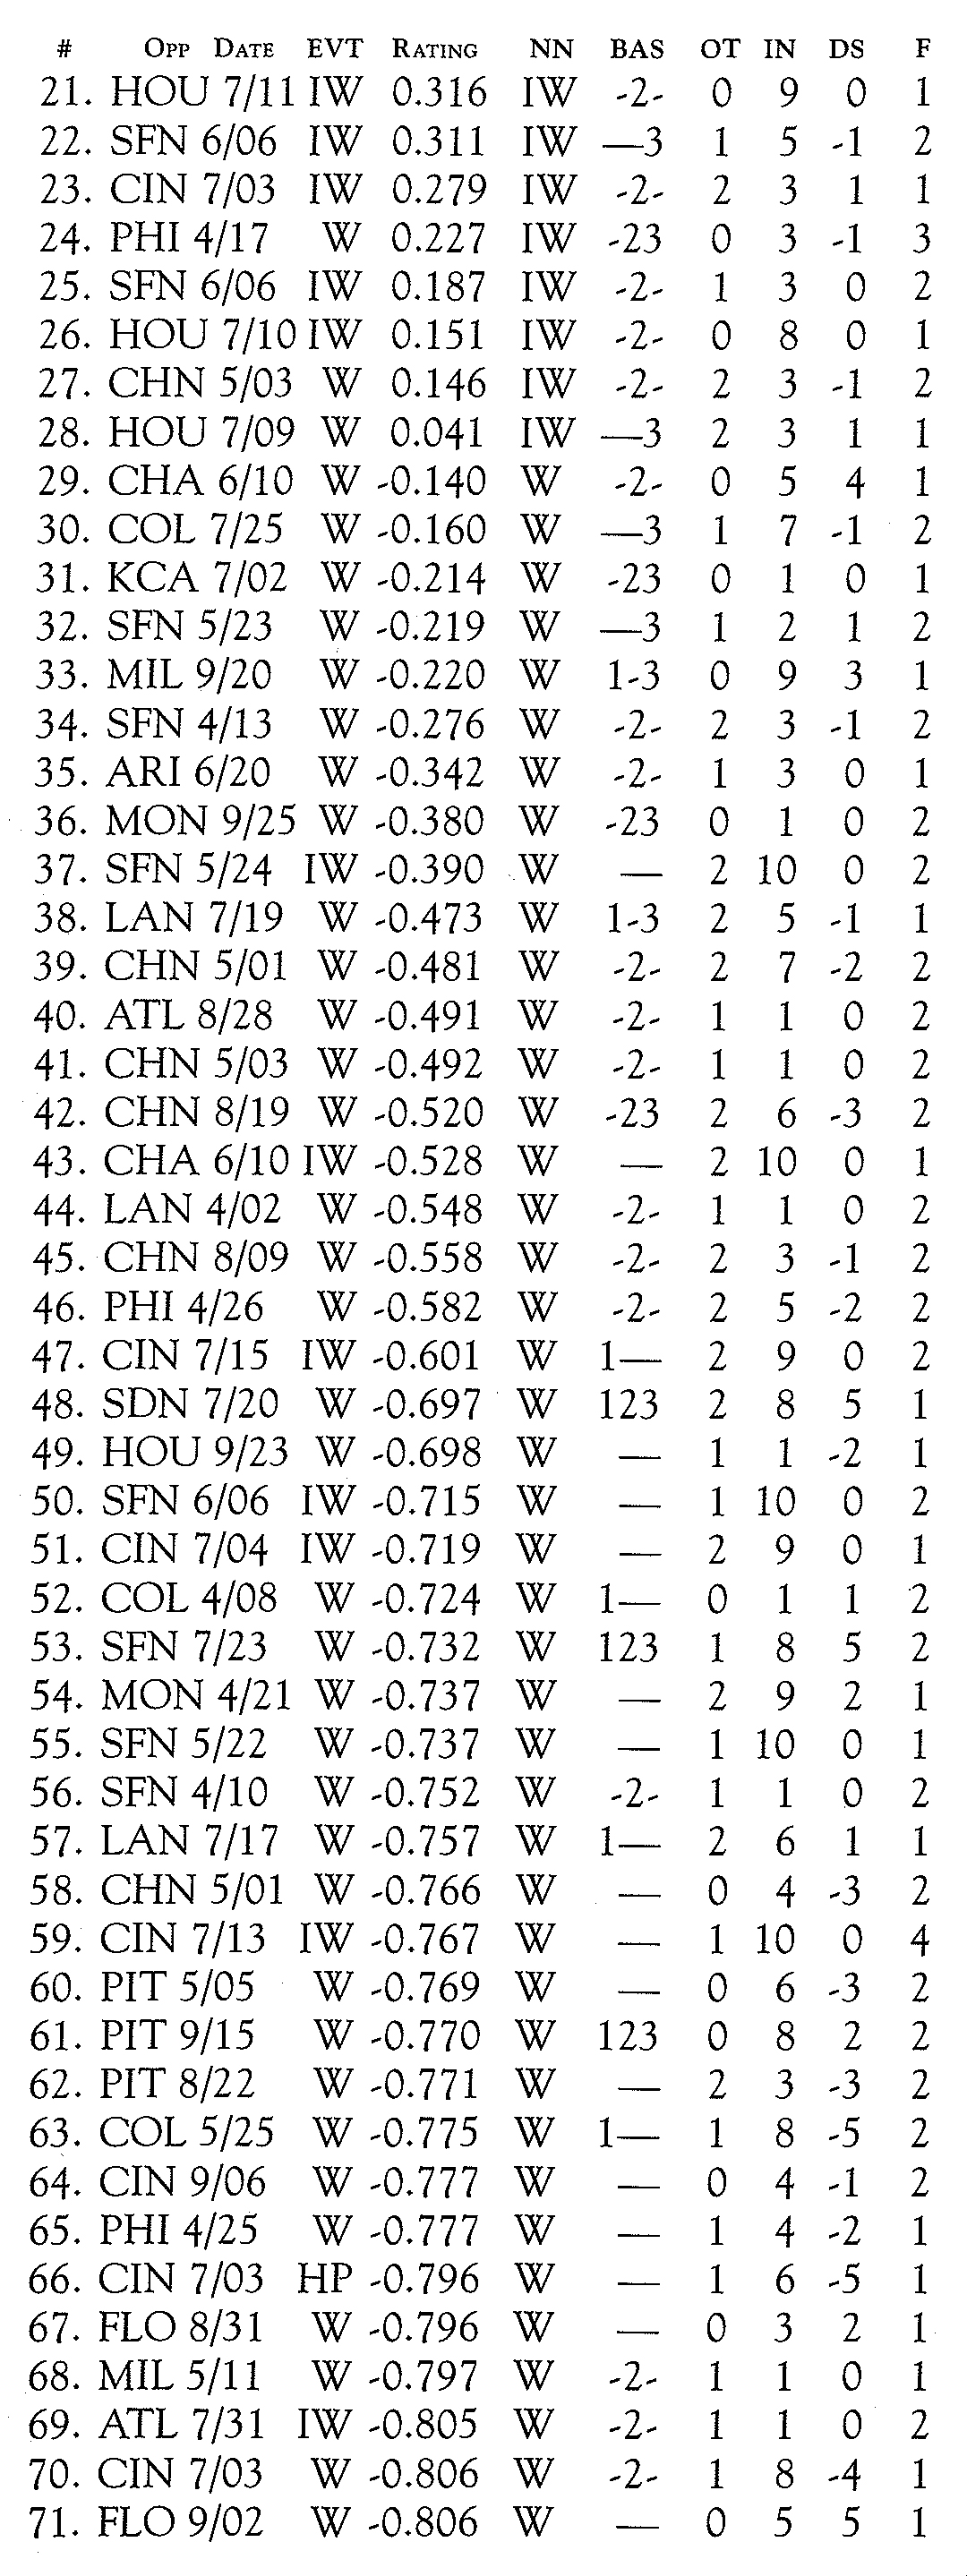
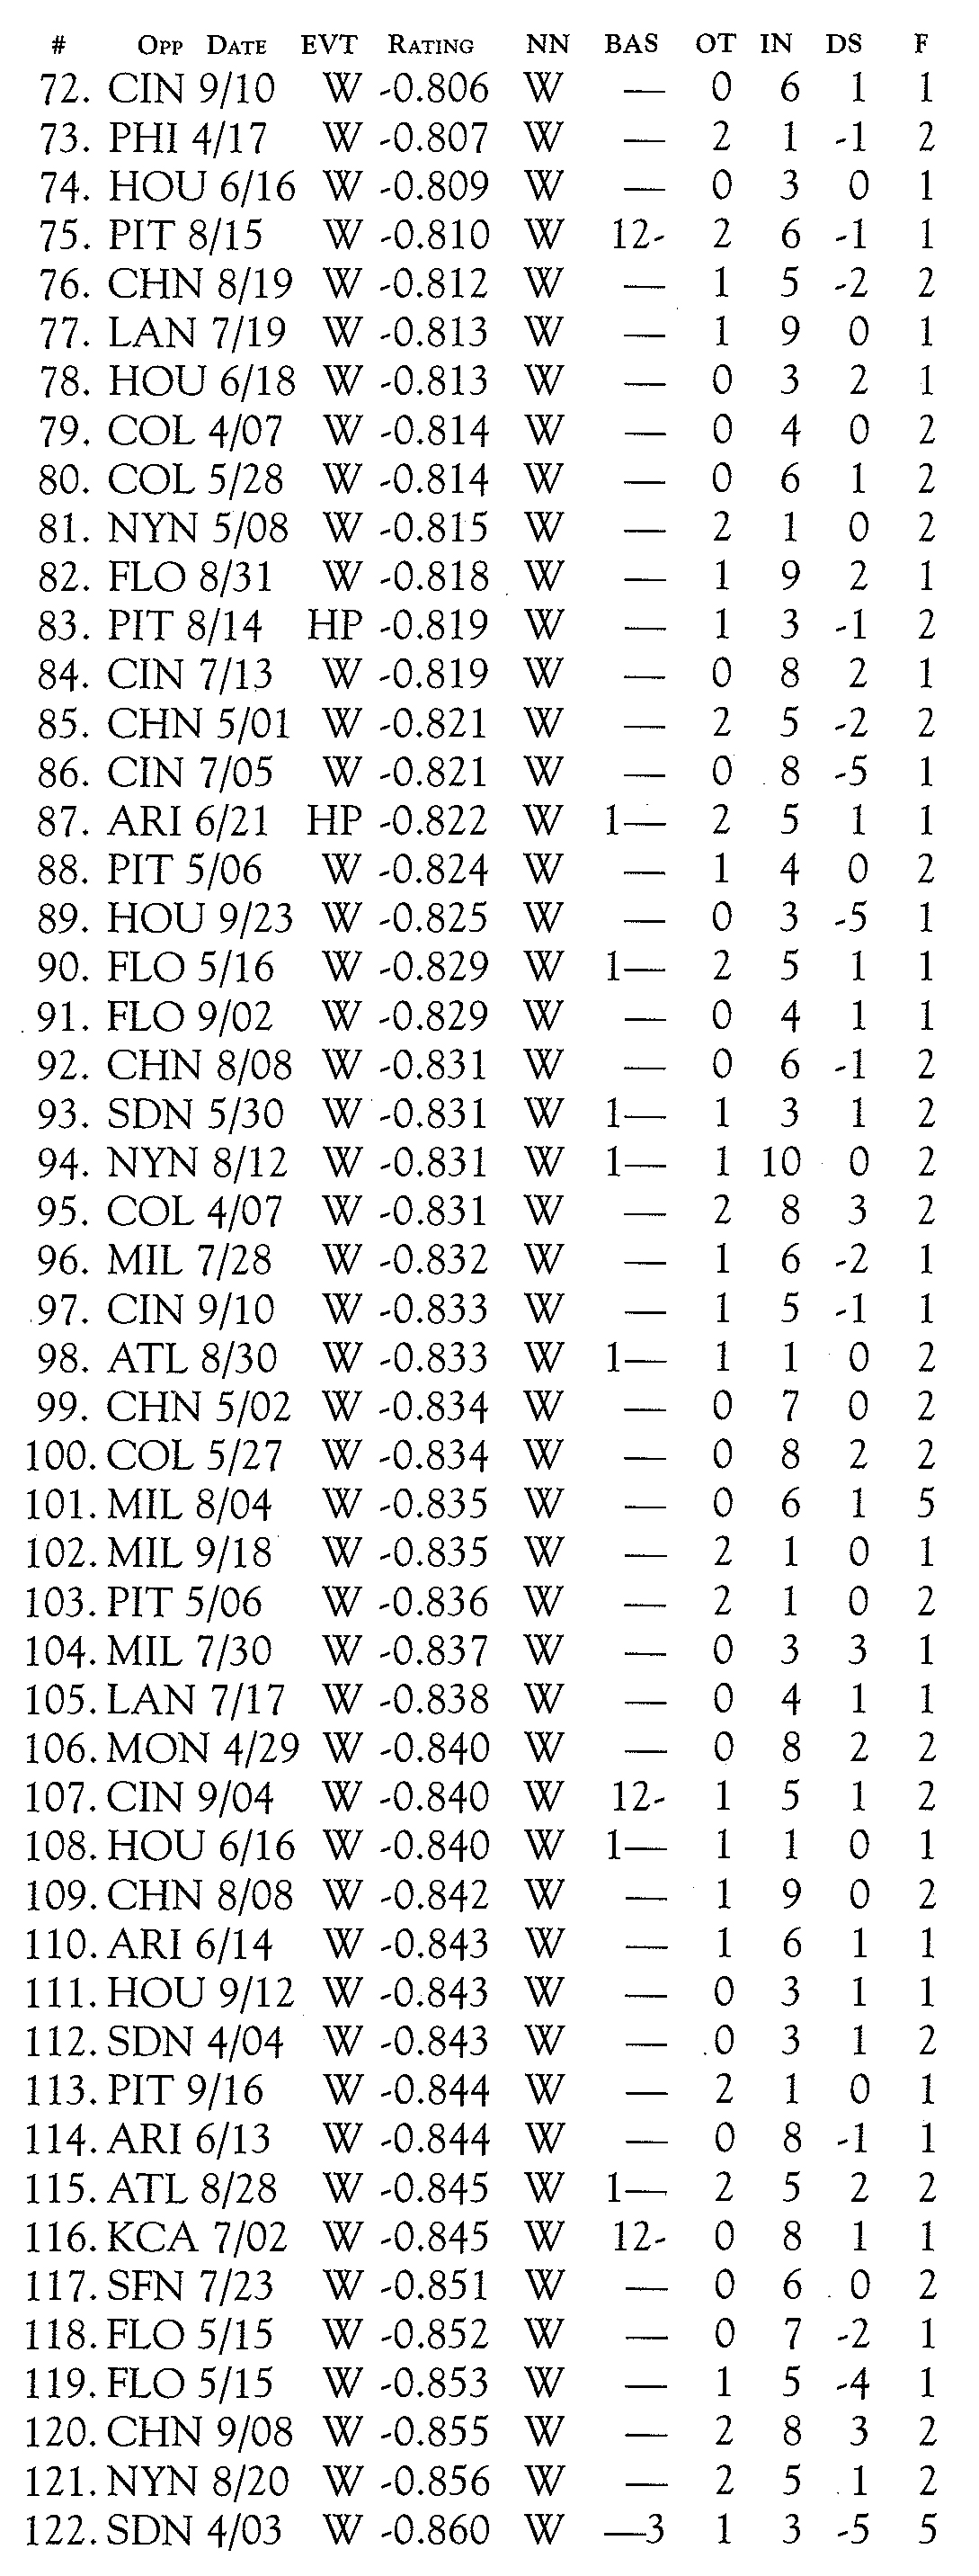
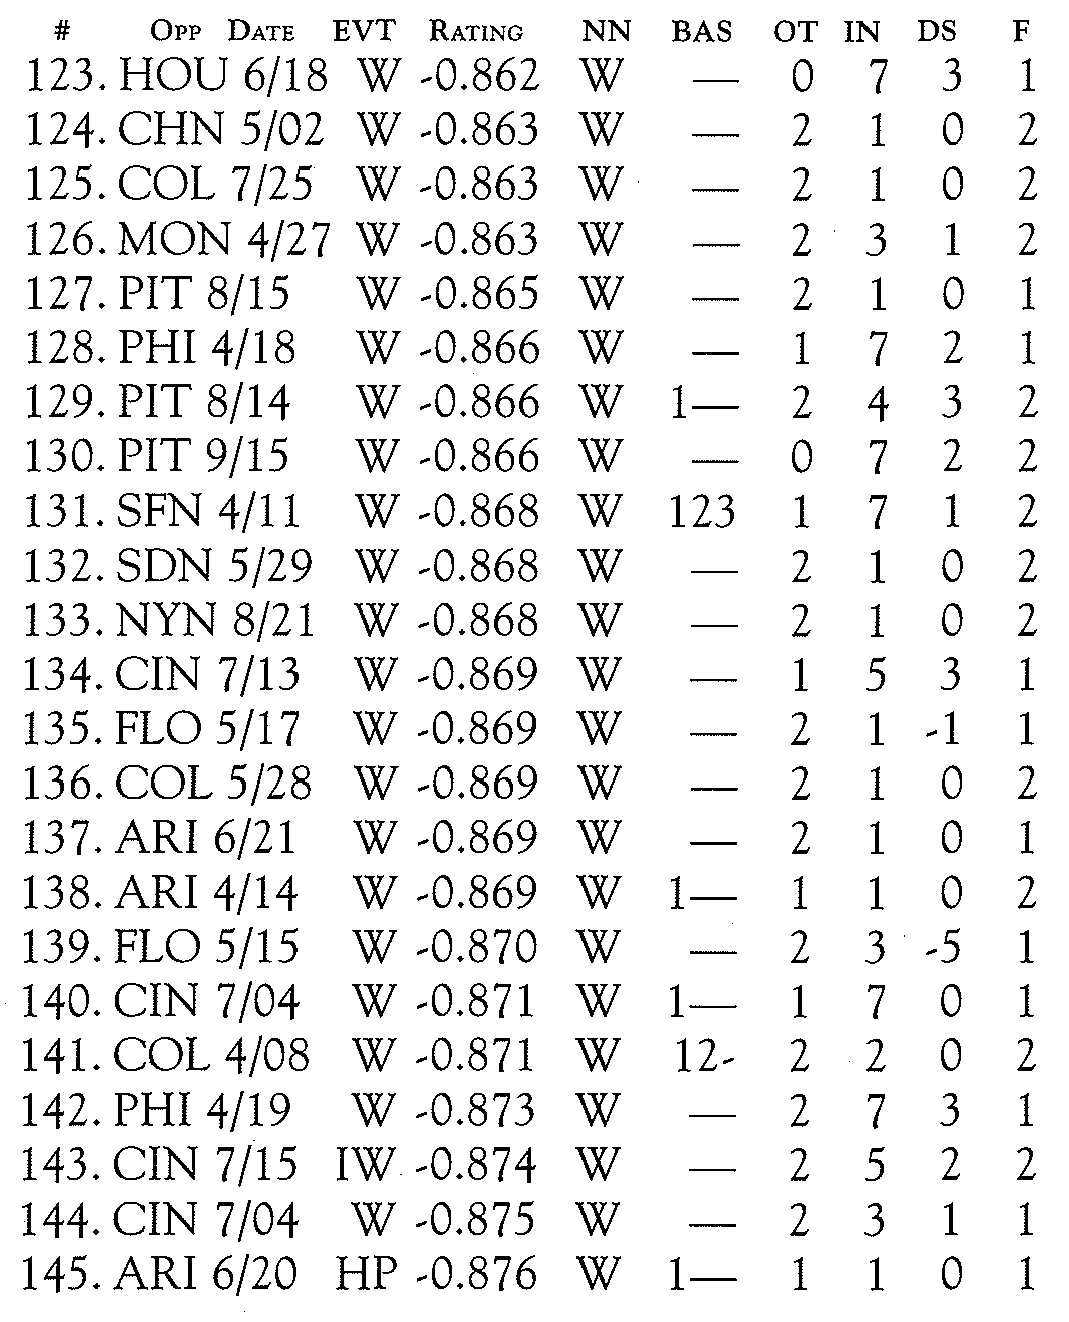
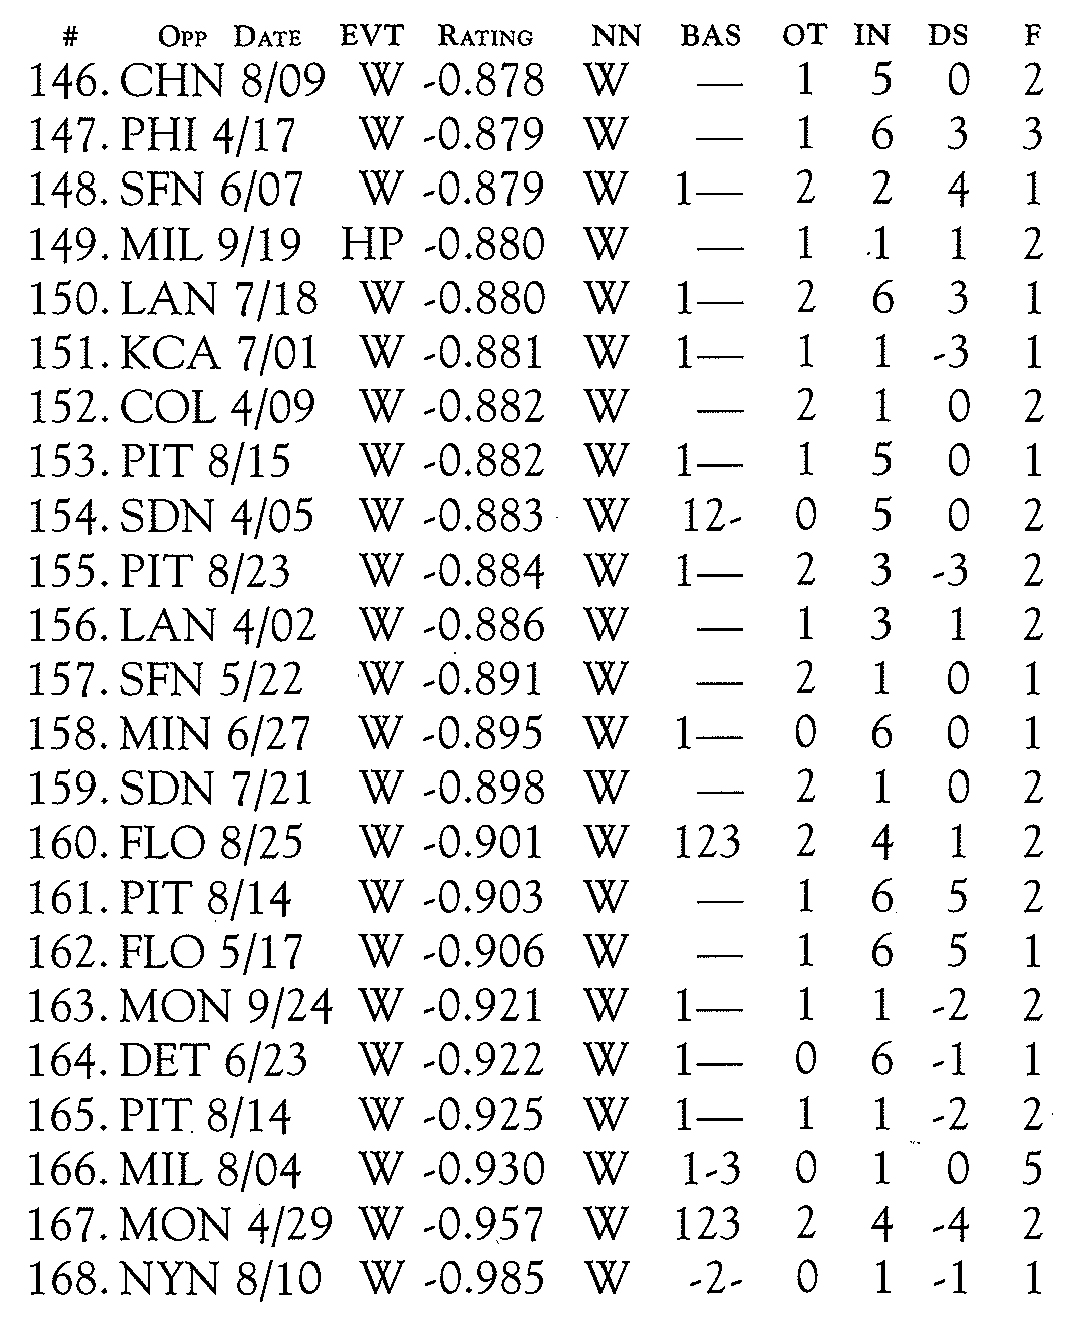
Table 4 below lists McGwire’s 162 total BBs and six HPs ordered by the neural net classification value for each event, from most IBB-like to least IBB-like. Any event context with a neural net value greater than – 0.10 is labeled IBB, in column NN. The event context parameters are part of the table providing examples of the classification power of the neural net. The table also shows there is a significant separation in the two categories. Other columns in Table 4 are OPP, the opposing team; EVT, the recorded event; Bas, runners on base; OT, number of outs in the inning; IN, the inning (with all extra innings given the value 10); DS, the difference in score between the offense and defense; and F, the index of the player following McGwire in the batting order given at the beginning of Table 4. In the player listing, Aft is the number of times he came to the plate after a McGwire UBB/IBB/HP.
Tabulating McGwire’s total BB by quarters of the season (as equally as 162 can be divided by 4) yields the following: 48, 34, 50, and 30. There is no suggestion in this that he was subject to special treatment during the later, most publicized, part of the home run record chase.
McGwire did not receive a disproportionate number of pitching-around BBs, estimated as seven by the neural net. His 28 IBBs, which is one less than the season high, include eight that came in situations where the IBB is not normally given. His HP total is comparatively low. He appears to have been given the respect all power hitters command, but there is no evidence that opponents tried to hinder him during the home run chase.
Combining McGwire’s IBBs and pitching-around BBs, those in contexts labeled IBB by the neural net, yields thirty-five events. If he had been allowed to hit, twenty-eight of these events—35 x 509/ (509+ 162-35)—could have been expected to result in ABs. At the rate he hit HRs during 1998, this would have resulted in three or four more homers.
Baseball has a rich and interesting statistical heritage. The most detailed of these statistical records are the sets of complete season play-by-play files. Using the play-by-play accounts and a powerful statistical technique, neural networks, I have shown how a subtle managerial tactic can be replicated. The resulting UBB/IBB classifier has been used to answer questions concerning the complex interaction of hitting and pitching during the exciting home run record-setting season of 1998.
JOHN F. JARVIS is an Associate Professor of Computer Science at the University of South Carolina, Aiken, and a SABR member.