
More Highly Connected Baseball Players Have Better Offensive Performance
This article was written by Jennifer Chi - Dr. Paul Beckman
This article was published in Fall 2011 Baseball Research Journal
INTRODUCTION
Social network analysis (SNA) is the mathematical examination of the interactions between individuals when those individuals intermittently come together for a common purpose. It is often used to determine the influential or important people in a large group of interacting individuals. The term “social network analysis” is somewhat of a misnomer as the interactions that are tracked are often professional activities. Mathematically speaking, each individual in the larger group is called a “node” and the interactions that connect individuals are called “edges.” After collecting data about the interactions between individuals, one can use specialized computer software to quantitatively define various measures of “connectedness” of each individual in the larger group. Obviously, a major league baseball game can be viewed as an activity that creates links between individual players. Over the course of a season or over many seasons, a great number of connections will be made by individuals who have careers that are long and/or cover many teams.
In a research project we recently completed with a graduate student, we used social network analysis to answer the question: does the level of connectivity of a baseball player correlate to their on-field professional performance? This question was prompted by our curiosity about the impact on performance of connectivity in several other fields as diverse as academic research[fn]Beckman, P. and Forsman, A. “Kevin Bacon, Degrees of Separation, and MIS Research,” Proceedings of the Thirty-Fifth Annual Hawaii International Conference on Systems Sciences, Big Island, Hawaii, 7–10 January 2002.[/fn] and financial management.[fn]Beckman, P. and Hsiao, P. “Do a Firm’s Board Member Linkages Relate to IPO Firm Financial Performance?” Academy of Taiwan Business Management Review, 3 (1), April 2007.[/fn]
The hypothesis for this experiment was this: players who have played with more other players will have better on-field performance because they have learned from those other players and will use that learning to improve their own abilities. Conversely, players who, over their careers, have played with fewer other players would not be exposed to as many of the “tricks of the trade” and would therefore not perform as well as their more highly connected fellow players. Also, more-connected players will have been exposed to a larger set of coaches and will have learned a wider range of techniques from those many coaches than will have less-connected players.
BACKGROUND
In this research project, each player was initially entered as a node in the network of all professional Major League Baseball (MLB) players beginning in 1871. A link between two players was created if those two players appeared together on the opening day roster of any professional major league baseball team since league play began in 1871. This method of defining “interaction” is certainly not highly robust, as team rosters change over a season. Also, all links were considered “undirected,” meaning that any interactions were between the two players, and not from one player to another.
However, limitations on most SNA software restrict the number of network nodes to approximately 10,000 to 20,000 and the number of network interactions to the low millions. Optimally, indication of a network link could be much more precise, for example, being created every time two players took the field together. This type of interaction measure, however, would result in a network with billions of connections and no easily accessible SNA software available today would be able to analyze such a large network. Due to our software’s network size limitation and the generally greater current interest in players of the more recent past, we limited our data collection for this study to players who played between 1979 and 2004.
MEASURES OF NETWORK “CONNECTEDNESS”
To determine if there is a correlation between MLB player connectedness and on-field performance, we needed to choose measures of network connectedness and performance. There are several calculations that result in varying measures of network connectedness, and we extracted four of the most common measures: degree centrality, betweenness centrality, closeness centrality, and eigenvector centrality. Meanwhile, we selected four offensive performance measures: batting average, home runs, total runs batted in, and slugging percentage. We also measured defensive performance with fielding percentage. Explanations of network connectedness measures follow; due to the wide baseball knowledge of the readers of the Baseball Research Journal, no explanations of the on-field performance measures are described.
Degree centrality is the simplest measure of network connectedness, and refers to the total number of connections for a particular node. A player with more connections simply has more total connections to other players. This would occur if a player appeared on the opening day roster of many different teams with many different players over many years. Such a player therefore would have direct connections to many other players because they both: 1) moved around to play on many different teams, and 2) had a long career. Players who either had short careers or had long careers on one (or a small number of) teams would not have as high a value of degree centrality.
Betweenness centrality indicates the level at which a player lies on paths that connect other players. A player with a high betweenness centrality value can be thought of as being positioned between many other highly connected players. If there were a “flow” of something within the network of all players, those with high betweenness centrality would be seen to have a great influence on that flow. One more way to think of this measure is that players with high betweenness centrality lie on many “shortest paths” through the network. (The shortest path between two nodes is the path that passes from one node to another, but “goes through” the fewest number of other nodes.)
Closeness centrality refers to the “distance” between two nodes in a network. In this case, “distance” means how many connections are required to move through the network from one node to another node, using the shortest path between the two nodes. In this research project, a player who has a low “closeness centrality” relative to other players is one that can, on average, “reach” all other players using a smaller number of connections. Such a player can be considered “more highly connected” in that he has more close connections to other players. This would come about because such a highly connected player is connected to many other highly connected players, thus reducing the number of connections they need to “reach” other players.
Eigenvector centrality is a measure of the “importance” of a node in the network. Players with high eigenvector centrality are those players who are close (in the network) to other important players. One way to think of this measure is that a player who has many connections to other lowly-connected players will have a lower eigenvector centrality than a player who has the same number of connections but whose connections are to more highly connected players. This concept is very similar to the process used by the Google search engine in ranking websites: if your
website has many connections to other very popular websites, yours will have a higher eigenvector centrality than a website that has the same number of connections but whose connections are to websites that are not popular.
DATA COLLECTION
The process for our analysis began with the task of extracting opening day rosters for every MLB team from 1979 to 2004 from our original dataset. We entered each player as a node in our network and used opening day team roster information to indicate links between players. That is, two players were considered to be “connected” if they both appeared on the opening day roster of the same team for some particular year. However, our data source had numerous undesired characteristics that required some processing (data cleansing) prior to our being able to perform any network connectedness calculations.
During this “data cleansing” process, we removed duplicate associations that arose when the same two players appeared on open day rosters for several teams for more than one year. These multiple duplicate associations were counted as only one single association. Some social network analyses will keep these multiple connections and use them to place on that particular link a measure of “strength”; we chose not do this in our analysis. We also removed “self-associations” that appeared in our data entry process. Self-associations appeared as links in our network that were created because each player had an interaction with himself on every roster of every year. These interactions were spurious and needed to be removed as they would incorrectly alter the calculation of player connectedness. Finally, we had to manually inspect the data for different individual players who had the same first and last names and uniquely identify each of those “duplicate” but different players.
The resulting datafiles consisted of: 1) a list containing every individual professional baseball player (who appeared on any Opening Day roster of a major league team from 1979 through 2004), and 2) a set of records containing pairs of connected players in the format (playerA, playerB). We stored our connection data in this “edgelist” format as it is a standard form for entering data into SNA software.
DATA ANALYSIS
We used the free social network analysis software NodeXL[fn]Smith, M., Milic-Frayling, N., Shneiderman, B., Mendes Rodrigues, E., Leskovec, J., Dunne, C., (2010). NodeXL: a free and open network overview, discovery and exploration add-in for Excel 2007/2010, http://nodexl.codeplex.com/ from the Social Media Research Foundation, www.smrfoundation.org[/fn] (a Microsoft Excel plug-in) to perform our network “connectedness” calculations. The first step in our data analysis was to determine the level of connectedness of each of the professional baseball players. As described above, there are several different calculations that result in different measures of network connectedness. NodeXL calculates all of the types of centrality measures described above.
The next step in the data analysis process was to calculate the correlation between a player’s connectedness and their performance. We used the “Pearson product-moment correlation”—named “r”—to measure the correlation between player connectedness and player performance. This statistic refers to the linear dependence between two sets of values. A perfect positive correlation has a value of 1.00 and means that there is a perfect positive linear relationship between the two sets of values. A perfect negative correlation has a value of -1.00 and means that there is a perfect negative linear relationship between the two sets of values. As an example from this experiment, a perfect positive correlation between connectedness and home runs would mean that the list of players ordered by decreasing connectedness value would be in the same exact order as the list of players ordered by decreasing number of home runs. A perfect negative correlation for the same situation would mean that the list of players ordered by decreasing connectedness value would be in the same order as the list of players ordered by increasing number of home runs.
There are several ways to input data values to calculate the correlation between player connectedness and player performance. One way is to compare every player’s connectedness values to their performance values. This is an exhaustive comparison as it uses in the correlation calculation every possible element (player) in the data set. However, while we had network connectedness values for every professional MLB player from 1979 through 2004, we had no performance values at all and no way to associate each player in our “connectedness” dataset with their counterpart in some “performance” dataset. We decided that for this initial experiment, it would be too time-consuming to gather performance values for every player and enter them into our dataset. Instead, we chose to use a sampling process to calculate the correlation between connectedness and performance.
The first step in this sampling process was to randomly select 50 non-pitching players and manually collect their performance measures. We chose to not include pitchers in our correlation calculation because it is generally considered that a pitcher’s primary value lies in their defensive performance (e.g., preventing runs from being scored) rather than in their offensive performance (e.g., hitting home runs or driving in runs). Also, in the American League, pitchers have mostly incomplete offensive performance values as they do not bat against other AL teams. Therefore, we collected on-field performance values only for those randomly-selected 50 non-pitching players.
We then calculated the correlation between each of the four measures of connectedness and each of the performance measures for this set of 50 players. To ensure that we had not obtained anomalous results, we performed this step in the data analysis process again. That is, we randomly selected another set of 50 non-pitching players and calculated the correlation between their connectedness values and their performance values. We then compared the correlation results from these two sets of calculations. The average difference between pairs of values across the two tables is 0.03; the variance between pairs of values in the two tables is 0.023. While the individual r values varied somewhat, the average difference and variance suggest that the two tables are not widely divergent.
RESULTS
Our original network of all professional baseball players consisted of 15,506 unique individuals who appeared on opening day rosters after professional league play began in 1871. Counting as a connection each pair of player names who appeared together on any roster resulted in a total number of connections between all players of 1,965,620.
Our “reduced” dataset of players from 1979 through 2004 resulted in a total number of 5,062 players and 390,327 connections between those players. The results discussed in this section refer only to calculations performed on this reduced dataset.
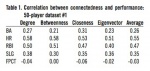
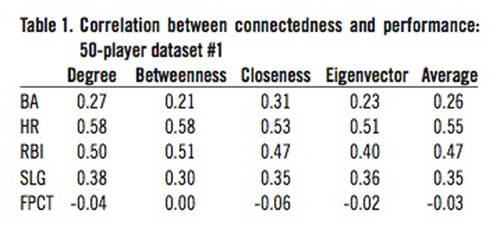
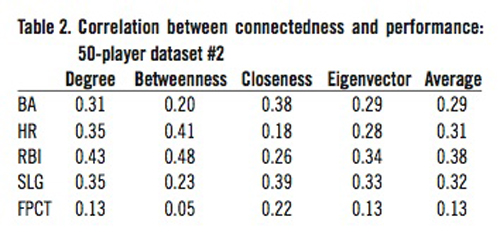
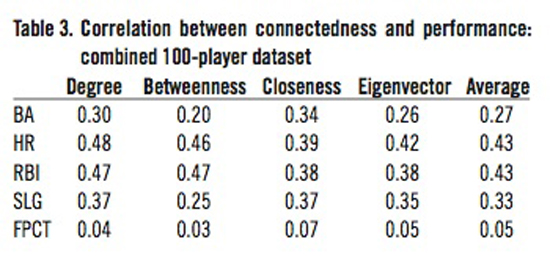
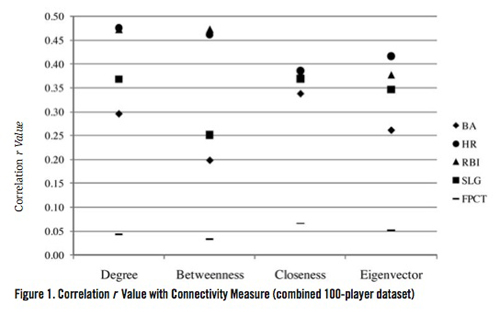
In each table, BA refers to batting average, HR refers to home runs, RBI refers to runs batted in, SLG refers to slugging percentage, and FPCT refers to fielding percentage. Table 1 shows the correlation values between our network connectedness values and on-field performance values from our first set of 50 randomly chosen players. Table 2 shows the same set of correlation results for the second set of 50 randomly-chosen players. Since there was relatively little difference between these two sets of correlation values, validating our method of sampling, we then combined the two 50-player datasets into one 100-player dataset and performed the correlation calculation again on this combined dataset. Table 3 shows the correlation results from that 100-player dataset.
Figure 1 (below) shows a graph of correlation r values versus connectivity measures for the combined 100-player dataset. Each of the 5 on-field performance measures (BA, HR, RBI, SLG, and FPCT) is displayed. Since there is no graphical relationship between connectivity measures, no lines connecting one connectivity measure to the next are shown for any of the on-field performance measures. Also, to aid in determining more precise values of r, the y-axis is only displayed with a range from 0.00 to +0.50 even though correlation r values can range from -1.00 to +1.00.
CONCLUSIONS
Tables 1–3 show that there are indeed positive correlations between player connectedness and on-field performance. However, conclusions drawn and discussed in this section refer only to the results shown in the combined 100-player dataset.
Note, however, that there are some subtle points that limit broad conclusions that can be drawn from our results. Most importantly, it is obvious that regardless of which measure of connectedness is viewed, the only correlations between connectedness and performance are to offensive performance measures. That is, correlations between offensive performance and any measure of connectedness are all greater than .20; 13 out of 16 are greater than .30 and 5 out of 16 are greater than .40. Conversely, the highest correlation between defensive performance and any measure of connectedness is .07.
The conclusion we drew from this result is that all players face the same situation when in their offensive position standing at bat at home plate. The outfield fences are the same height and distance away for all players, foul territory is the same size and shape for all players, the pitcher is standing the same distance away for all players, and so forth. Conversely, when in their defensive position, each player stands in a different location, has differing views of the batter, and gets different amounts of time to reach a ball that is hit to them. For example, outfielders have more time to react to a hit ball than infielders and must be able to run greater distances to perform their defensive duties. Catchers are not expected to run much at all, but must be able to quickly throw to other bases, sometimes from their knees. First basemen are not expected to have to run as much as other infielders but must be quite adept at catching balls that sometimes arrive in the dirt while keeping at least one foot on first base. Therefore, the skills required for high offensive performance are shared by every player, while the skills required for high defensive performance are often quite specific to the position an individual plays. This means that, as a player becomes more highly
connected, he can learn offensive performance improvements from any player. However, players can learn defensive performance improvements essentially only from another player who shares the same position. The ultimate result of this situation is that more highly connected players can significantly improve their offensive performance by making new connections in their network but they cannot improve their defensive performance at the same rate. Ergo, connectivity should (and does) have a much higher correlation to offensive performance than to defensive performance. Defensive performance should not be affected much by more connections in the network. Since correlation values can range from -1.00 to 1.00 and no correlation at all is indicated by a value of 0.00, the data support the conclusion that offensive performance is positively correlated to connectivity whereas defensive performance (at least as measured by fielding percentage) is not correlated to connectivity either positively or
negatively. This is suggested by every connectivity:performance value being positive for offensive performance measures while all connectivity:performance values range in relatively small values around 0.00 (no correlation) for defensive performance.[fn]One suggestion for future study, to validate this supposition that offense should be more highly correlated with connectedness than defense, would be to repeat the analysis using a metric of defensive ability other than fielding percentage, which many sabermetricians consider an inaccurate measure of actual defensive ability.[/fn]
A second but less relevant subtlety in the results is that some measures of connectedness are more highly correlated to performance than are other measures of connectedness. For example, home runs and runs batted in are relatively more highly correlated than are slugging percentage and batting average. That is, both home runs and runs batted in have correlation r values of 0.43 while batting average and slugging percentage have correlation r values of 0.27 and 0.33. This suggests that, as a player’s connectivity increases, their offensive performance improves more in hitting home runs and driving in runs.
Note, however, that the dominant effect of connectivity is on offensive performance, not defensive performance. Specifically, the data show that there is not nearly as much difference within the various measures of connectedness correlations (average values between .27 and .43) for offensive performance as there is between offensive and defensive performance correlations (average of all offensive performance correlation values of .37 versus defensive performance correlation value of .05).
In conclusion, there is obviously a correlation between the total number of other players a major league player shared a roster with over time and his offensive performance. This result is shown by the data in all three tables; more highly connected players have better on-field offensive performance measures regardless of the measure of connectivity used.
Also, connectivity appears to have no correlation with our on-field defensive performance measure. This could be explained by the difference in the offensive and defensive situations that each player faces when on the field, and how those different situations affect a player’s ability to improve their own performance when learning from their peers.
LIMITATIONS
Some limitations to this research project prevent broad conclusions from being drawn from the results. First, “opening day roster” is a simplistic foundation to use for calculating connectedness, as players can and do change teams during a season. Second, simply appearing together on the roster does not mean that players actually “interacted” with each other. While they appear on the roster purely by circumstance, they may never really interact with each other. Third, “connection” data were entered as binary values and not continuous values. This means that two players who appeared on any opening day roster were considered connected regardless of whether they appeared on one opening roster or many opening day rosters. Making a distinction between these two possibilities is referred to as measuring interaction “strength” and would show that players who had several interactions were “more tightly” connected than players who had only one interaction. Fourth, using a sampling method for comparison of connectivity to performance introduces the possibility of statistical inaccuracies that would be removed by comparing these values for every possible player. As this is our first attempt at this analysis, we chose the more expedient sampling method as a “proof-of-principle” approach. Since this initial and simple experiment has indeed shown correlations between connectivity and performance, it appears appropriate to use an exhaustive sampling process to more precisely refine our correlation r values.
FUTURE RESEARCH
The next step in the research direction is to collect more precise data about player interaction. One way to do this would be to collect data about which players actually took the field together for every game played. An even more precise process would gather data about which players took the field in each inning of each game. At some point, however, it is unlikely that more precision in this data collection process would improve results. That is, it is unlikely that a player would be able to improve their performance much more by having played one more inning with a particular set of players. Another step in the future of this research would be to calculate correlation between a player’s performance and the various different coaches for whom they played. One could also extend this research direction to
determining the correlation between a player’s connectedness and their team’s performance. Finally, the “Holy Grail” of this research direction would be to calculate the correlation between a player’s connectedness and their performance over time. If such a correlation were found, it would then be possible to predict the future performance of a player based on their current level of connectedness. This knowledge would be of incredible value to those in management trying to select players.
DR. PAUL BECKMAN is Professor of Information Systems at San Francisco State University. He has been doing social network analysis (SNA) research since the late 1990s and promotes the use of SNA in evaluating human performance.
JENNIFER SHEN HSIN CHI is a 2010 M.B.A. graduate from San Francisco State University with an emphasis in Information Systems. She has worked with Professor Paul Beckman on her M.B.A. thesis regarding social network analysis (SNA). She is currently working as a Product Specialist for Hewlett-Packard.