Normalized Winning Percentage, Revisited
This article was written by Bill Deane
This article was published in 2005 Baseball Research Journal
In the 1996 Baseball Research Journal, I presented something I call “Normalized Winning Percentage,” or NWP. After a decade’s passage of time, and the emergence of a new all-time leader and number two man, it seems a good time to revisit this statistic.
NWP projects how a pitcher might perform on a .500 team, thus putting all hurlers, past and present, on an even plane of comparison. The concept starts out by comparing a pitcher’s won-lost record to that of his team, neutralizing the impacts of a team’s offense and defense on its pitchers’ records. This idea is hardly new: Ted Oliver used it in his Kings of the Mound in 1944; David Neft and Richard Cohen used it in The Sports Encyclopedia: Baseball in 1973; Merritt Clifton used it in Relative Baseball in 1979; and Pete Palmer used it in The Hidden Game of Baseball in 1984. Each of these men analyzed the data differently, but each overlooked one basic problem: a pitcher on a poor team has more room for improvement than one on a good team. In other words, it’s easier for Walter Johnson to exceed his team’s win percentage by 100 points than it is for Whitey Ford.
Consider the performances of Steve Carlton in 1972 and Greg Maddux in 1995. Carlton had a 27-10 (.730) record for the last-place Phillies, who were a woeful 32-87 (.269) in games Lefty did not get a decision. Carlton’s percentage therefore exceeded his team’s by a whopping 461 points – out of a possible 731. On the other hand, it is hard to imagine anyone pitching any better than Maddux did when he went 19-2 with an ERA (1.63), more than 2.5 runs better than the league’s. Yet Maddux’s winning percentage was “only” 328 points above that of his Braves (71-52, .577, without Mad Dog’s decisions). Moreover, even if Maddux had been a perfect 21-0, he would have fallen short of Carlton’s 461-point cushion. The point here is not to diminish Carlton’s achievement, but to illustrate the potential inequity in this type of comparison.
NWP basically measures how much a pitcher has exceeded his team’s performance, divided by how much he could have done so, and scaling the result as if he had pitched for an average (.500) team. Thus, a hurler who posts a .520 percentage for a .400 team gets credit for the same NWP score (.600) as a .600 pitcher on a .500 team, or a .680 pitcher on a .600 team – because each has exceeded his team’s percentage by 20% or the potential room for improvement.
For a pitcher whose win percentage exceeds his team’s, the formula for NWP is as follows: average percentage plus [(pitcher percentage minus team percentage) times (perfect percentage minus average percentage) divided by (perfect percentage minus team percentage)]. Rather cumbersome but, since “average percentage” is always equal to .500 and “perfect percentage” is always equal to 1.000, we can simplify the formula as follows:
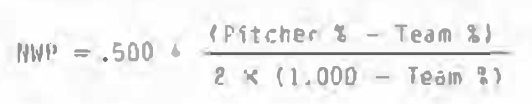
Incidentally, for a pitcher whose percentage is lower than his team’s, the converse-NWP formula is applicable: .500 minus [(team percentage minus pitcher percentage) divided by (team percentage doubled)].
To put the NWP formula into practice, let’s take a look at Johan Santana’s performance for the 2005 Twins. Santana compiled a 16-7 (.696) log, while his team was 83-79 overall. Subtracting his decisions, the Twins had a 67-72 record for a .482 percentage. Santana’s NWP is calculated as follows:

Santana’s resultant NWP (.706) was fifth best in the majors last year, only a little below his Cy Young Award performance of ’04; a list of the 2005 leaders accompanies this article.
I developed the concept for NWP in the early 1980s. The formula has undergone several minor refinements over the years, and undoubtedly has room for more. Perhaps NWP’s biggest weakness is that it assumes all pitching staffs to be created equal, so that an average pitcher on a poor staff can appear better than an excellent pitcher on a great staff. While this creates some aberrant single-season results, things usually tend to even out over a pitcher’s career.
NWP can be, and has been, incorporated into what analyst Pete Palmer calls “wins above team” (WAT), the number of victories a pitcher contributes over what an “average” pitcher might. Palmer revised his formula to include mine in Total Baseball and The ESPN Baseball Encyclopedia. The formula for WAT (for pitchers with higher percentages than their teams) is as follows:

Incidentally, NWP gives Carlton’s 1972 season a score of .815, while Maddux’s 1995 campaign checks in at .887. But because Carlton maintained his excellence over a greater number of decisions, he beats out Maddux in WAT, 11.7 to 8.1.
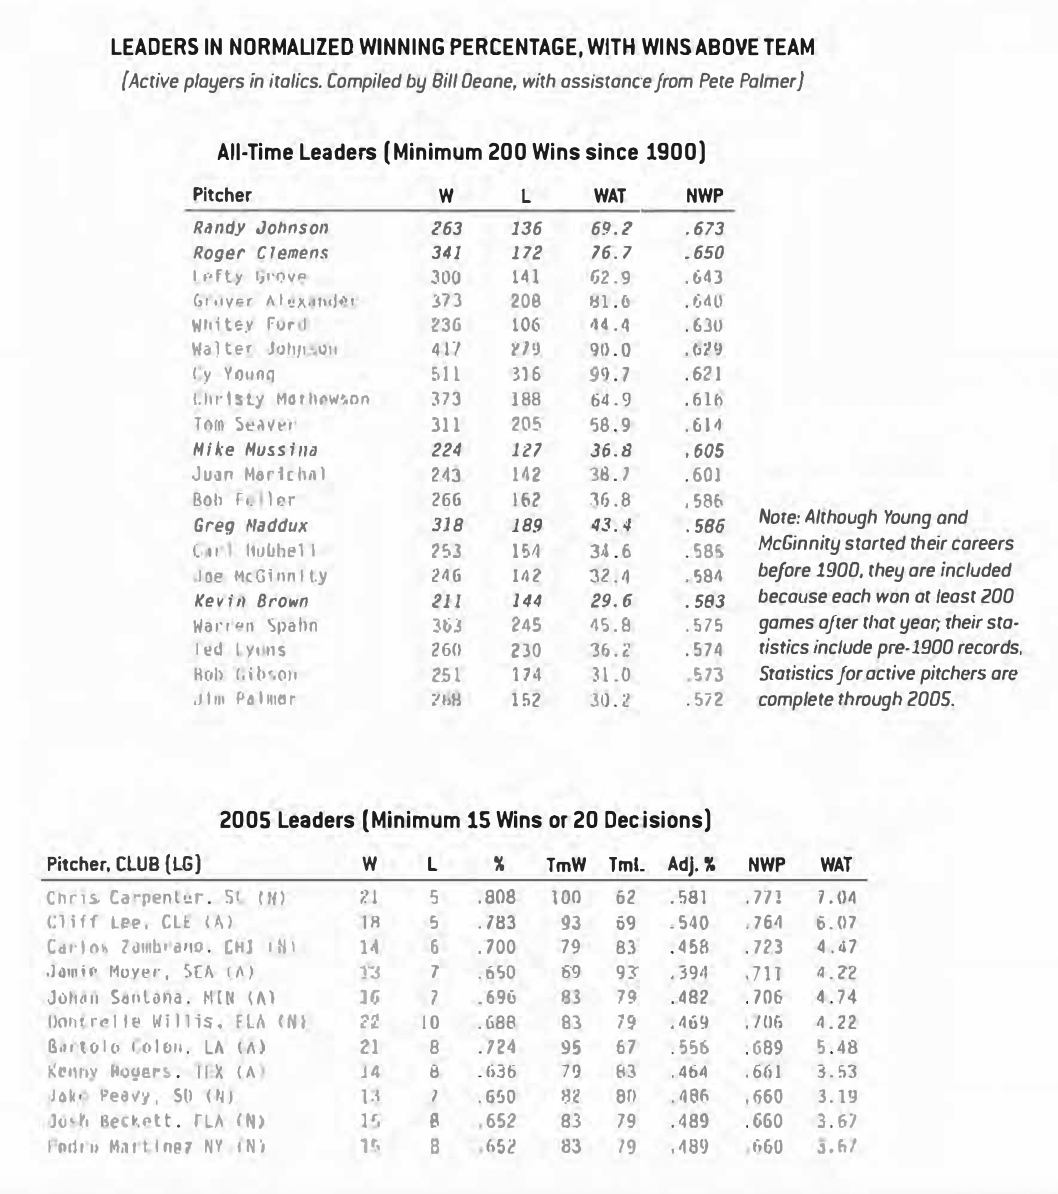
A list of the top 20 career NWPs (minimum 200 wins since 1900) follows. Each of the pitchers who is eligible is in the Hall of Fame. As a group, their careers are quite evenly distributed over the 106-year span, as opposed to conventional measures of pitching, which suggest that all of the best hurlers toed the rubber before Wairren Harding was president.
Since joinirng the 200-win club, Randy Johnson ( .673) and Roger Clemens (.650) have supplanted Lefty Grove (.643) for the best career normalized winning percentages. The Big Unit and the Rocket also rank in the top five all-time in Wins Above Team. No fewer than five of the top 20 NWP pitchers – including some surprises-were active in 2005. Three others – including Curt Schilling (192 wins, .606 NWP) and Kenny Rogers (190, .597) – stand good chances of joining them soon, once they reach the 200-win barrier.
And Pedro Martinez, with 197 wins and a .686 NWP, should become the Daddy of them all.