

Should a 22-Game Season Sweep Have Occurred? An Examination of Season Sweeps and Near-Sweeps
This article was written by Bruce Cowgill
This article was published in 2005 Baseball Research Journal
After the Dodgers’ win over the Pirates on August 5, 2004, the game’s broadcasters announced that the Dodgers had just achieved a season sweep of the Pirates. The announcers added that it was the Dodgers’ first season sweep since moving to the West Coast in 1958. First, I found it surprising that this was their first sweep, given the short season series on today’s schedule. Second, a six-game season sweep did not sound like that great a feat.
It turns out that the Dodgers have swept several three-game season series over the last few years, including the Orioles just two months prior to the Pirates sweep. However, if we exclude these small series, the announcers were correct that the Dodgers’ sweep of the Pirates was their first since 1958, Actually, the “Dodgers” franchise (including the Brooklyn Superbas) had never swept a season series in the 20th century. One has to go all the way back to 1899, when the Brooklyn Superbas swept a 14-game season series against the Cleveland Spiders.
To my second point, a six-game season sweep is no great feat. In 2004, four other teams achieved such a mark, and two teams had seven-game sweeps. In 2005, three teams swept: Twins vs. Devil Rays, Phillies vs. Padres, and Astros vs. Phillies (note, this is the Astros’ second in a row season sweep of the Phillies, making it 12 straight).
Sweep History
If six-game sweeps are somewhat common, what is the record? The most games won in a sweep since 1900 was 13 by the 1993 Atlanta Braves over the expansion Colorado Rockies. There have also been several instances of 12-0 sweeps, most recently the 1999 Texas Rangers over the Minnesota Twins. In baseball history, the record holder is the 1885 Chicago White Stockings’ 16-game sweep of the Buffalo Bisons. In 1899, the Cleveland Spiders were on the losing end of two 14-game sweeps by the Brooklyn Superbas and the Cincinnati Reds. This is not too surprising considering that the Spiders managed to win only 20 games out of 154 that season, and the most games they won against any of the 11 other teams was four.
Since 1871, only 21 season sweeps of 10 games or more have occurred, with only nine of these happening since 1900. Only nine? The first season sweep of significance did not take place until the Baltimore Orioles’ 12-game sweep of the Kansas City Royals in 1970. Table 1 lists all sweeps in baseball history of 10 games or more.
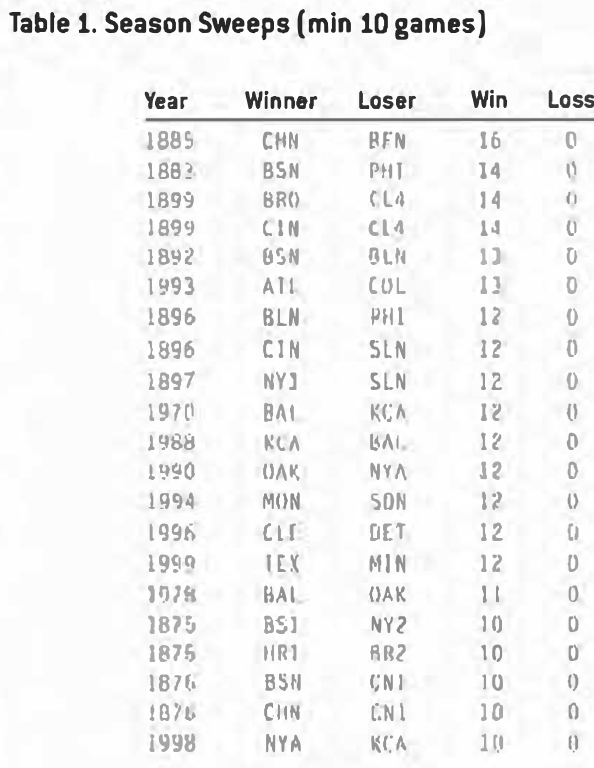
Prior to 1961, and the arrival of increasingly shortened season meetings, season sweeps would have been quite an accomplishment. From 1904 to 1961, each league had eight teams who played each other 22 times (excluding the 1918-19 WWI-shortened seasons). During that time period, no team ever swept a 22- game season series! However, four teams came close with 21-1 records and another with a 20-1 record.
1909 Chicago Cubs vs. Boston Braves (Doves)
1909 Pittsburgh Pirates vs. Boston Braves (Doves) (20-1)
The Cubs won 104 games that season, surprisingly only good for second place behind the 110-win Pirates. The Cubs lost 4-2 to Braves rookie pitcher “Red” White at home in their third meeting of the season.
The Braves almost achieved the dubious honor of going 1-21 against two teams in one season but remained 1-20 against the Pirates, picking up their lone Victory in game one of a September 2 doubleheader. Cliff Curtis, pitching in his second major league start, defeated rookie Babe Adams and the Pirates, 1-0.
1927 New York Yankees vs. St. Louis Browns
The “Murderers Row” Yankees won 110 games that season, while the Browns would manage only 59 wins. The game on September 11 marked the last meeting of the two clubs that year. To that point, the Yankees had won 21 straight against the Browns – one more win for a 22-game season sweep. The Yankees were playing at home. Future Hall of Farner Herb Pennock was on the mound. Babe Ruth would hit home run number 50. But pitcher Milt Gaston gave up only five hits and the Browns beat the Yankees, 6-2.
1937 Pittsburgh Pirates vs. Cincinnati Reds
The Reds won their lone game against the Pirates, 8-3, in the first game of a May 31 doubleheader (their fifth meeting of the season), then lost a NL post-1900 record 20 straight to the Pirates. Seventeen of the losses came in 1937.
1945 Chicago Cubs vs. Cincinnati Reds
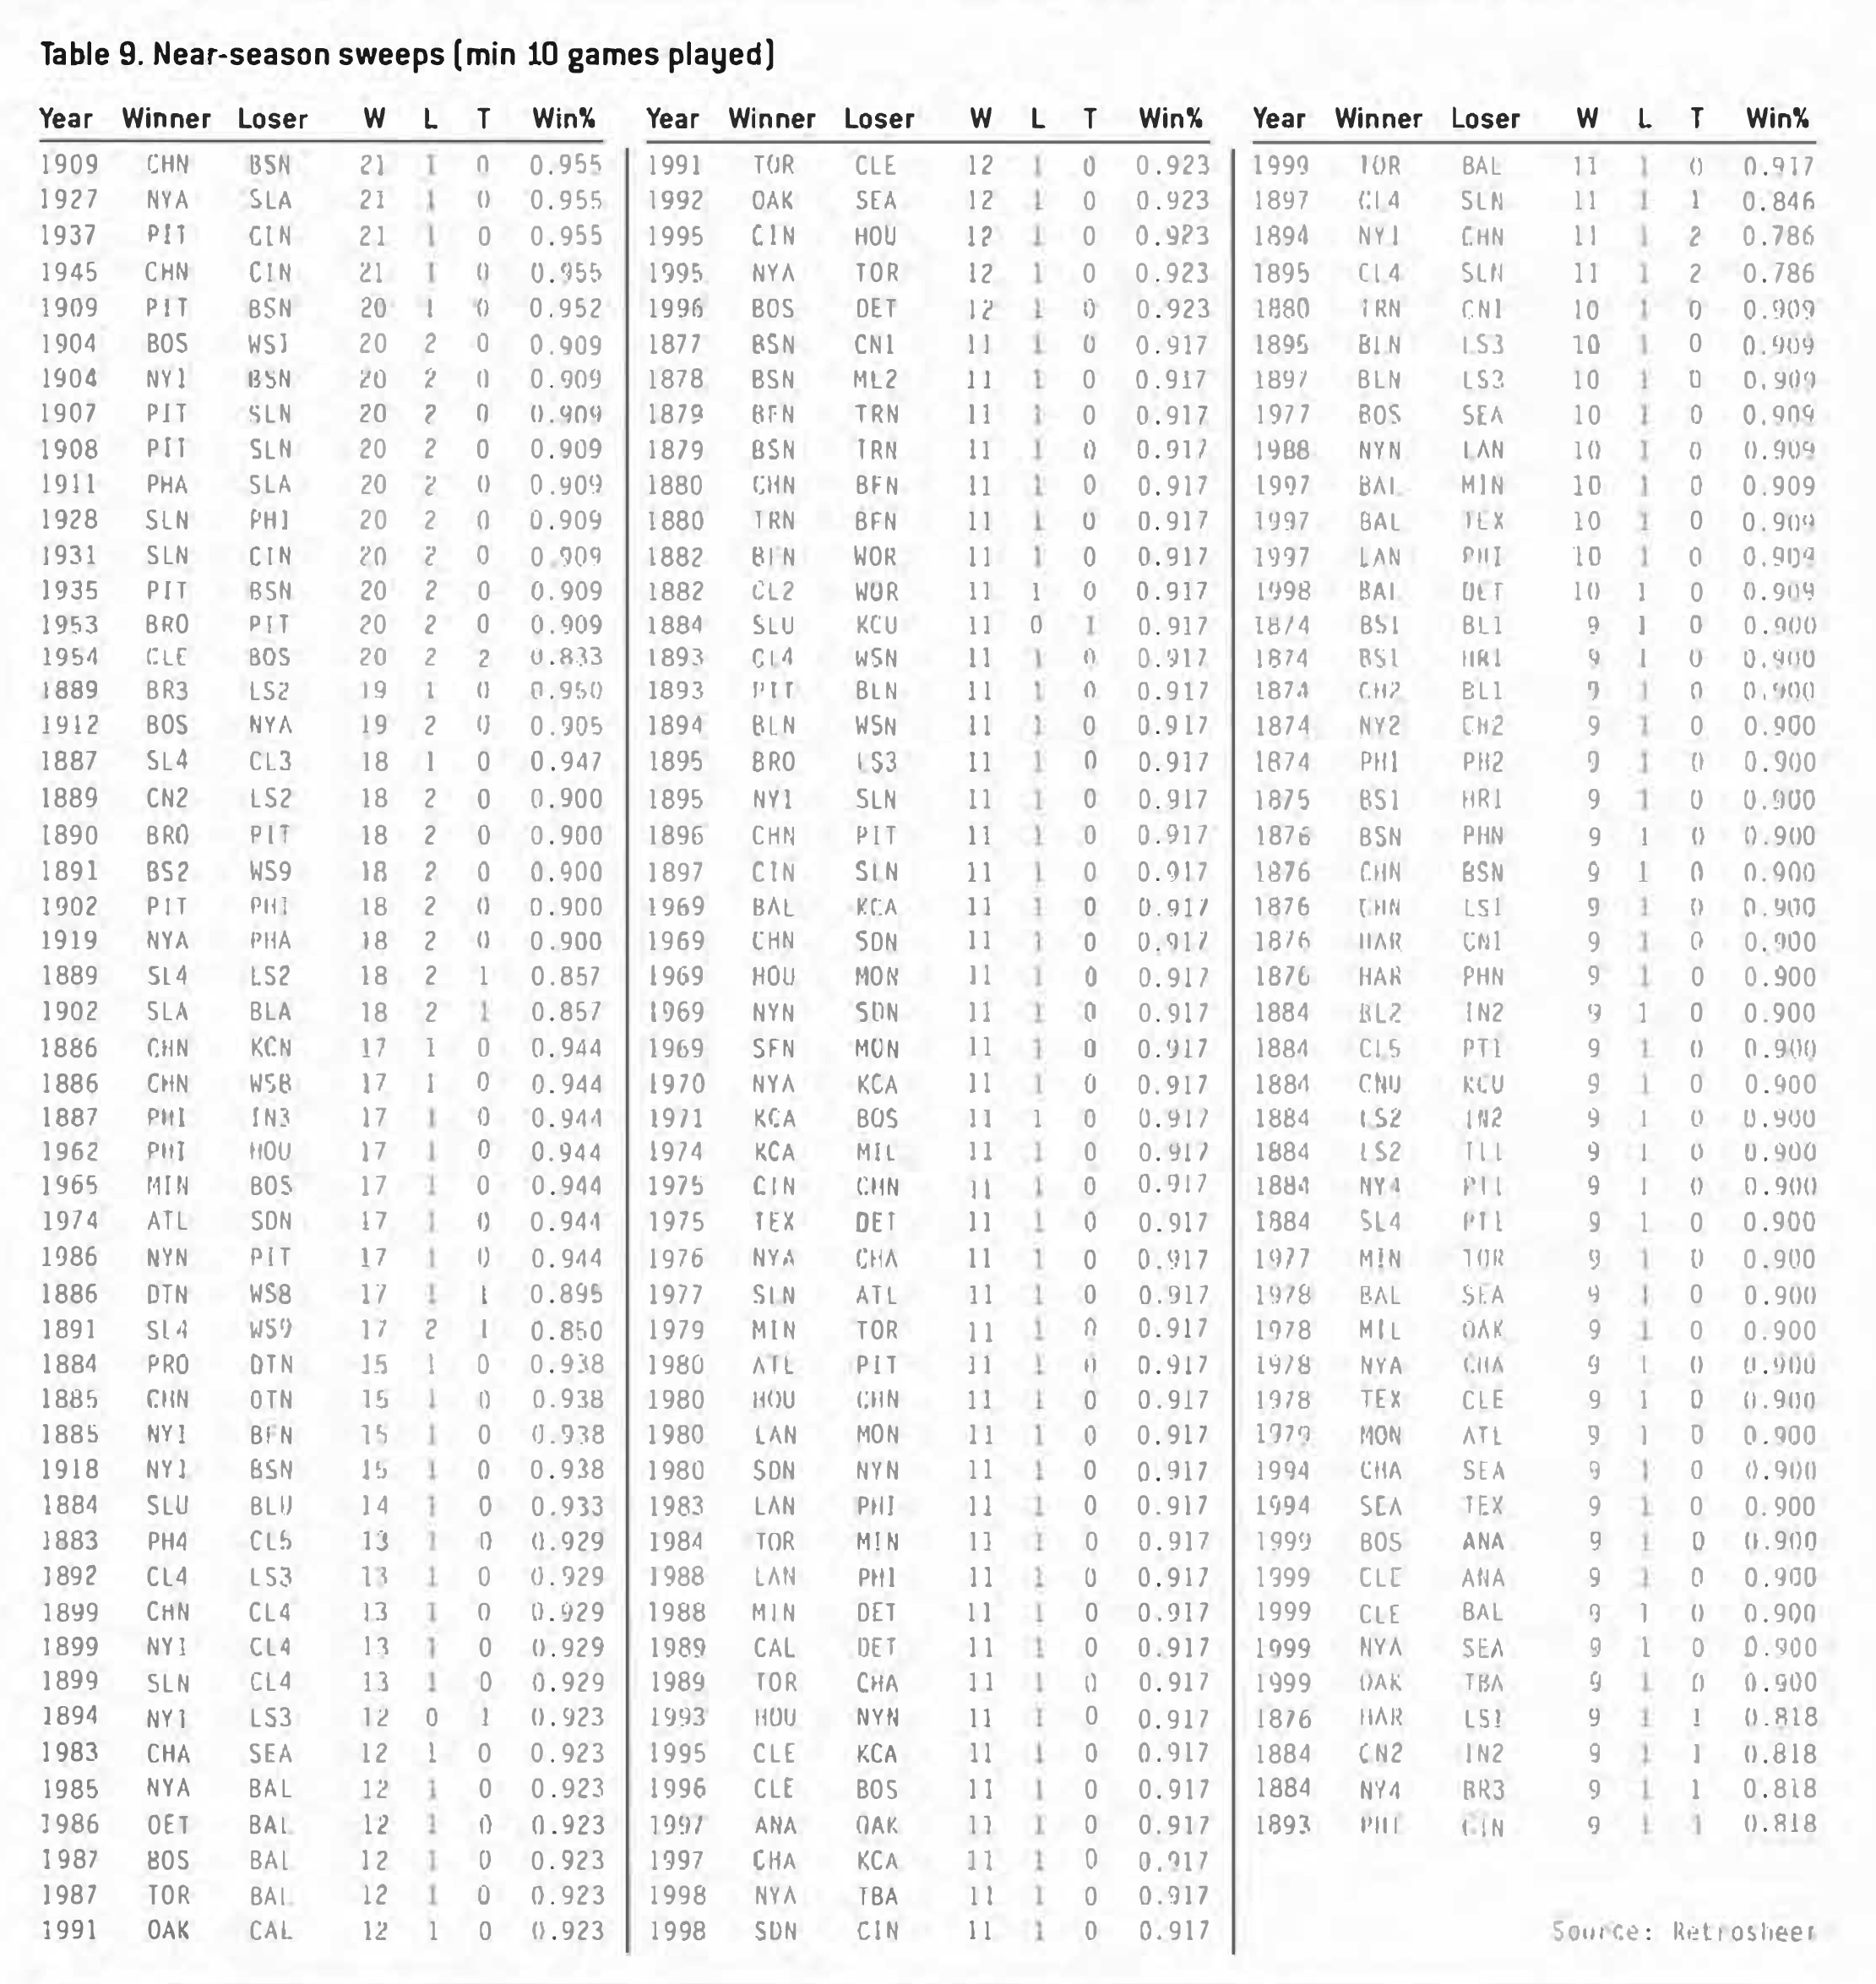
The Cubs were 21-1 vs. the Reds (losing their 16th meeting) and won the pennant by just three games over the Cardinals. Interestingly, the Reds managed a 9-13 record against the Cardinals. This was much better than the Cubs’ 6-16 mark against second-place St. Louis, which was the Cubs’ only losing record to a team that season. (Note: Table 9 shows all near-sweeps of at least 10 games played.)
Research Questions
While certainly better than 6-0, how does the Braves’ 13-0 mark compare with the Dodgers’ feat? How does the Braves’ sweep compare to the 21-1 near-sweeps? My question was from a statistical viewpoint, not one based on differences in era that might make it more or less possible (e.g., travel comforts, personal assistants, day vs. night games, etc.). I realize in the “interesting statistical feats” category, a 13-game sweep does not deserve even a footnote in comparison to feats such as DiMaggio’s hitting streak. But regardless, 13-0 is a decent record, especially if one considers that only six teams have gone 12-0 since 1970. If that is the case, then 21-1 seems that much more remarkable despite missing the sweep (let’s face it, there is not much difference in the court of humiliation between 22-0 and 21-1).
My questions are:
- How likely were the Dodgers to sweep the Pirates?
- How likely were the Braves to win 13 games against the Rockies?
- How does the Braves’ 13-0 compare to the teams who achieved 21-1 records?
- How likely is a 22-game season sweep?
- Should a 22-game season sweep have occurred in history?
Calculating Team vs. Team Sweep Probabilities
Rather than taking a slightly easier road using each team’s overall win-loss record, I decided to examine the impact of each team’s record at home and away as the basis for my analysis. Table 2 shows each team’s overall record, place finished in league (division rank in 2004 and 1993), and home-and-away splits.
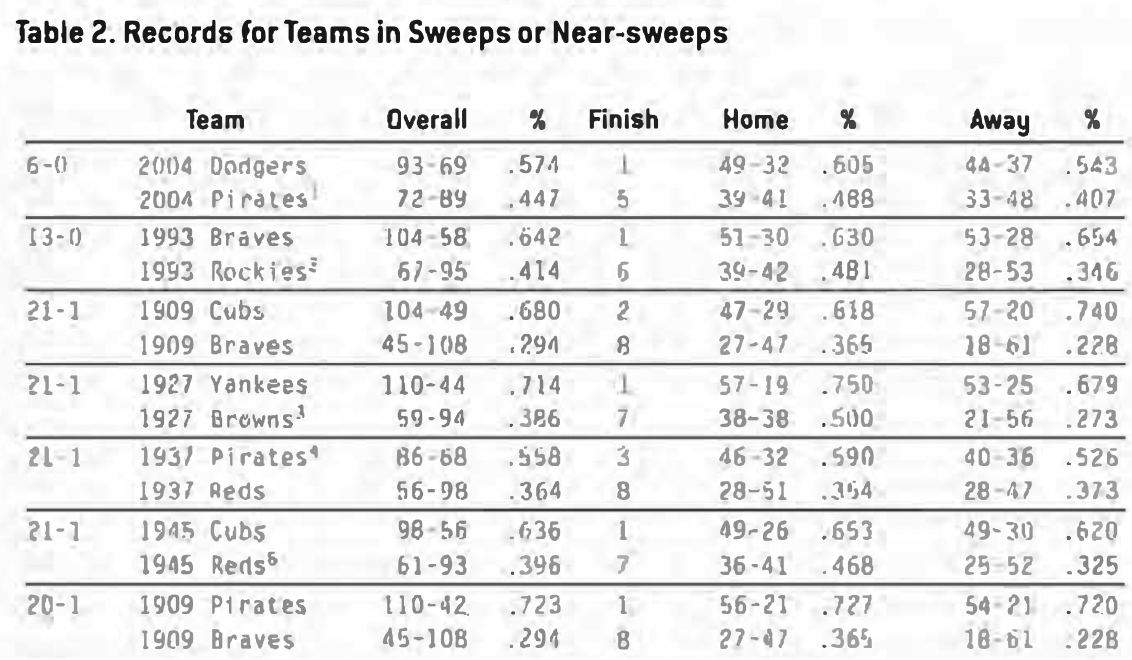
There are some interesting findings in Table 2. First, only the 1909 Pirates’ near-sweep of the Braves was achieved by a first vs. last-place team. However, in the other cases, either a first-place team or a last-place team was involved. Second, although somewhat obvious, if the head-to-head record is removed for these teams, their overall records suffer (or improve) quite a bit. That is, removing 21 wins (or 21 losses) has a substantial impact on a team’s record. This is most evident in the case of the 1937 Pirates. If the Pirates had not nearly swept the Reds, their record would have been below .500 (65- 67, .492)! Conversely, the Reds’ record would be 55-77, .417. Third, three of the 12 teams had a better record on the road than at home: 1993 Braves, 1909 Cubs, and the 1937 Reds (see Table 2).
Using the home-and-away winning percentages, I calculated each team’s probability of winning at home and away using a variation of the log5 method. Table 3 shows the single-game probabilities of each “sweep” team (the first team listed) winning based on their home-and-away records from Table 2.
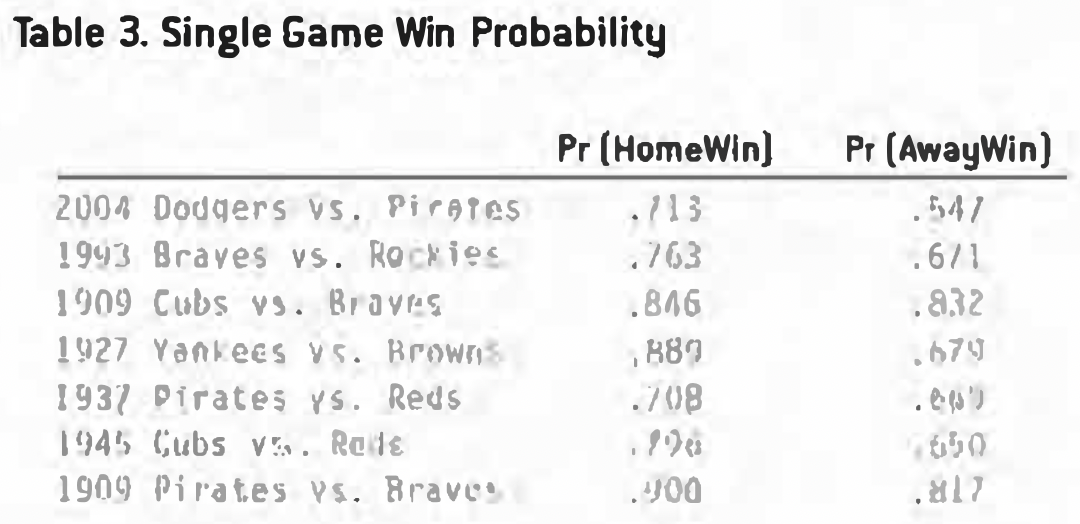
Intuitively, the probabilities are what one would expect from teams that have a high winning percentage when playing teams with very low winning percentages. Noteworthy is the 1909 Cubs’ and Pirates’ expected dominance over the Braves at home and away. Also, the 1909 Pirates’ home probability is astounding (with today’s schedule, if the Pirates played only the Braves, they would be 73-8 at home).
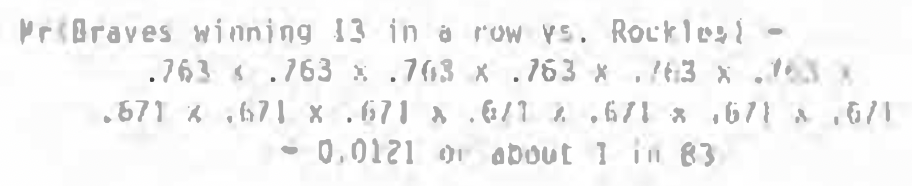
Since these are single-game probabilities, the next step is to calculate the probability of winning a series of games. For the 1993 Braves, who won all 13 games, the calculation is fairly easy. The probability of winning 13 games in a row is the product of each game’s probability. In 1993, the Braves played six home games and seven away games against the Rockies (note that the order of the games does not matter in this calculation):
The formula for 22-0 follows the same logic, with an even split of 11 home games and 11 away games. The probability that the 1927 Yankees would sweep the Browns is 0.0039 or about 1 in 258.
The calculation for 21-1 is slightly more complicated, due to the fact there are 22 different ways for a team to have a record of 21-1 (as opposed to only one way for a team to have a record of 22-0). That is, a team could lose game 1 and win games 2 through 22, or win games 1 through 9, lose game 10, win games 11 through 22, or win games 1 through 21 and lose game 22 (as the 1927 Yankees did). Table 4 summarizes these calculations.
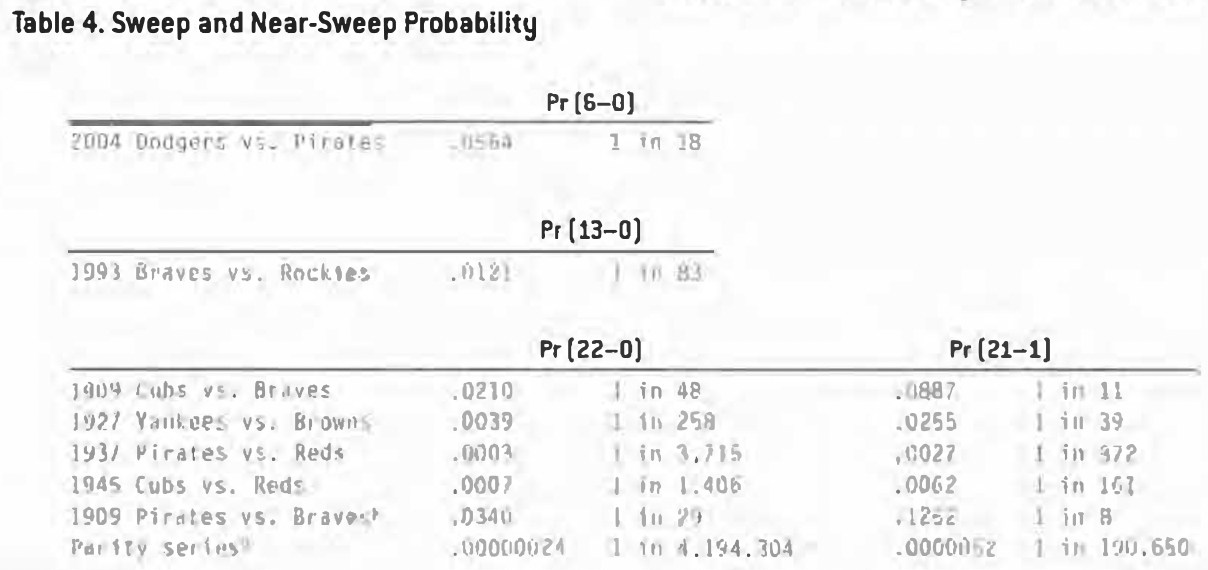
As I suspected, the 2004 Dodgers’ six-game sweep is not that impressive. However, although relatively high, the probability is lower than I expected for a six-game sweep. This is more a function of the relatively small winning-percentage differential between these two particular teams.
Because of the large winning-percentage differential of the 1909 Cubs and Braves, it was actually more likely for the 1909 Cubs or Pirates to have a 22-0 record than the 1993 Braves to have a 13-0 record. And, 21-1 was almost expected of the Cubs or Pirates. With a 1 in 39 chance in 1927 and many other dominant years. one should not be surprised that there would be a Yankee season with a 21-1 record at some point. With each team playing seven 22-game series each year, 1 in 39 amounts to less than 1 in 6 team seasons (assuming the same dominance over those seasons).
The 1937 Pirates were the most unlikely of these teams to go 21-1 . This is because they were not that strong a team, finishing third that year with a .558 record, resulting in the smallest winning-percentage differential. The 1 in 372 translates to 1 in 53 team seasons.
Should a 22-Game Sweep Have Occurred?
Upon further examination of the above figures, I became less impressed. In fact, I am somewhat surprised that a 22-0 record never happened.
From 1904 to expansion in 1961 , there have been 111 league seasons that included 22-game series (excluding 1918-19). With eight teams in a league, there are 28 22-game series that occur each season. Twenty-eight series over 111 seasons equals 3,108 total 22-game series. Accounting for the fact that both teams in a series have a chance for a sweep, there have been 6,216 opportunities for a sweep. None have happened. Zero. Baseball is 0 for 6,216 in 22-game sweeps! Given that the 1937 Pirates had a 1 in 3,715 chance as a third-place team with a relatively poor record at sub-.600, it presented me with the initial justification to examine my “less than impressed” intuition.
While the 1909 Cubs at 1 in 48 chance and the 1927 Yankees at 1 in 258 chance are probably not common, I suspect that there have to be numerous combinations of similar winning-percentage differentials between two teams. In fact, in both of these cases, there were other combinations of teams in those very years who were more likely to be involved in a season sweep: the 1909 Pirates vs. Braves and the 1927 Yankees vs. Red Sox (five times as likely as the Yankees vs. Browns). These other combinations result in higher winning-percentage differentials (which leads to a higher sweep probability), and I doubt that these are the largest differentials over 111 seasons.
Should a 22-0 sweep have occurred? Over 3,000 series, many teams with 90 or more wins, many teams with less than 60 wins, dynasties, eternal cellar dwellers?
Calculating Season Sweep Probabilities Among Multiple Teams: 1909 NL
Of the teams examined, I decided to start with the 1909 NL season because it included two near-sweeps of relatively high probability (yes, 3% is relatively high).
For this phase, I chose to use each team’s overall record and ignored home-and-away splits. The sole reason for this decision is to reduce the number and complexity of the calculations required. The first analysis focused on Team A vs. Team B. To determine the probability of a 22-game sweep in one season requires a more formidable task of examining all 28 season series: Team A vs. B, A vs. C, A vs. D, B vs. C, B vs. D, etc., thus a simplified approach seemed reasonable.
Using the 1909 NL final results, the next step is to calculate the probability of Team A winning over Team B for all 28 combinations: Pr(a,b). We also need the probability of Team B winning over Team A, Pr(b,a); fortunately, that is just 1-Pr(a,b). This produces a grid of 56 probabilities for all possible head-to-head matchups. As noted earlier, the probability of a team winning 22 games out of 22 is Pr(a,b) raised to the 22nd power. In the initial calculations, I cared only about the Cubs sweeping the Braves, but now I have to factor in the probability of the Braves sweeping the Cubs (however remote), so all 56 combinations need to be calculated.
Log5 Issue
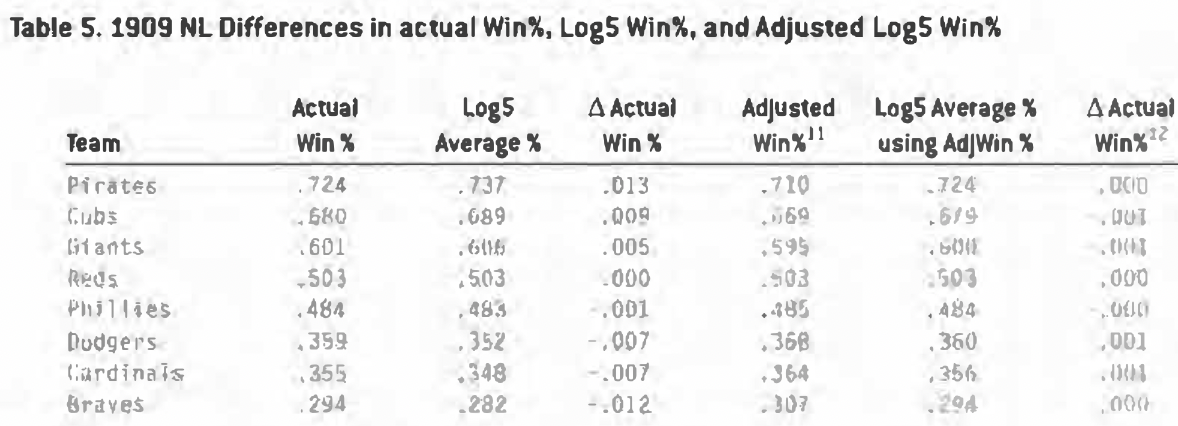
The problem when calculating all combinations of head-to-head probabilities in a league is that a team’s average log5 Win% across all the teams does not equal its actual Win%. For instance, the .724 Pirates did not have to play themselves, while the hapless .294 Braves did not benefit from playing the hapless .294 Braves. Therefore, the Pirates’ log5 probability will be overstated and the Braves will be understated. To account for this, a technical adjustment needs to be made to each team’s actual winning percentages before applying log5. Interested readers can see Table 5 for the adjustment, and a full explanation can be found in SABR’s By the Numbers. Table 5 shows that, after adjustment, the resulting probabilities are nearly identical to the actual Win%.
Back to 1909
Once adjusted, I recalculated all 56 sweep probabilities. Most matchups have very small sweep probabilities, but a few stand out. The near-sweep Cubs over the Braves probability is 0.0128. The Pirates over the Braves is 0.0258, double that of the Cubs’ chances. The only other probabilities close to 0.01 are the Pirates over the Cardinals (0.0098) and the Pirates over the Dodgers (0.0092).
A few more calculations: the probability of neither team winning 22 out of 22 games and the probability of no 22-game sweep occurring in any series in that season. For the 1909 NL, the probability of no sweep is equal to 0.9298. So, the probability of at least one sweep occurring in 1909 NL equals 0.0702 or a 1 in 14 chance.
In the 1909 NL, there was a 1 in 14 chance of a 22-game sweep! That seemed fairly significant to me. Assuming that chance over 111 league seasons results in a probability of 0.9997! This is about as near to a statistical guarantee as one can get.
So far my thinking was correct: a 22-game sweep should have occurred. Correct? Not exactly.
Calculating More Probabilities: Beyond 1909 NL
If the 1909 NL season is representative of the other 110 seasons, then one would expect a sweep to have occurred. However, I suspect that the 1909 NL is not like other seasons. In that season the top team’s Win% was 0.724 and the last-place team’s was 0.294, a difference of over 0.400. That seems quite large to me. For perspective, the 1998 114-win Yankees’ 51-game lead over the expansion Devil Rays amounted to a differential of “only” .315.
To further place the 1909 season in context, I examined a league of total parity. That is, all the teams finished with a 0.500 record. In this scenario, the chances of at least one 22-game sweep occurring over 111 parity league seasons is only 0.0015 or 1 in 675. So, this suggests that in seasons where there is competitive balance, the chance of a sweep occurring is low.
Conversely, less competitive balance results in higher probabilities of a sweep. In fact, even small deviations from parity result in significantly higher probabilities. For example, consider a league with a 0.600 team, a 0.400 team, and six 0.500 teams every season. This would result in about a 1 in 20 chance over 111 seasons. This is 34 times the likelihood of a total parity league.
The difference between the top and bottom team is not the only difference that matters. Since each team plays each other, the deviation across all eight teams contributes to increasing the likelihood of a sweep occurring. The standard deviation of Win% from the 1909 NL season is 0.159. I calculated the other near sweep years’ standard deviation along with their sweep probabilities. Table 6 compares these seasons.
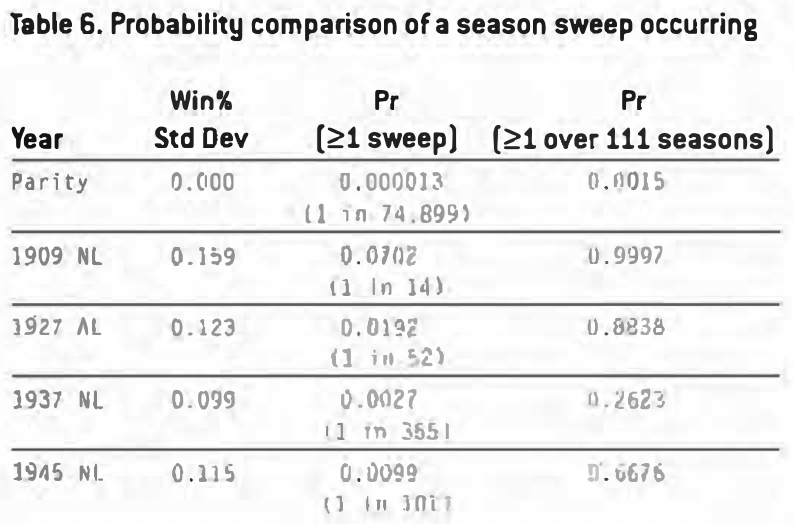
Table 6 illustrates how changes in the Win% standard deviation impact the probability of a season sweep occurring. The 1927 AL deviation may appear only slightly smaller than the 1909 NL, but statistically the difference is substantial. In the 1927 AL, the Yankees did dominate but the other teams in the mix did not, at least not to the same extent as the 1909 NL teams. In the 1909 NL, there were three teams over .600 and three teams below .400. In the 1927 AL, only the Yankees were above .600 and only two teams were below .400. So, in this comparison, the 1927 AL was more competitively balanced (I am sure we have never heard that before) and results in a lower standard deviation.
This lower deviation subsequently results in a season-sweep probability of 0.0192, considerably less than 1909’s. However, like the 1909 NL, 111 seasons of 1927 AL would result in a very high probability of a 22-game sweep. This is not quite the case for the 1937 NL. While the 1937 NL had two teams above .600 and two teams below 0.400, the spread was tighter. In fact, the top team was only 0.625 and the last-place team was 0.364. With 111 seasons like the 1937 NL, the probability of a sweep is much less than 50%.
So where are we? Some seasons produce a high likelihood of sweeps while others produce hardly any chance. Using these near-sweep seasons as our test sample is probably not reasonable, simply for the fact that they produced matchups resulting in 21-1 records.
Yet it is important to point out that collectively these four league seasons alone had a 1 in 10 chance (0.0996) of producing at least one season sweep. And, we still have to account for another 107 league seasons. One can reasonably assume that at least some of those other seasons will have high standard deviations. Any additional poor competitive balance seasons would contribute heavily to the chances of a sweep occurring, thus supporting my initial hypothesis that a 22-game sweep should have occurred.
With four seasons already accounted for, the next step was to examine the remaining 107 seasons of data. Examining each season’s records proved informative. The standard deviations of unadjusted Win% for all 111 league seasons ranged from 0.049 to 0.159 with an average of 0.101. As it turns out, the highest standard-deviation season was the 1909 NL! (With my sample of four containing an outlier, my hypothesis was in jeopardy.) In that season, the difference between the first- and last-place team’s Win% was .430 or 65.5 games back.
This was not the largest differential. That occurred in the 1906 NL, with the Cubs having a .439 differential over the Beaneaters (Braves), who were 66.5 games back. The smallest deviation (.049) occurred in the 1915 NL, where the Phillies’ differential over the Giants was only .138, a mere 21 games back.
These extreme seasons produced a season-sweep probability of 0.0757 for the 1906 NL and 0.00013 for the 1915 NL, a difference by a factor of 582. Unfortunately, I was disappointed to learn that the average single-season sweep probability was under 1% at 0.0088. With a low average single-season sweep probability coupled with an outlier as part of my test sample, I knew that the likelihood of at least one 22-game sweep occurring over 111 seasons was no longer a statistical guarantee.
Over the 111 league seasons, the probability of at least one 22-game season sweep occurring turned out to be 0.6288, nearly a two in three chance. Although a far cry from a statistical sure thing, a 22-game sweep was more likely to occur than not. Therefore, I can still conclude that I am “somewhat” surprised that a 22-game sweep did not occur.
Revisiting Sweep Probabilities
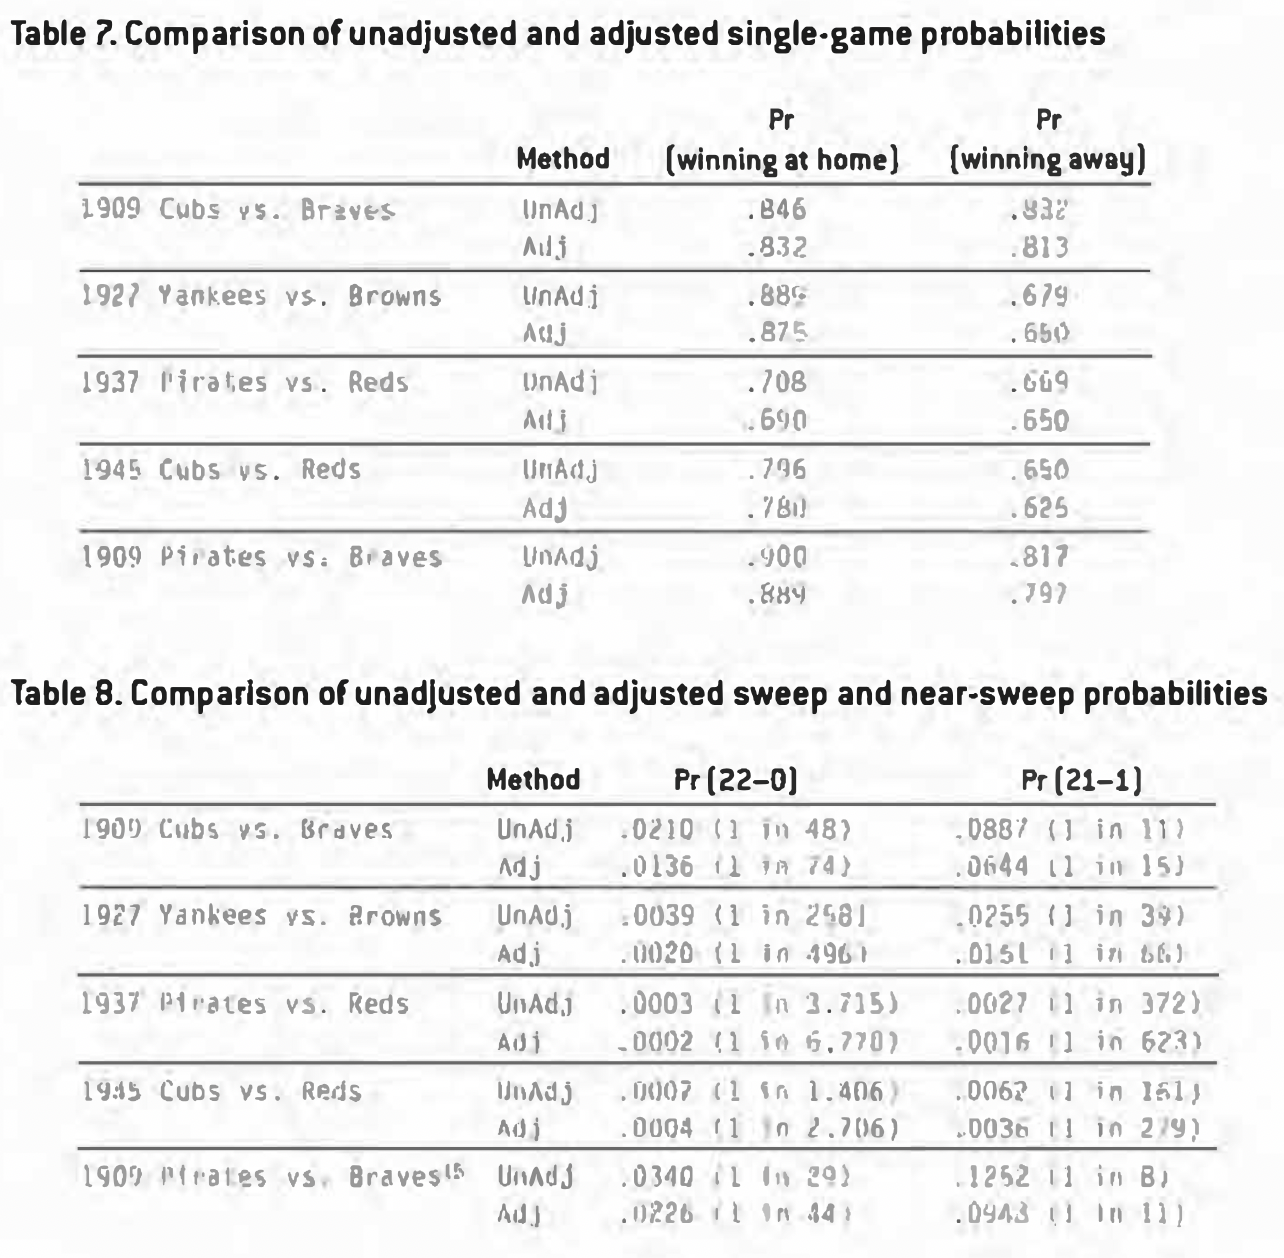
Since my initial team vs. team sweep probabilities were based on the log5 method using actual Win% as shown in Tables 2, 3, and 4, I recalculated these probabilities using adjusted Win% and maintained the home-and-away ratio of wins in order to make an “apples to apples” comparison. The results are shown below in Tables 7 and 8. In Table 7, the win probability for each series decreases only about one or two percentage points. However, this relatively small decrease dramatically impacts each team’s sweep probability, as seen in Table 8.
Summary
Between 1904 and 1961, despite a roughly two in three chance, no team ever swept a 22-game season series. Only five teams came close to accomplishing such a feat. Even after expansion, when season series were reduced to 18 games, no team achieved an 18-0 sweep. It was not until 1970, one year after schedules included 12-game series, that a sweep occurred. Amazingly, only nine teams since 1900 have swept a season series of 10 games or more. While today’s schedule, with several smaller-length series, has produced numerous season sweeps, very few are noteworthy. Yet today’s schedule does include 19 games against division rivals, so maybe, just maybe, we might witness a season sweep of significance in our lifetime.
Caveats
It is important to note that when performing these types of calculations, several assumptions have to be made. Some more implicit than others. For example, we do not really know the probability of team A winning vs. team B. We use each team’s record to estimate such a probability, but it is still just an estimate. In this research, this estimate is taken a step further as each team’s record is adjusted or “normalized” to account for scheduling discrepancies between teams. The approach I took is a reasonable one, but others also may be just as reasonable.
Some teams match up better or worse against certain teams. That fact is evident in this research by examining the 1937 Pirates, who were a sub-.500 ball club that happened to win 21 out of 22 games against one of their opponents. The 1927 Yankees beat up on the Browns, losing only once, but managed to lose four games (I almost said “four times as many”) against a Red Sox team that was 8 1/2 games behind the Browns. There are examples like this every season, but we assume each team’s record is reasonable to estimate head-to-head probabilities.
Another “leap” is that we assume the head-to-head probability is constant. That is, we assume the 1927 Yankees’ probability of winning at home vs. the Browns is 0.875 (from Table 9) for all 11 home games. In reality, there may be several factors that cause this figure to deviate: travel schedule preceding a series (especially pre-airlines), injuries, illness, etc. Would the Yankees’ probability of winning be affected if Ruth sat out a game in 1927 against the Browns (he played in only 151 of 154 games that season)? Finally, the starting pitchers may have the largest impact on game-to-game probability deviation. Maybe the Yankees’ Win% against the Browns would be 0.892 over 11 games, but depending on the pitching matchup, it might be .900 one day, .700 the next, .500 the next, and so on.
Even if we could agree on all the factors to include, I doubt we could agree on the proper adjustments for each factor affecting a team’s chances. SABR research on DiMaggio’s hitting streak sheds further light on many of the factors involved and the subsequent difficulty of such estimates. In reality, the true probability of such events will never be known. Yet we should be able to accept such estimates knowing that their precision is based on a reasonable set of assumptions.
That said, I thought it might be worthwhile to point out how these estimates are affected by even small changes in the assumptions. Consider the following:
- Team A has a 0.600 probability of winning vs. Team X every game (constant probability).
- Team B’s overall probability of winning vs. Team X is also 0.600, but each game alternates between 0.700 and 0.500.
The probability of winning back-to-back games is 0.360 for Team A and 0.350 for Team B – not much difference between the two. However, consider a 22-game sweep: Team A’s chances are 1 in 76,000 and Team B’s chances are 1 in 104,000. That is much more significant. The point is that each change, while relatively small as an individual change, becomes amplified over repeated calculations.
Acknowledgments
Special thanks to David Smith, Phil Birnbaum, Ray Ciccolella, Abba Krieger, Alice Muehlhof, David Paulson, and Marc Alan Jones.
Sources
Retrosheet
Sinins’ Sabermetric Encyclopedia
Total Baseball 8th edition
Proquest
Notes
1. Unlike the other series listed, the Dodgers (West] and the Pirates (Central) are in separate divisions.
2. The San Diego Padres record was actually worse at 61-101.
3. The Boston Red Sox record was worse at 51-103, but they managed a few additional wins to finish with a 4-18 record vs. their former pitcher’s new team.
4. Finished third, 10 games back of the Giants.
5. The Philadelphia Phillies finished 15 games below the Reds in last place at 46-108.
6. Pr(A wins at home vs. B) = ({A HomeWin%) x (B AwayLoss&] / [(A HomeWin%) x [B AwayLoss%)] + [(A HomeLoss%) x (B AwayWin%))
7. Although the above long-hand probability calculations are not difficult, the binomial distribution function, found in any introductory Statistics textbook, simplifies the process further and is available in standard spreadsheet programs. However, the home and away split does add a few extra steps to the normally straight-forward formula.
8. The probability of a 20-1 record equals .1440 0r about 1 in 7.
9. As a point of reference, I included probabilities for a .500 team vs. another .500 team.
10. Ciccolella, Ray, “Log5: Derivations and Tests”, By the Numbers, August 2004.
11. Adjusted Win% = Win% + [[0.500 -Win%] / N) where N is set to minimize the error. Rather than use a fixed N for all seasons, I calculated the N that minimized each season’s sum of squares error. For most of the seasons, I found N=10 minimized the error, but N ranged from 8 to 16.
12. Ciccolella’s procedure reduces the log5 probability error by a factor of nearly 200.
13. Standard deviation is a statistical calculation used to measure the amount of spread within a set of data relative to the average. The higher the deviation, the larger the spread. In this case, higher standard deviations indicate large differences between teams’ winning percentages; i.e. poor competitive balance.
14. Incidentally, prior to using Adjusted Win%, the probability of a sweep occurring exceeded 0.800.
15. The probability of 20-1 after adjustment is now .1111 or about 1 in 9.