

The Truth About Pete Rose: Why You’d Rather Have Minnie Miñoso On Your Team
This article was written by Philip Siller
This article was published in 2000 Baseball Research Journal
Pete Rose’s reputation is built on two pillars: he has more hits than any player in history and he helped his teams immeasurably with his hustle. The first is a fact; the second is a complete misimpression. Rose was not much of a hitter and only an average offensive player. He didn’t create runs, he didn’t get on base much, and he was a liability on the base paths and in the field. Among players with 3,000 career hits — the standard for elite hitters — he doesn’t measure up. Outside that group, he merely holds his own with leading, but not dominant players.
When Rose was driving for the number one spot, he attracted a lot of attention. After all, at that time only Ty Cobb had more than 3,800 hits and only Cobb and Henry Aaron had more than 3,650. Since Cobb was a legendary hitter, with the highest lifetime batting average in history (.366), passing Cobb represented great hitting to a lot of casual fans and content-hungry media types. But the truth is, Pete Rose is the second worst 3,000-hit man ever and, over all, a merely average offensive player.
A close study of Rose’s career reveals that his specialty was volume. He collected games, at bats, and singles at an unprecedented rate. And he kept it up for twenty-four years. But, as many argued during his heyday, Pete Rose contributed very little to his teams’ ability to win. The facts show that Pete Rose simply did not make his hits count. The most surprising outcome of this study is that Rose, known for scoring runs and racking up hit totals, was not exceptional in turning his hits into runs, either through scoring himself or through RBIs. To paraphrase Shakespeare, Rose provided a lot of sound and fury signifying very little.
3,000-Hit Players
To date, twenty-two major league baseball players have amassed 3,000 career hits.1 Seventeen of them played the bulk of their careers before 1920, which is the watershed for batting performance. Here is the list:
Post-1920
- Pete Rose
- Henry Aaron
- Stan Musial
- Carl Yastrzemski
- Paul Molitor
- Willie Mays
- Eddie Murray
- George Brett
- Paul Waner
- Dave Winfield
- Cal Ripken Jr.
- Tony Gwynn
- Rod Carew
- Lou Brock
- Wade Boggs
- Al Kaline
- Roberto Clemente
Pre-1920
- Ty Cobb
- Tris Speaker
- Honus Wagner
- Nap Lajoie
- Eddie Collins
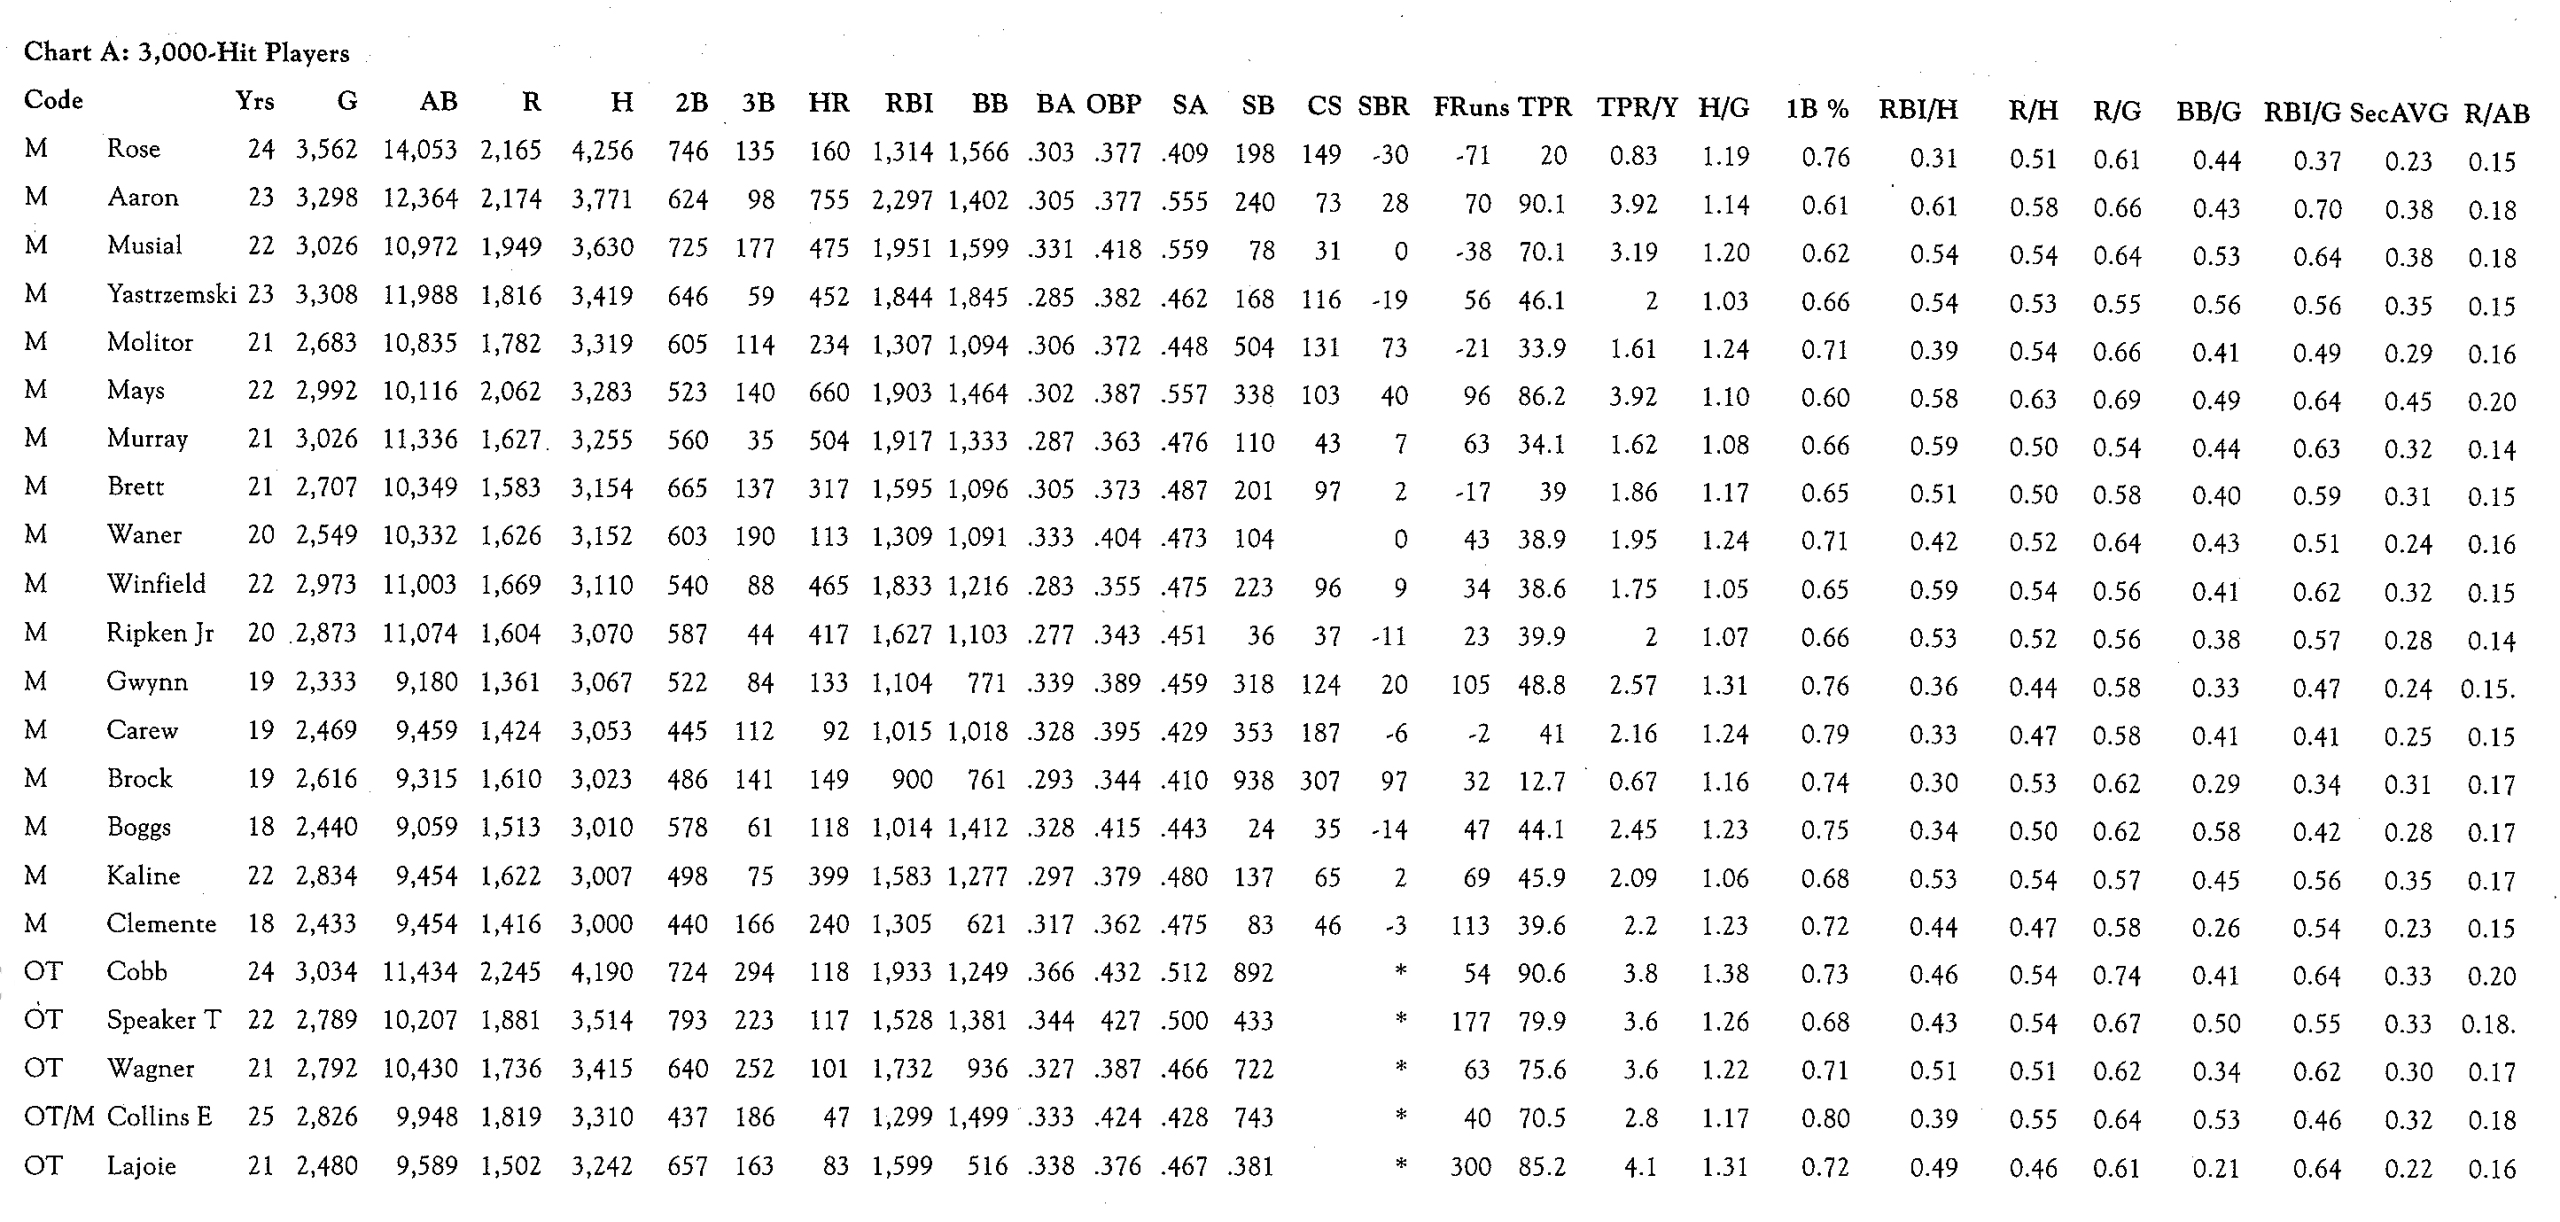
See Chart A for raw stats.
(Click image to enlarge)
Pete Rose was by far the greatest collector of hits in the history of the game, with 4,256. Among modern players, 485 hits separate him from Aaron, the number two man on the list. To find that big a gap behind Aaron, you have to go to number six on the list, Willie Mays, with 3,283.3
The best way to sum up Pete Rose’s career is to acknowledge that he was the greatest singles hitter of all time. 75.54 percent of his hits were singles. That makes 3,215 singles and very little else. Among 3,000-hitters, only Tony Gwynn (78.74 percent) is worse, and only Rod Carew (78.74 percent) and Lou Brock (74.33 percent) are close to this miserable standard.4 Yet all three had higher slugging percentages.
Rose’s weak bat shows up, of course, in the slugging stats. He and Lou Brock share last place on the list of modern and old time 3,000-hit men, at .409 for Rose and .410 for Brock. Only Carew at .429 and Boggs at .443 are close. Molitor’s SLG is .448 and Ripken’s is .451. Everyone else is at or over .460.
Rose was also a weak RBI man: he and Boggs are the only 3,000-hit players with fewer RBIs than walks.5 Among the moderns, he and Brock are lowest in RBI per hit (0.30). Even Carew and Boggs (10 percent) and Gwynn (20 percent) are better. Nine are over 0.50 and the other four are at or above 0.40. The RBI per game stats are even worse. Of the seventeen, Rose and Brock are below 0.37, five are over 0.60, six others are over 0.50 and four others above 0.40.
Big deal, Rose’s devotees reply. So what if he didn’t hit with power? He got on base a lot and helped his team in other ways. Well, let’s see if that’s true. In on-base percentage Rose and Aaron are tied for ninth among 3,000-hit players at .377. Behind them are Brett, Molitor, Murray, Clemente, Winfield, Brock, and Ripken. All of them except Brock hit with significant power. Rose did not. For modern 3,000-hitters, Rose is in the bottom half in OBP. He was not exceptional among this group.
On batting average, he fares little better. At .303, he ranks tenth, in the bottom half, virtually tied with Aaron and Mays, and 10-20 points ahead of Brock, Murray, Winfield, Yastrzemski, and Ripken. Four of those seven were huge power hitters. The others, except for Brock, had good power. All the old-timers also out-hit Rose. He is eighth among modern 3,000-hit players in hits per game and runs per game, and in the lower half if the old-timers are included.
But, his devotees cry, he was Charlie Hustle! He made up for these weak offensive numbers in little, intangible ways, working hard in the field and on the base paths. Well, the numbers don’t show this either. Using Thorn and Palmer’s measurement for Fielding Runs6 and Stolen Base Runs,7 Rose does not look very good. In Fielding Runs, his rating is -71. Every other 3,000-hit player is in positive territory, except Musial (-38), Molitor (-21), Brett (-17), and Carew (-2). This is an interesting stat, since it is the sluggers you would expect to contribute little in the field. Clemente’s rating is +113, Mays’ is +96, and Aaron and Kaline are at +70 and +69 respectively. Yastrzemski contributed as many runs to his team through his fielding as Rose lost for his teams in the field.
Charlie Hustle? The stolen base stats are even worse. At -30, Rose is dead last in Stolen Base Runs among modern 3,000-hitters. The next worst is Yaz at -19. Clemente, Musial and Kaline are close to zero, with sluggers like Aaron and Mays at +28 and +40, respectively. Of course, Brock is off the chart at +97.
Rose shows up particularly poorly on “combination” stats that attempt to capture a player’s overall accomplishments. Thorn and Palmer have developed Total Player Rating, which is a seasonal measure and can be positive or negative. For careers, they total the annual TPR. Among 3,000-hitters, Rose is next-to-last at 24.7 for his career. (Brock is lowest at 12.7.) None of the others is close to Rose. Twelve players cluster from 39 to 50. Musial is at 70, Mays at 86, and Aaron at 90.8 On an average basis, Rose’s rating is abysmal: he averages 1.0/year, lowest except for Brock, while Molitor, Murray, Winfield, Brett, and Waner range from 1.65 to 1.95. Everyone else is over 2.0, with Aaron and Mays at 3.9 and Musial at 3.2.
Bill James uses Secondary Average (walks plus stolen bases plus extra bases, divided by at bats), a very powerful stat measuring the things a player does beyond his batting average.9 For their careers, Mays, Aaron, Musial, Yaz, and Kaline are over .340. Rose is last at .232. Finally, although he ranks third in the group in Runs Produced (runs scored plus runs batted in minus home runs), he ranks last in runs produced per hit and per at-bat, and next-to-last (ahead of Brock) in runs produced per game.
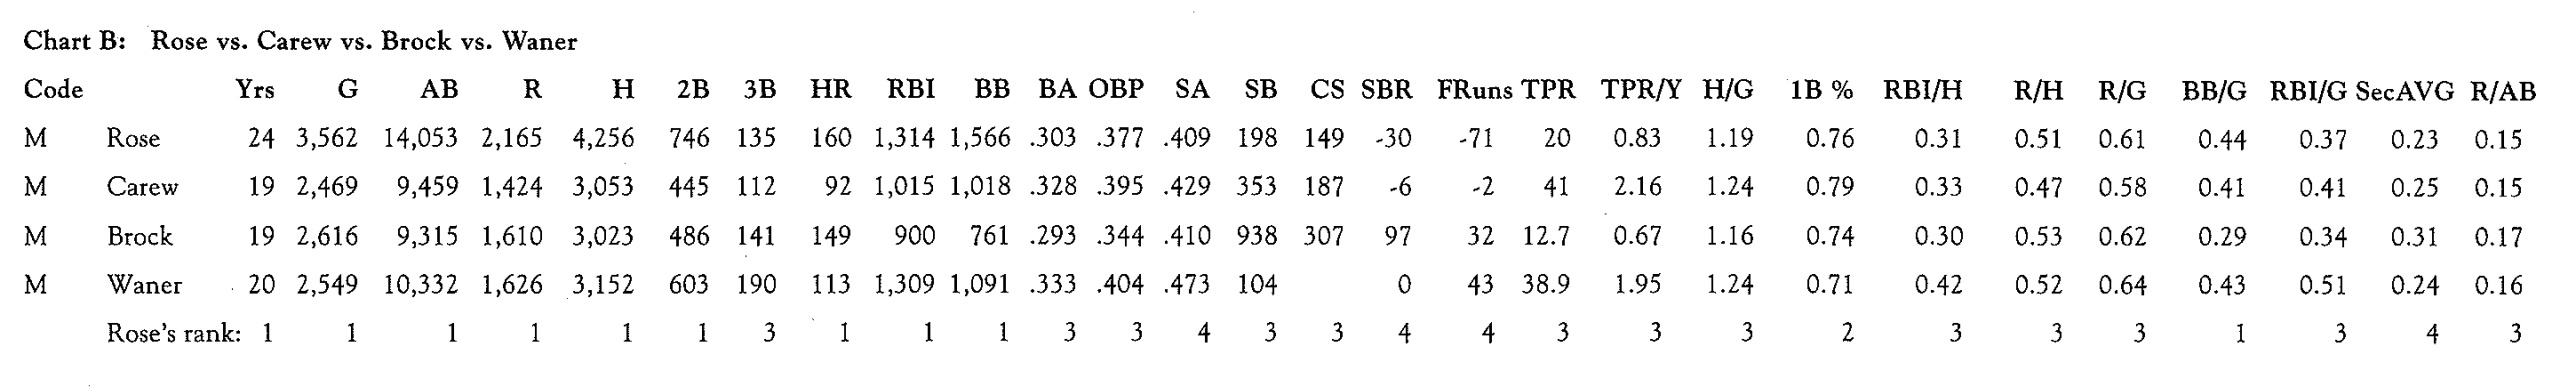
Among 3,000-hit players, Rose’s closest comparable is Brock. Carew and Waner, who might be considered lightweights among 3,000-hit players, dominate Rose in most categories, even those involving hits and runs, for which Rose became famous. See Chart B.
(Click image to enlarge)
Rose among his peers
Despite his 4,000 hits, it is clear that Rose (together with Brock) is out of place in the company of career 3,000-hitters. Whether they hit for average or for power or both, the offensive impact the others had on the game was in a different universe. Let’s be fair, though. This group of seventeen players is tough competition. Rose deserves to be compared to other leading players generally.
Pete Rose holds some impressive places on the all-time lists: first in games, at-bats, and hits; second in doubles; fourth in runs scored; sixth in total bases; eighth in Runs Produced;IO eleventh in walks and Runs Created;ll seventeenth in extra-base hits; and sixty-fifth in RBIs.12 But it must be noted that these are all purely volume related accomplishments, products of Rose’s extraordinary longevity. He played for twenty-four years, racking up 3,562 games and 14,053 at-bats. These numbers are truly amazing, rivaled only by names such as Aaron, Yastrzemski, Cobb, Musial, Mays, and Brooks Robinson. To put this volume in perspective, consider that Rose had 26 percent more games and 38 percent more at-bats than the number eleven man on each list. The question this study addresses is: How much impact did he have while running up those numbers?
Sad to say, when you get to the impact stats, Rose does not stand out. He is not in the top 100 players all-time in RBI/game, batting average, on-base percentage, slugging percentage, stolen bases, or runs/game. Since scoring runs was one of Rose’s main claims to fame, this last item is startling. He scored 0.6078 R/G, behind Mays, Molitor, Aaron, Musial, Waner, Boggs, and Brock among modern 3,000-hitters.10 The men tied at 100 on the all-time list (Frankie Frisch, Kip Selbach, and Cub Striker) had 0.66. So does Tim Raines. Ron Leflore had 0.67, Roy Thomas 0.69, Dam DiMaggio 0.69, and Tommy Henrich 0.70.11
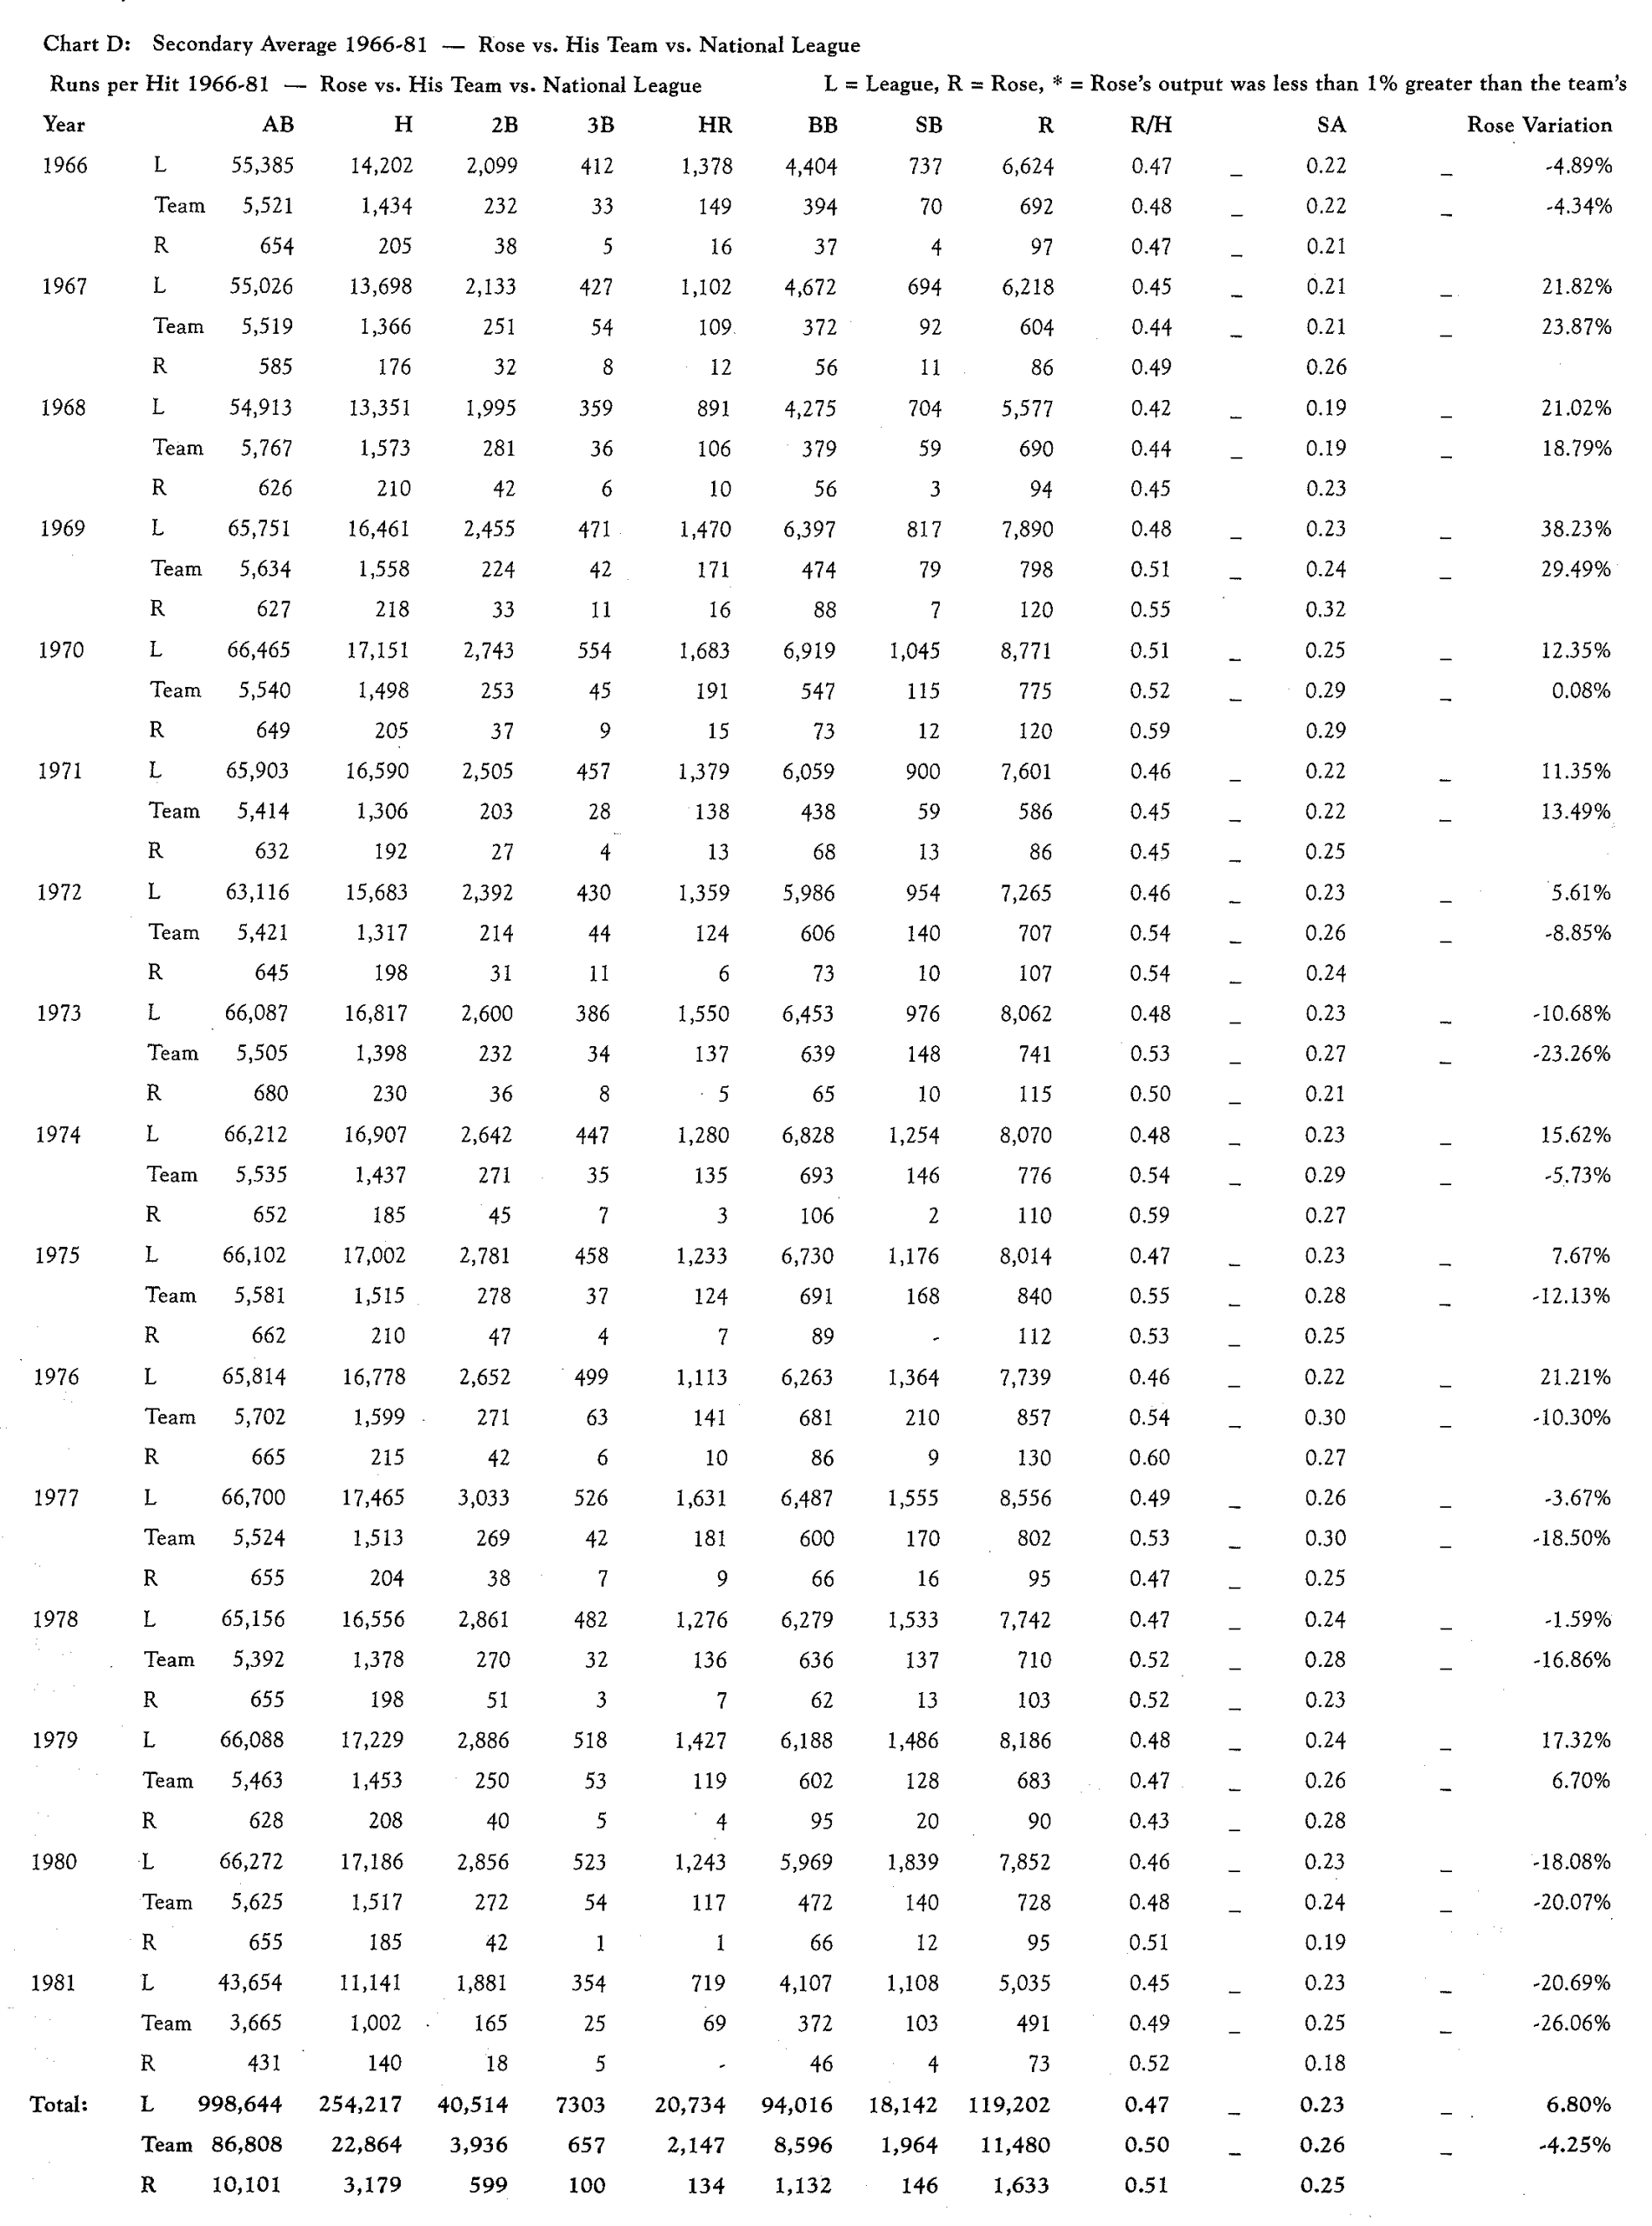
Even more damning is the evidence of Rose’s secondary average, an important impact stat. During his best years, 1966-81, Rose’s secondary average trailed his team’s, which implies that the average player on the team contributed more than Rose did in that area. Worse yet, for seven of those sixteen years, the secondary average for the entire league was better than his.12 This is like saying that a supposedly great hitter for average batted less than his team average and less than the league average 45 percent of the time. Over the entire period, Rose was five percent worse than his teams as a whole and only seven percent better than the league as a whole. A seven percent gap is not outstanding: it’s like batting .278 in your prime, when the league is batting .260.13
The runs/hit data yield similar results. Rose was no better than the rest of his team in runs/game for seven of the seventeen years. For the whole period, he outproduced his team average by only 2.7 percent.
The facts show that Rose neither scored nor batted in runs with any frequency, did not get on base exceptionally, seldom hit for extra bases, and was a liability in the field and on the base paths. Apart from doing these things for a very long time — and hitting a ton of singles — Pete Rose accomplished very little with his 4,256 hits and 3,215 singles. All he did was collect them; he did not make them count. He did not help his teams dramatically. In his time, he was a good player, not a great one, with the good fortune to play on teams that were prodigious run-producers. He certainly should not be considered one of the great players of the century. If you want a couple of terrific players compared to Rose, I give you Minnie Miñoso and Tim Raines.
Minnie Miñoso and Tim Raines
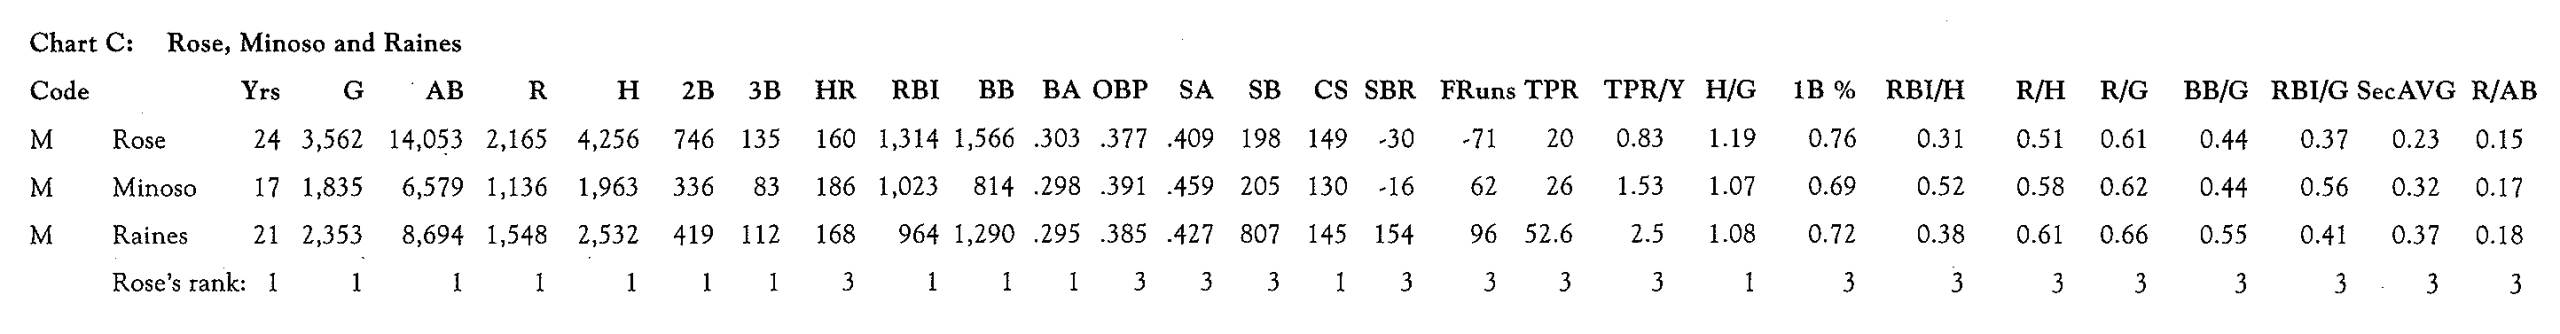
Chart C presents the career stats for Pete Rose and two good ballplayers who overlapped his career: Minnie Miñoso and Tim Raines. As far as I know, no one is clamoring to put either of them on the All-Century Team. But both of them exceed Rose in game-by-game impact in every category.
(Click image to enlarge)
Rose leads the group in batting average at .303, five points ahead of Miñoso and eight ahead of Raines. In all the volume categories (total hits, runs, walks, RBI, doubles, etc., but not home runs), Rose is way ahead. One would expect this of a twenty-four-year man. But in all the impact stats, including those measured on a per-game or per-hit basis, he is way behind. He is last in home runs, slugging, OBP, RBI/hit, and RBI/game. Rose is also last in Stolen Base Runs and Fielding Runs. His Total Player Rating is the worst of the group and, most telling, he is last in average seasonal TPR, where he averaged .83 per year, while Miñoso and Raines were 85 percent and 200 percent better, respectively. The career secondary averages for both men are higher than Rose’s in his best year.
In runs scored, the area in which Rose is usually considered outstanding, he lags behind both Miñoso and Raines in runs/game, although by less than ten percent, and in runs/hit by a whopping 14 percent and 20 percent, respectively. Even during his banner years14-Rose led the league in runs and doubles in 1974, 1975, and 1976, in hits in 1968, 1972, 1973, and 1976, and scored 120 runs in both 1969 and 1970-his runs/hit ratio was 0.518, which ranks significantly behind the ratios of Miñoso and Raines.15
Both these players had careers that were better than Rose’s best years. If you could have signed one of these players and could guarantee that he could play out his entire career for you, Rose would have been the worst choice of the three.
Pete Rose’s amazing accomplishment
Longevity and consistency. Until he made an embarrassment of himself by hanging on to stagger past Ty Cobb’s all-time hits record,16 Pete Rose churned out half a run per hit for over twenty years. His lifetime ratio is within two percent of the ratio for his best years. Now, half a run per hit is not that exceptional, but he did keep it up for a long time.
Rose’s main (and, in my opinion, only) claim to fame is his 4,256 hits. Among modern players, he dominates the 3,000 hit club. But the peculiarity of Rose’s career is that his single-minded pursuit of this goal did not generate collateral offensive contributions to his teams that were outstanding in any particular. The reason the 3,000 hit club is meaningful is that, historically speaking, only great offensive players reach that plateau. Once the plateau was established, however, it became an end in itself for Pete Rose, who put together 3,000 hits with less effect than anyone who preceded (or followed) him, with the possible exception of Lou Brock. Compared to these peers, Rose did not produce runs, did not hit for extra bases, did not get on base much, fielded badly, and didn’t get that many hits per game. Essentially, he was carried by good teams, in relation to whom he was not a particularly outstanding player.
Oh, yes — he did run out bases on balls.
PHILIP SILLER is president of Hexagram & Co., a venture management firm. He lives in Toronto, Canada, and — to his perpetual dismay — roots for the Giants.
(Click image to enlarge)
Notes
1. Unless otherwise noted, all statistics have been taken from Total Baseball (6th ed.), J. Thorn, P. Palmer, M. Gershman, and D. Pietrusza, Eds. (Total Sports, 1999). Up-to-date stats for Boggs, Gwynn, and Ripken are from the Major League Baseball official website (www.majorleaguebaseball.com/u/baseball/mlb/players).
2. The list does not include Ted Williams who had 2,654 hits in 19 seasons. Since he was averaging around 180 hits per season during the WWII years and somewhat less in the years he missed for the Korean War, he probably would have added 800 to that total and finished with around 3,500. Adding him to the list of 3,000-hit players would only strengthen the points made in this essay.
3. Mays is number 10 on the full list.
4. Eddie Collins’s percentage is 79.76 percent. I am not a big fan of Collins, but it is easy to prefer him to Rose. His OBP was almost 50 points (12.5 percent) better than Rose’s and he hit 30 points higher (IO percent). In the field, Collins was worth 40 runs more than the average player at his position; Rose cost his teams 60 runs. And so on and so forth.
5. OK, Carew had 1,018 walks and 1,015 RBIs. Rose had 20 percent more walks than RBIs.)
6. Basically, how many runs a player saves his team in the field compared to an average player at the same position.
7. Again, the number of runs contributed by the player beyond what a league-average base stealer might have gained. I don’t claim that Stolen Base Runs or Fielding Runs totally capture the intended effect. But I do believe they are meaningful data and are certainly useful for comparison among supposedly outstanding players.
8. For those interested, Ruth is at 105, Cobb at 90, Williams at 98, Lajoie at 85, Tris Speaker at 80, Mike Schmidt and Rogers Hornsby at 77, and Honus Wagner at 75. With Aaron and Mays, these players round out the top ten. All seventeen 3,000-hitters are in the all-time top 35 except for Brock and Rose, neither of whom makes the top 100!
9. “As it happens, the league Secondary Average in most seasons will be about the same as the league batting average — about .260. But individual totals will swing Wildly, which is what makes it interesting.” Whatever Happened to the Hall of Fame?, James, B. (Simon & Schuster, 1995), p.69.
10. Total Baseball, J. Thorn and P. Palmer, Eds. (Warner Books, 1989). The 1999 edition does not contain this list. For the years 1961-76, Rose was eighth in runs/game, ahead of Kaline and Carew and behind Mays, Bonds, Aaron, F. Robinson, Dick Allen, Morgan, and Brock, in that order.
11. I do not put a lot of stock in the top 100 in this category. Old-timers dominate the list. But the great modern hitters for average and power are there. For careers ending before 1989, the list includes Gehrig (12), Ruth (14), Rolfe (31), DiMaggio (32), Williams (37), Gehringer (43), Foxx (44), Greenberg (46), Cobb (51), Mantle (72), Mays (79), Ott (84) and Bobby Bonds (85). (Total Baseball, Thorn, J. and Palmer, P., Eds. (Warner Books, 1989))
12. See Chart D.
13. Considering that the variation in secondary average across the league runs as high as 100 percent on the upside, these deviations must be taken as pretty trivial.
14. 1968-1979, the years Rose either scored 100 runs or had 200 hits.
15. Note, too, that Miñoso started late: he was 27 years old for his first full year in the majors, and it is likely he exaggerated his youth to the official statisticians.
16. In his final three years, Rose batted .262 and slugged .314, with an OBP of .365. He scored 118 runs on 266 hits, to put him 66 hits past Cobb.