

Time Between Pitches: Cause of Long Games?
This article was written by David W. Smith
This article was published in Fall 2019 Baseball Research Journal
A major topic for MLB and the baseball press continues to be the length of the average game, which has been above three hours for several years. Many factors have been suggested to account for the longer games and I addressed several of these last year by looking at patterns over the past 110 seasons in my paper and presentation “Why Do Games Take So Long?”1 The two strongest connections I found were increases in the number of strikeouts and in the overall number of pitches. One possibility that has received a great deal of attention is the time between pitches and in fact MLB has considered instituting a 20-second clock with the bases empty. At the 2018 SABR convention, Eliza Richardson Malone presented the results of her study of 31 starting pitchers in 2017. Although her data set was limited, her conclusion was clear: she found very few pitch intervals exceeding 20 seconds. Therefore the proposal to force pitchers to throw within 20 seconds would not have a significant impact on game length. But could time between pitches still be a a major factor in why games are so long? With the help of Major League Baseball Advanced Media (MLBAM), I conducted the following study.
Thanks to MLBAM, I have the precise time down to the second that each pitch was thrown in every game in 2018 — with the exceptions of the two games played in Puerto Rico and the three in Mexico — a total of 717,410 pitches. That works out to just under 148 pitches per team per game.
First I need to clarify exactly which pitches I studied. “Time between pitches” is the amount of time after a pitch before the next pitch is thrown. This only applies to consecutive pitches to the same batter. Therefore, the last pitch thrown to each batter does not apply because there is no “next pitch” to him. When these “last pitches” are excluded, the total number of relevant pitches drops to 511,728, which is still an impressive sample size. The overall average interval for all pitches across all situations in 2018 was 23.8 seconds. Of course, there are many interesting ways to subdivide this number.
In addition to the interval between pitches, I studied the time taken for the following:
- Between pitches
- Mound visits
- Between batters
- Between innings
- Substitutions
- Replay challenges
- Injuries
- Ejections
I also looked at the length of each inning since many have reported slower play in later innings.
Table 1 has the basic data for time elapsed after each different pitch result for bases empty situations and those with a runner on first alone.
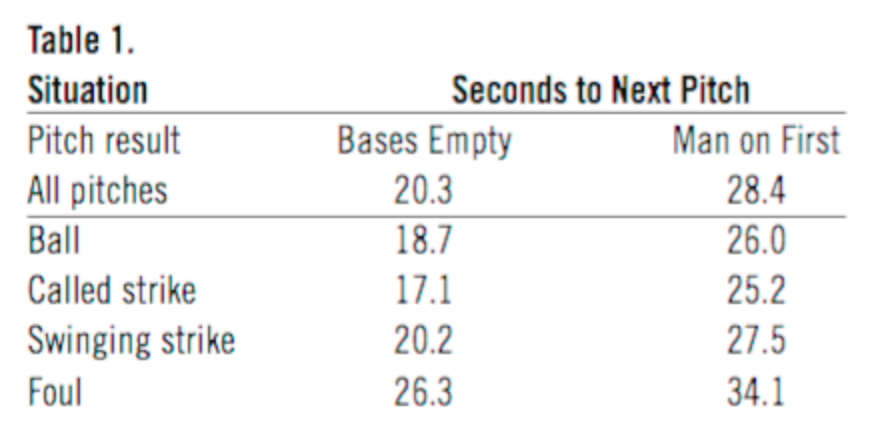
The bases are empty for 58% of all pitches, so the first column confirms Malone’s conclusion that when the ball is not hit, the proposed 20-second clock would solve a problem that doesn’t actually exist. These are averages, so of course some values are less and some more, but overall the bases-empty situation provides little opportunity for a rule intervention to speed up the game; pitchers are already meeting this standard.
Table 1 also shows that the time increases after a foul ball compared to pitches when no contact is made. This is not surprising. Every foul ball results in a new ball being put in play, which takes more time than continuing to use the same ball. There is greater variation here, as well, since a ball fouled at the plate will not slow things nearly as much as a long foul into the stands.
There is a man on first alone 18% of the time and the second column presents the average intervals in this situation. All other situations combined add up to 24% of pitches. It is conventional wisdom that the game slows down when someone gets on base and these numbers certainly support that position. The average increase is 8.1 seconds across all pitch results.
Pickoffs
We must consider another major feature of having a man on first, namely pickoff throws. I documented 11,194 throws to first in 2018, 10,755 by pitchers and 439 by catchers. The pickoffs added an average of 25 seconds to each pitch interval although there was a wide variation. When the overall average time for pickoff attempts is subtracted from the 28.4 second interval for a runner on first, then the time between pitches drops to 22.9 seconds. In other words, pickoff attempts at first account for about two thirds of the increase found with having a runner on first. To complete this thread, the other runner situations differ very little, with a combined effect of adding about 1 additional second to the time for a runner on first only.
Mound Visits
Mound visits were restricted in 2018 for the first time with a limit of six per game for each team. This limit has been reduced to five for 2019. I began noting mound visits in July of 2018. The average time consumed by a mound visit is 81.5 seconds, even though the rules are clear that the visit itself is limited to 30 seconds. The 81 second interval is the actual time between pitches whereas the 30 second clock starts when the manager or coach has left the dugout and does not include the return trip to the dugout, accounting for the wide difference between the rule and the reality. Player visits to the mound are also counted, but the rules do not specify how to time those. If a mound visit ends up in a pitching change, then it does not count against the limited number for the game and I did not count them in my average time.
Time Between Batters
The average time between batters within an inning is 54 seconds. Again this is the time from the last pitch to the previous batter and the first pitch to the next one. I noticed interesting differences in this time for different innings as shown in Figure 1. The horizontal line is the average for all innings to allow easier comparison.
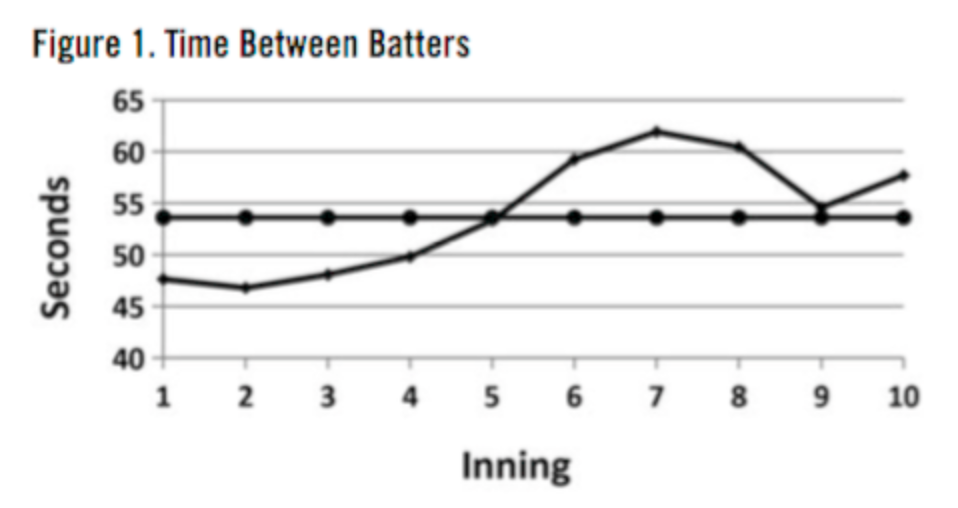
The value is low in the early innings and then it rises with a peak in the 7th to over 62 seconds, which is almost 15 seconds more than the quickest time in the second inning. The increased time in later innings makes sense as the game pressure mounts and it is reasonable for both batter and pitcher to take a little extra time to get ready. All extra innings are combined as 10. The one point that stands out is in the 9th which has a remarkable drop from the 8th and 7th innings. Two years ago in New York I showed that 47% of games had a margin of three or more runs when the 9th inning started and the team in the lead won 97% of those games. I suggest that the drop I found here reflects the reality there is less deliberate preparation by either the batter or the pitcher since so many games are clearly decided by this point. If a game goes beyond 9 innings, then it is reasonable that the time increases since the games are obviously closer.
Time Between Innings
I found the average time between innings to be 2 minutes and 42 seconds. This is interesting in light of the MLB pace of play rules put into effect for 2018 which set different limits based on the nature of the television broadcast of the game, as shown in Table 2:

I did not look at postseason games. According to MLBAM, there were 62 games designated as national television games in 2018 as opposed to 2368 local television games. The average time between innings for the locally televised games was 2 minutes and 41 seconds and for the nationally televised games it was 2 minutes and 55 seconds, a difference of 14 seconds. In any case, the observed times are well beyond the stated limits, especially for the locally televised games. However, we have to consider when the official clock is started at the end of each half-inning. MLB issued very precise descriptions of how the timing is to be done including different starting details when a relief pitcher is entering the game. The average time between innings also changed significantly by inning, as shown in Figure 2.
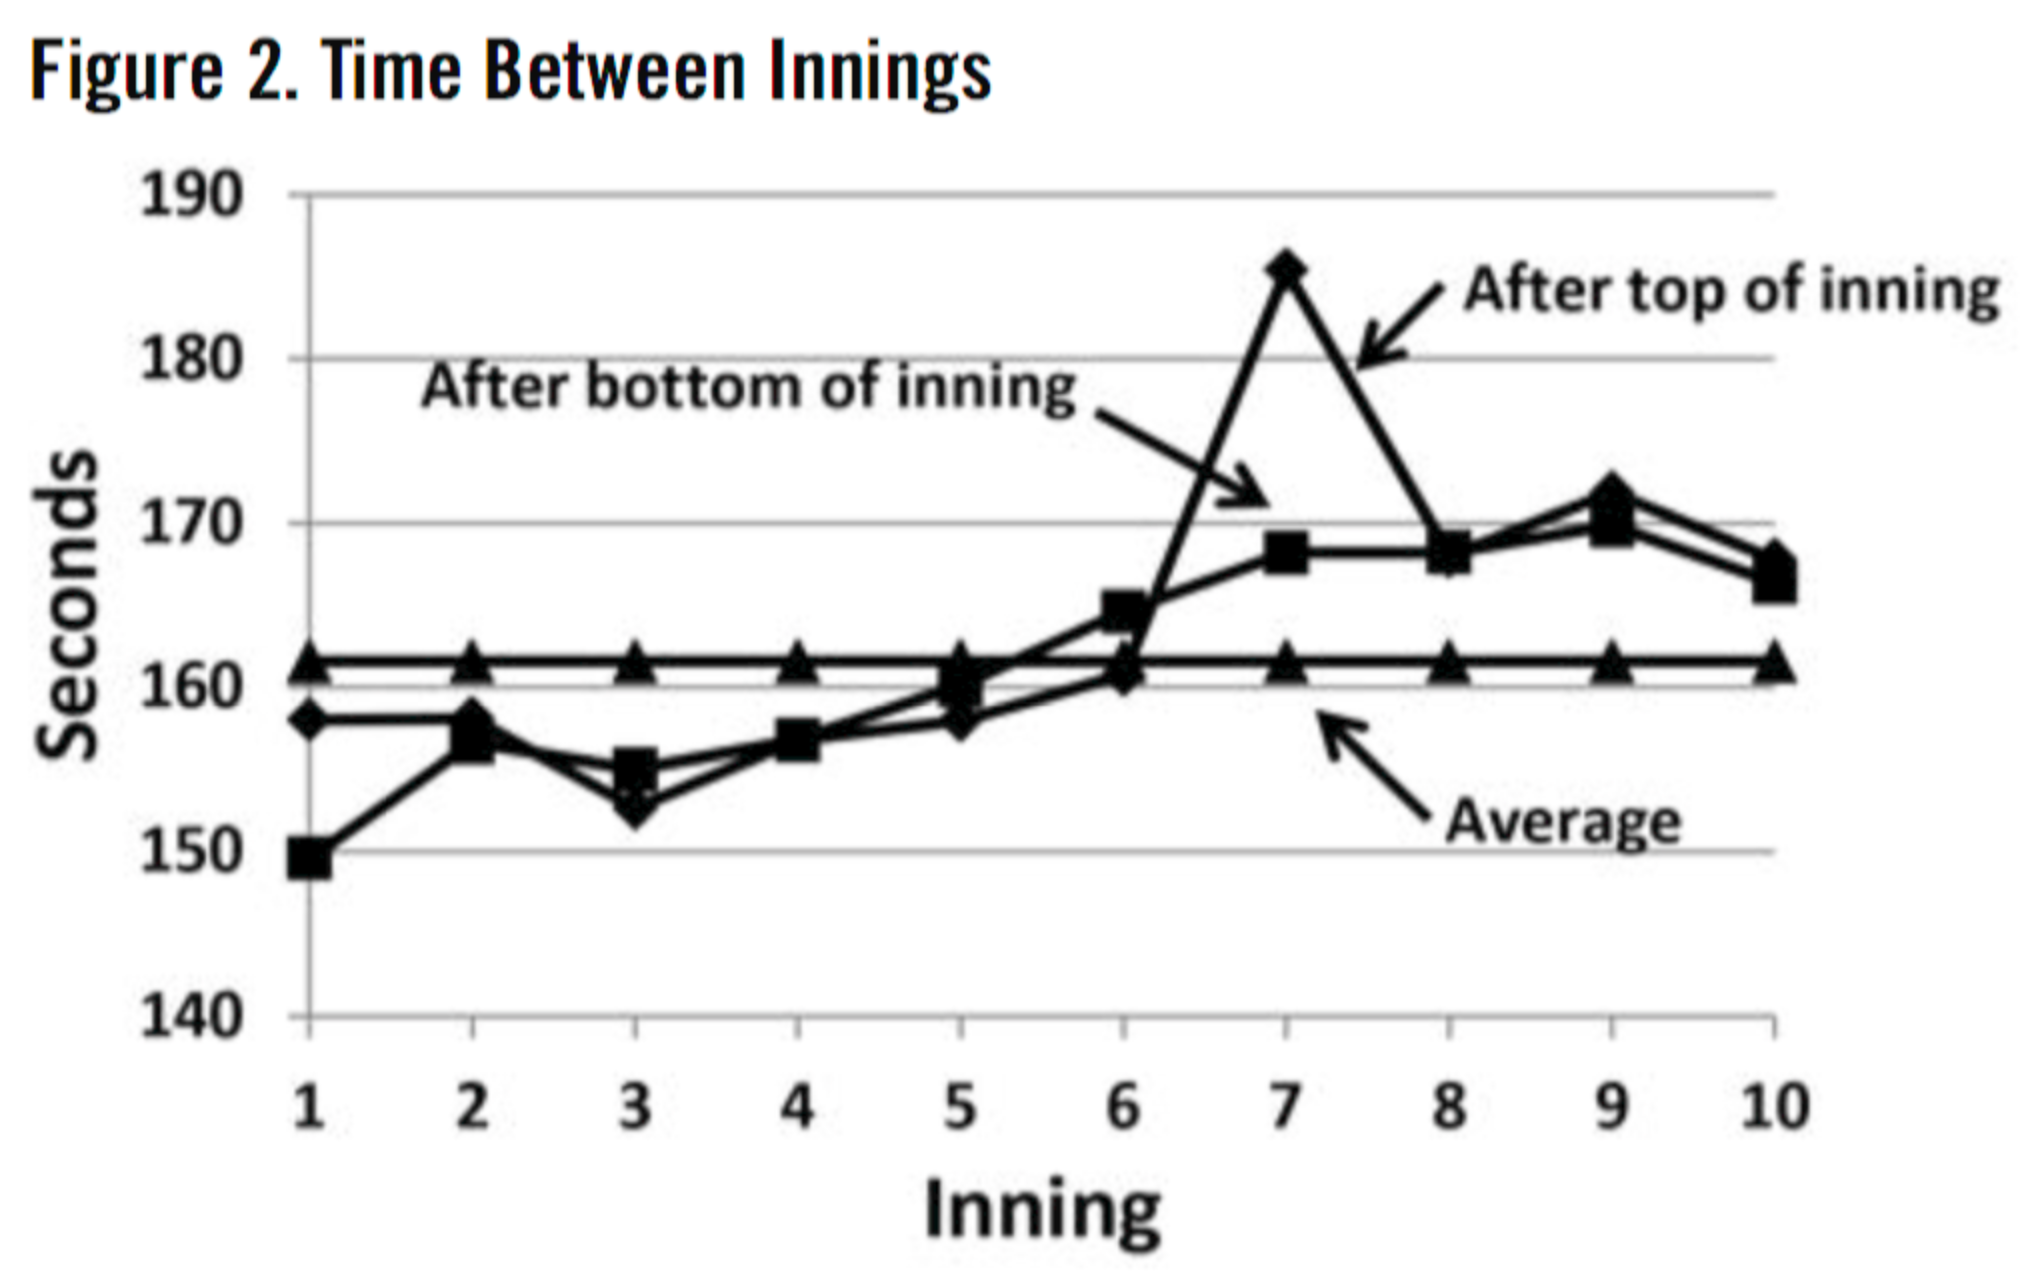
The horizontal line presents the average for all inning changes and the other two lines show the changes after the top and bottom of an inning. There are two striking features to me in this figure. First, the times get progressively longer as the game proceeds just as the breaks between batters do, and second, the break after the top of the 7th inning is much longer than all the others. In fact, it is 17 seconds longer than after the bottom of the 7th. Everyone will immediately realize this reflects the “7th inning stretch,” but there is another wrinkle. You may recall that most teams now play “God Bless America” during the 7th inning stretch at Sunday games. There are three notable exceptions: the Yankees play this song in the 7th inning of every game, while the Blue Jays and A’s don’t play it at all. There were 391 games played on Sundays in 2018, to which I added the Yankees non-Sunday games and subtracted the Toronto and Oakland games. That gave a total of 430 games with God Bless America and 2002 games without it, presumably all of which included the traditional singalong of “Take Me Out to the Ballgame” (except for the Orioles who play “Thank God I’m a Country Boy”). The breakdown for these games in shown in Table 3.
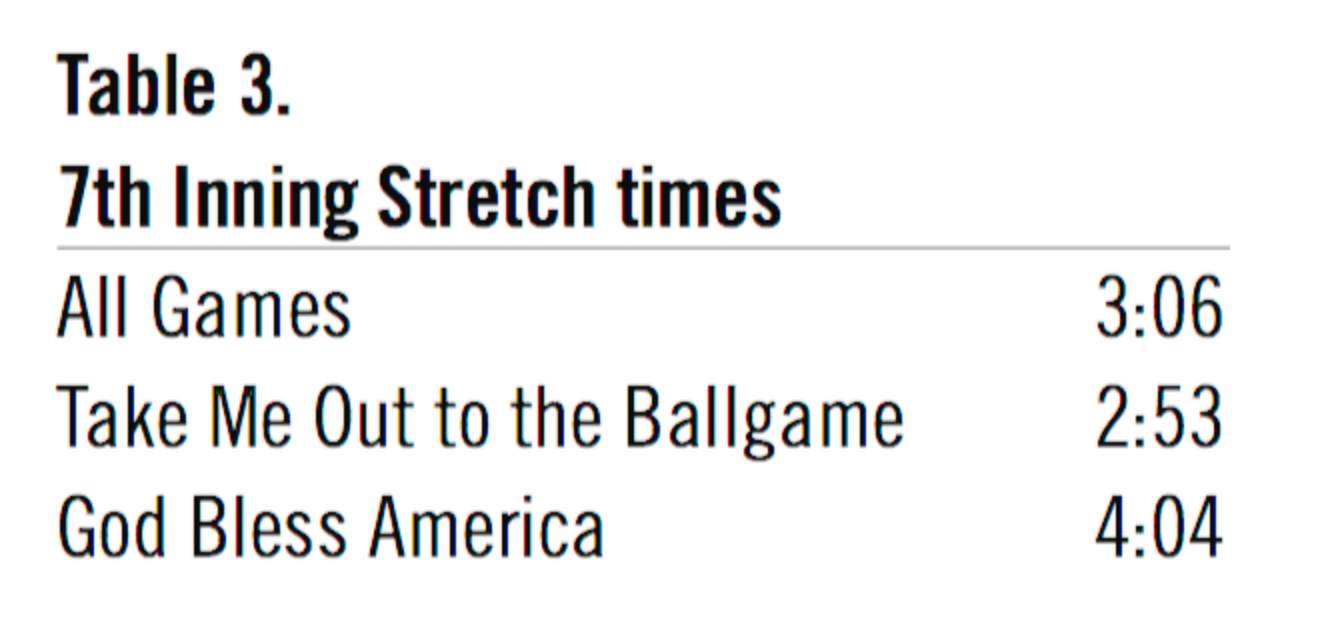
The extra one minute and 11 seconds consumed by “God Bless America” is pretty dramatic since it is played in 17.7% of all games. Once again we need to remember that the times I found are from the last pitch to the last batter of the inning to the first pitch of the first batter in the next inning. However, it is clear that the actual times do not correspond to the carefully prescribed timing procedures promulgated by MLB.
Substitutions
Substitutions are another kind of event that takes extra time, of course. The most common type is a pitcher change. Table 4 has what I considered.
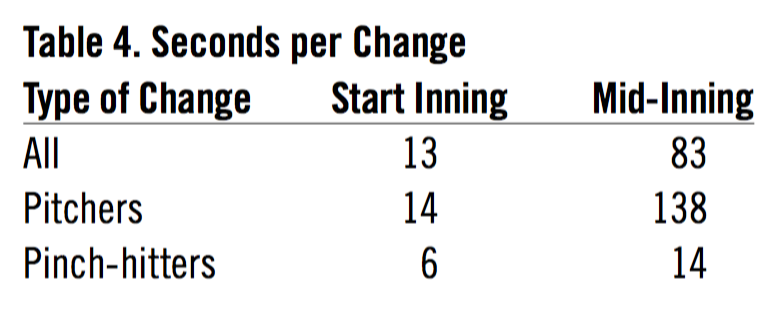
As expected, the mid-inning substitution of a pitcher takes the greatest amount of additional time: over two minutes more than a new pitcher at the start of an inning. One of my surprising results from my previous study is that the number of mid-inning pitching changes has not changed almost at all in the last 25 years, even though the total number of relievers per game has increased steadily since 1975. This is because most pitching changes are made at the inning break rather than mid-inning.
Replay Challenges
We now live in the age of replay challenges and they constitute another significant interruption. MLB reports the time taken for each review but by their definition the timing of the challenge starts when the umpires commit to the review. My numbers again are the actual elapsed seconds before the next batter or pitch. Once again there is a difference between challenges at the end of an inning, the end of a batter appearance or the middle of a batter appearance. These details are in Table 5.
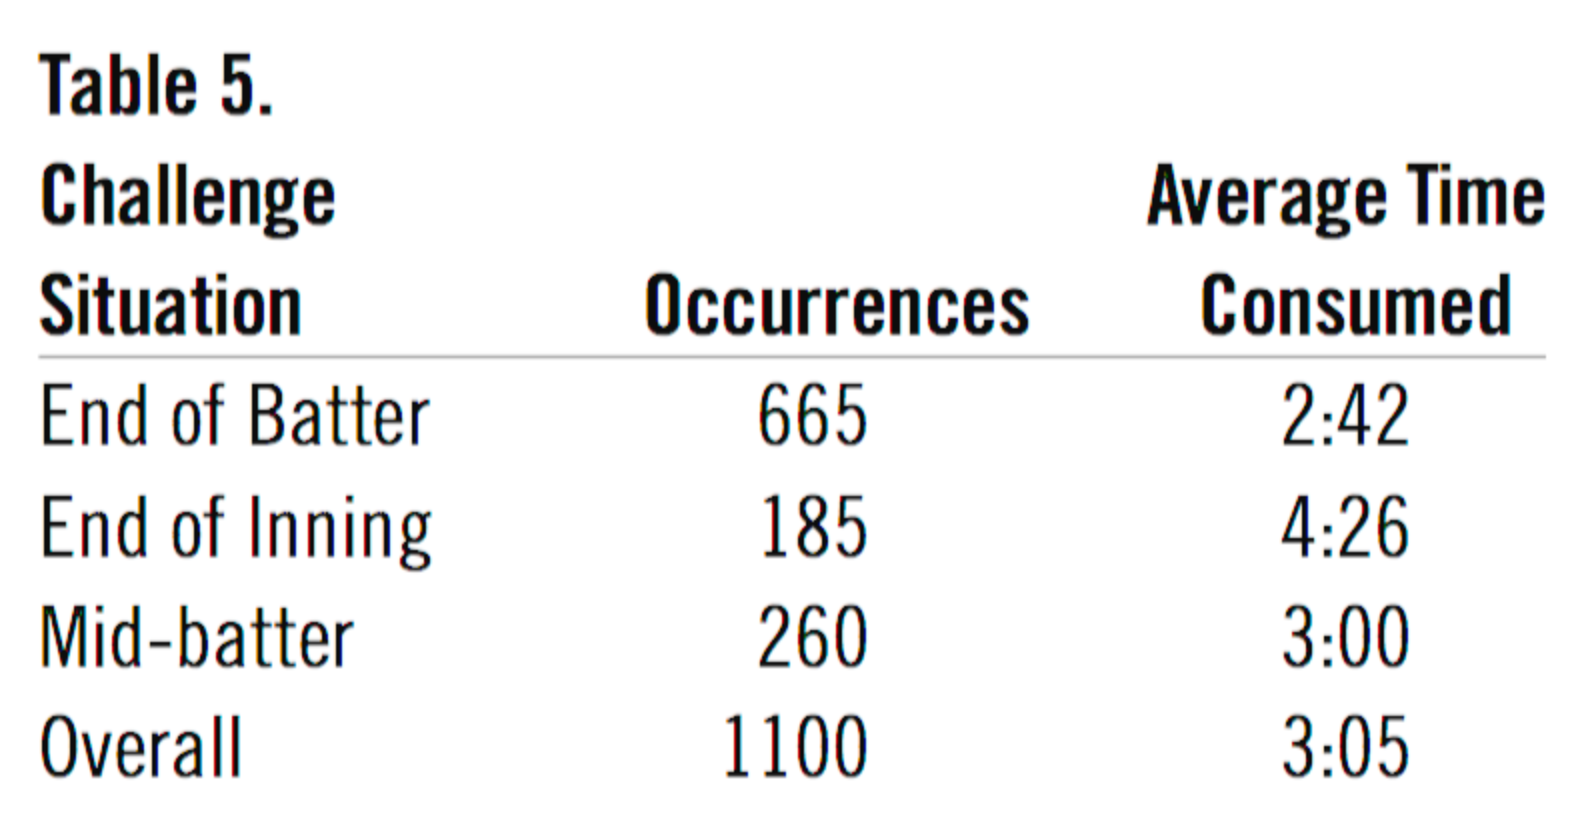
The “End of Batter” and “End of Inning” data have to be looked at carefully, since there is already time consumed by these events. The numbers I report in Table 5 have had these challenge times removed. The properly weighted average for these events is 3:05. MLB reports an average of 1:28. Again, their timing starts with the request and ends with the decision from New York, but my measured average time for the interruption is more than double their reported time.
Time to Play Each Inning
The time taken to play a given inning also changes during the course of a game, partly reflecting pitcher subs, but not entirely. Figure 3 shows the values for each inning from the first pitch of the inning to the last.
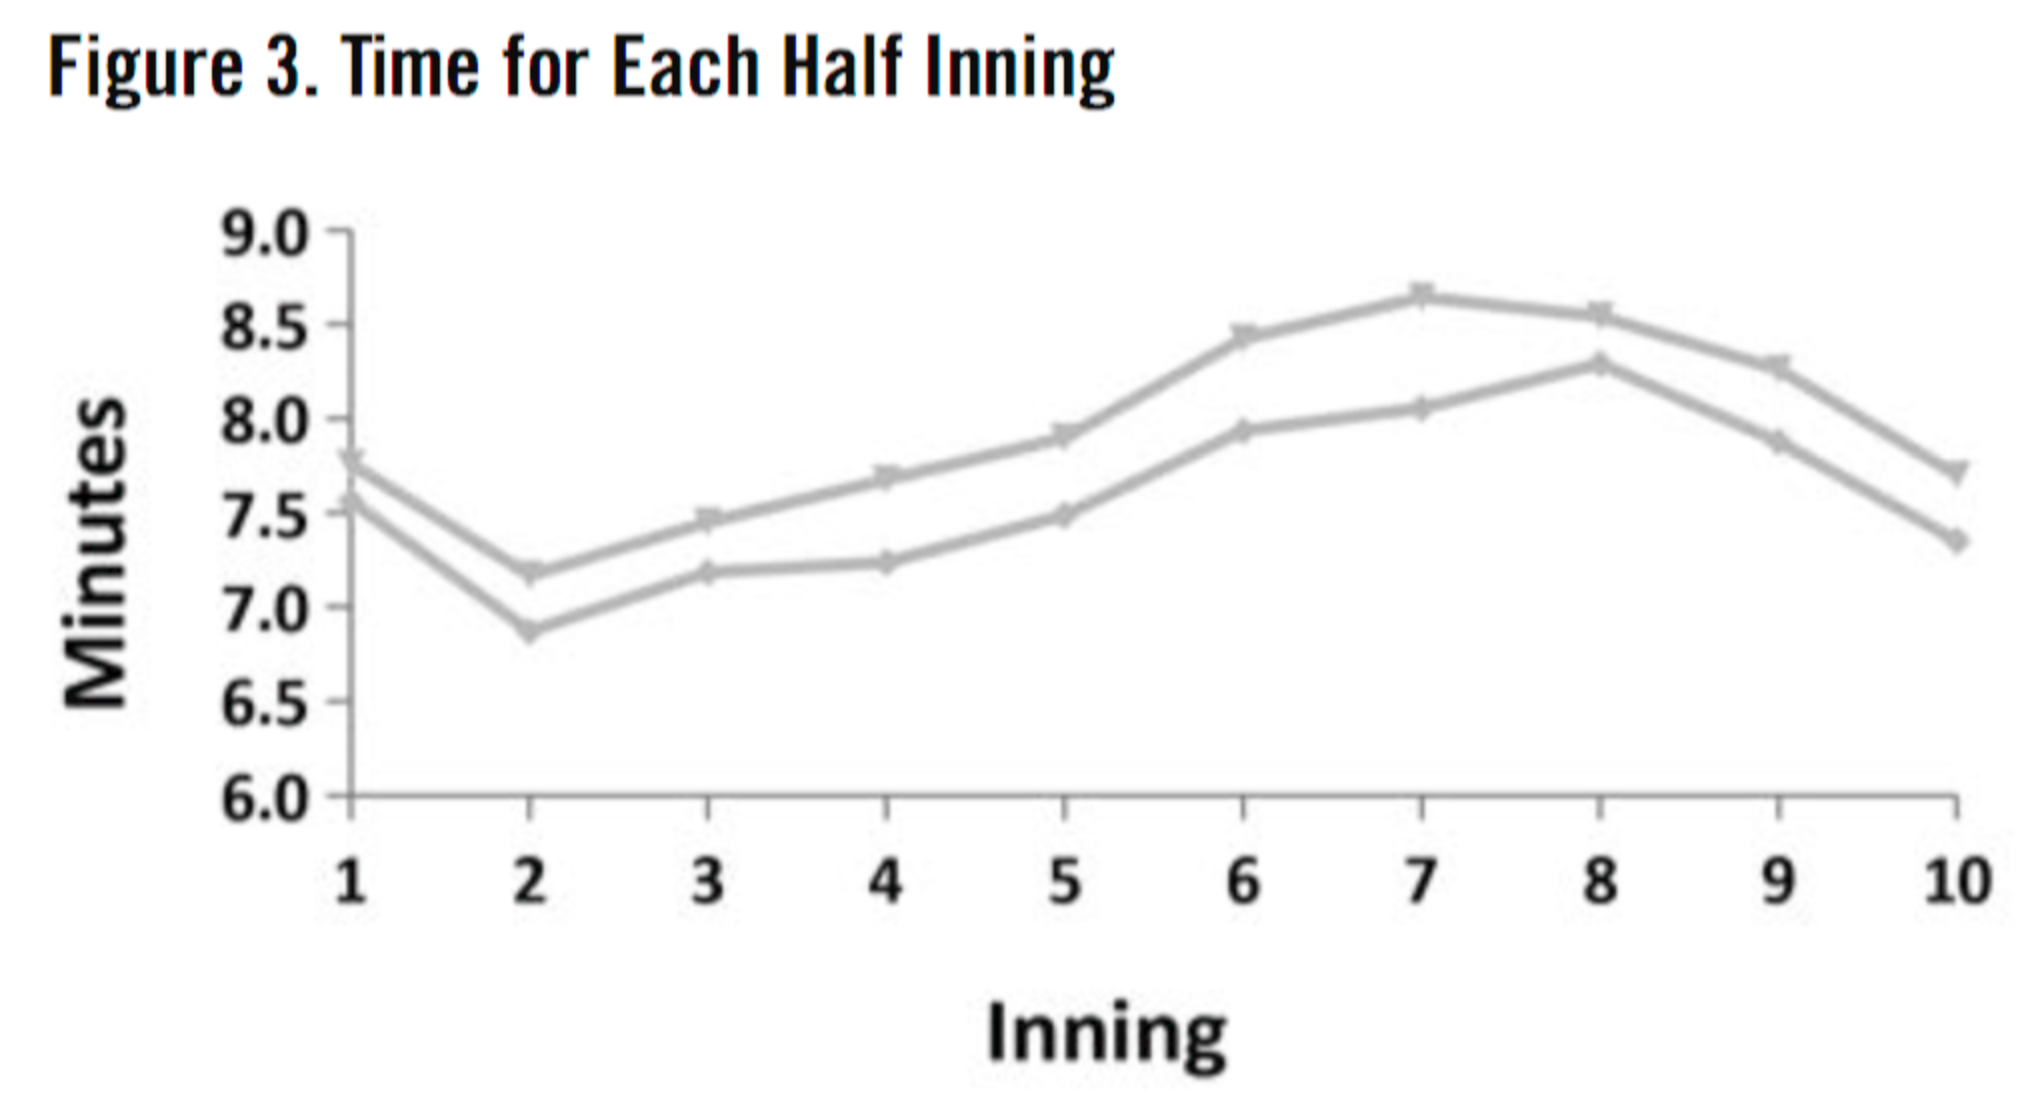
The data for the visiting team are in the bottom line and for the home team in the top line. It is interesting that the home innings take longer on average in all cases, with a difference of 12 seconds in the 1st to 35 seconds in the 7th — an average of 22 seconds. There is a drop of 36 seconds in the average from the 1st inning to the 2nd and then a fairly steady rise through the 7th. Note that this pattern mimics the differences between batters that we saw before. When these individual half-inning values are summed, we find that the average 8.5 inning game has 2 hours and 12 minutes of actual playing time and the average 9 inning game has 2 hours and 20 minutes of play.
Individual Pitchers
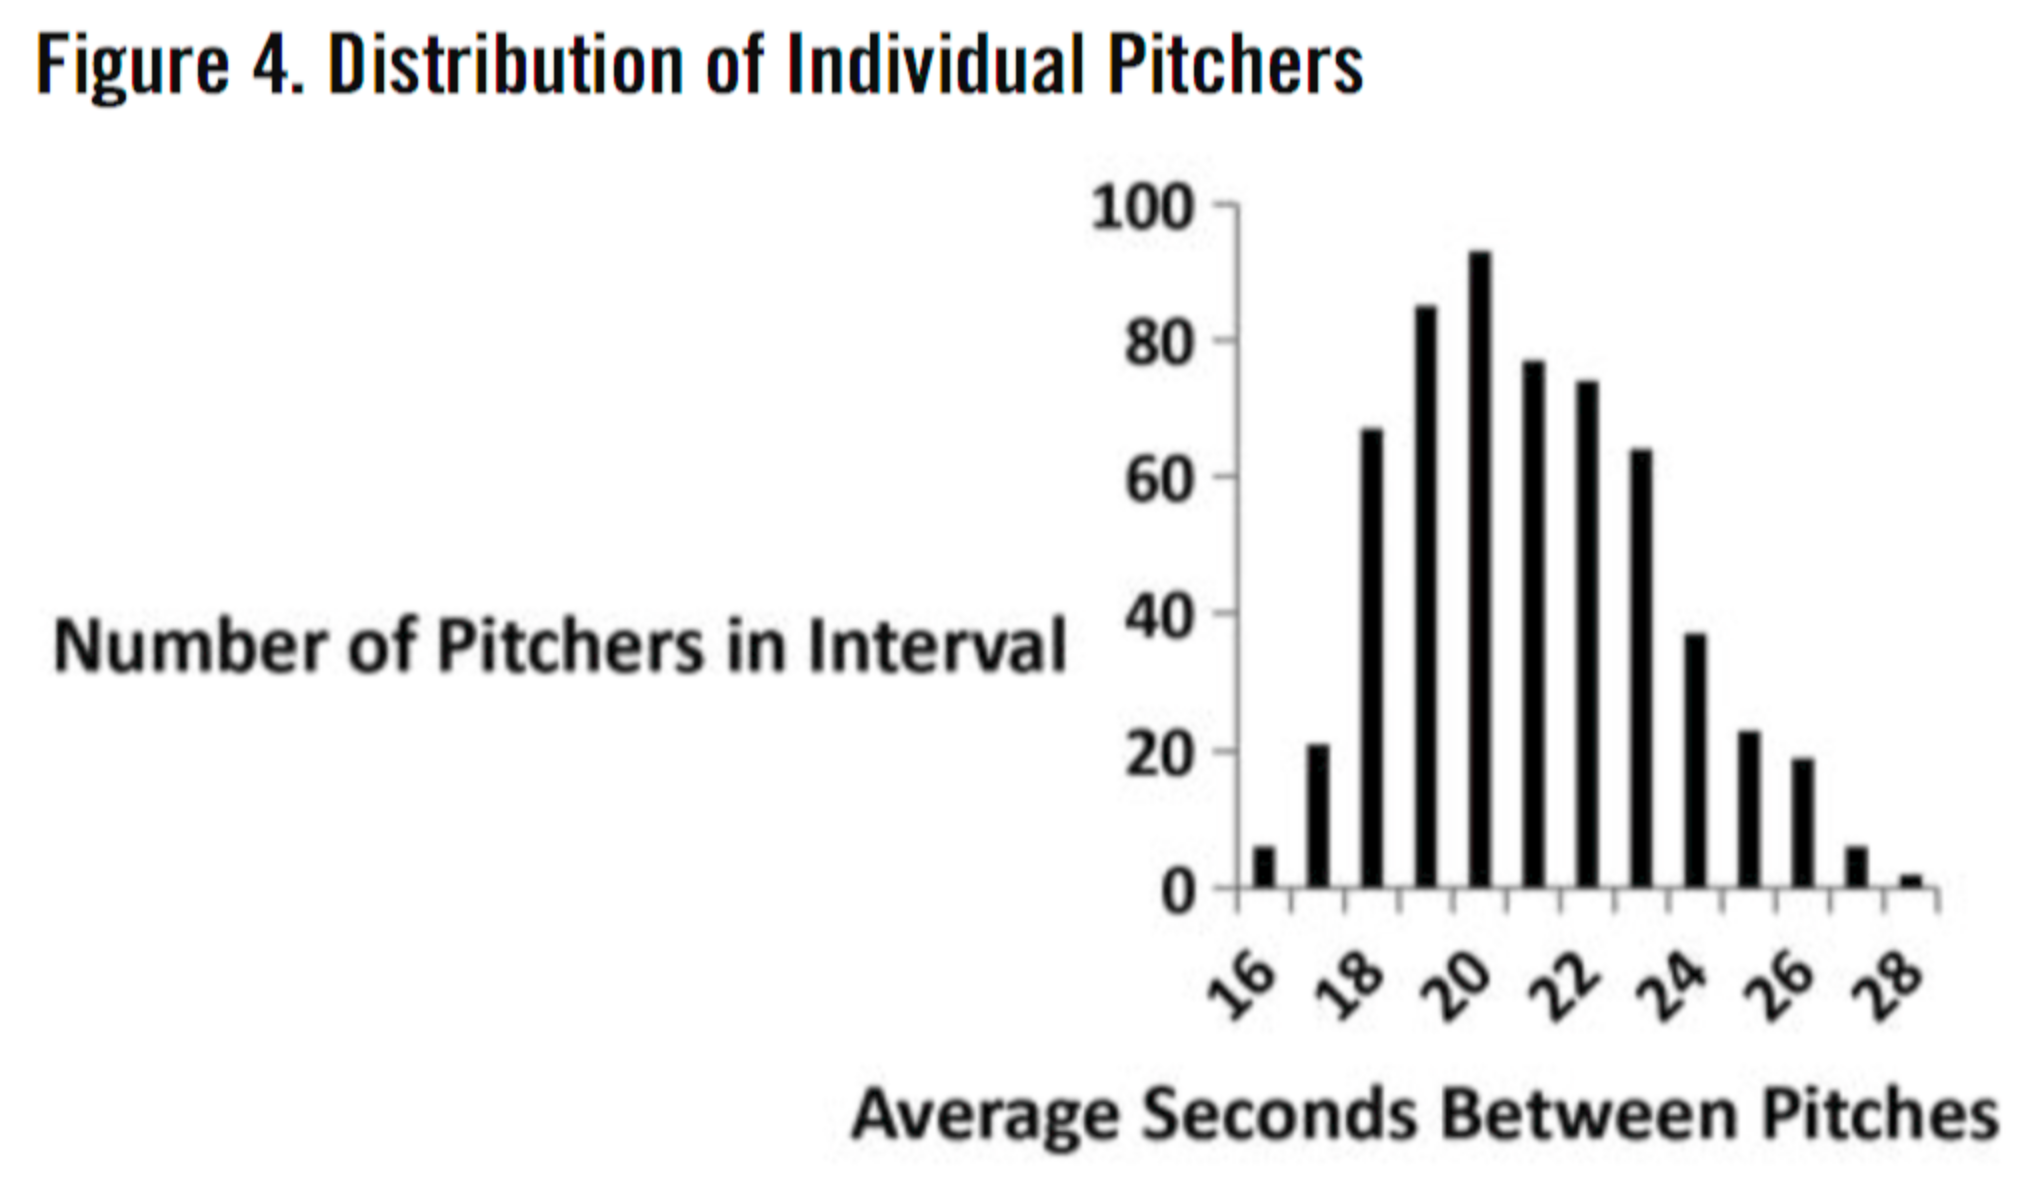
I also looked at the time taken by individual pitchers since one would reasonably expect variation here. In order to reduce noise in the data, I only considered pitchers who threw at least 100 pitches of the “interval” type I examined here with the bases empty. There were 575 pitchers who met this criterion with the average ranging from 15.3 to 28.4 seconds between pitches.
I also looked at the ERA and WHIP (walks plus hits per inning) of these 575 pitchers to see if there were any relation between pitching success and time between pitches. There was no relation. The longest time is 8 seconds slower than overall average, which is not trivial over the course of an entire game, but it is more important to ask how often these slow times occur. Figure 4 shows a distribution that is probably expected, with the large majority of pitchers showing little variation from the mean. In fact, the pitch intervals of 18 to 23 seconds cover 80% of all pitchers.
Individual Batters
It is a logical extension to check individual batters, once again limiting the analysis to those who saw at least 100 “interval” pitches with the bases empty and excluding all pitchers. There were 513 batters in this group. Their range was 17.4 to 25.9 seconds, which is narrower than I found for pitchers. I examined batter success in terms of OPS in relation to the pitch interval and once again there was no relation.
Individual Umpires
The other party in each pitch is the plate umpire. The range here is amazingly narrow, from 19.3 to 20.5 seconds, barely a one-second difference. We can safely conclude that the identity of the umpire is of virtually no significance in the time taken between pitches
Ejections
There were 87 ejection episodes in 2018 which saw the banishment of 189 players, coaches, and managers. In many cases two or more were ejected at the same time. These ejections consumed an average of one minute and 52 seconds.
Injuries
Injuries to players and umpires were very different in their time consequences. I catalogued 528 stoppages of play for an injury to a player and these took an average of two minutes and 19 seconds. Umpire injuries are rarer — only seven in 2018. However, these took an average of nine minutes and 3 seconds. Almost all of these involved the home plate umpire hit by a foul ball, necessitating his replacement to don additional gear, which takes significant time.
Summary and Highlights
- Bases empty: 20.3 seconds
- Man on first: 28.4 seconds
- Throws to first: 25 seconds
- Mound visits: 81 seconds
- Between batters: 54 seconds
- Between innings: 162 seconds
- 7th-inning stretch: 15 additional seconds
- “God Bless America”: 71 additional seconds
- Pitcher change start inning: 14 additional seconds
- Pitcher change mid-inning: 138 additional seconds
- Challenges between plays: 162 seconds
- Challenges between innings: 266 seconds
- Fastest to slowest pitchers: 12 seconds
- Fastest to slowest batters: 7 seconds
- Injuries to players: 2:19
- Injuries to umpires: 9:03
Conclusion
As demonstrated here, there are many different factors that add to the time of games. However, the answer to the question in the title is NO, time between pitches is not the cause of long games. Time between pitches makes only a minor contribution to total time.
Table 6 breaks down the average “regulation length” game, that is, those which are either 8.5 or 9 innings.
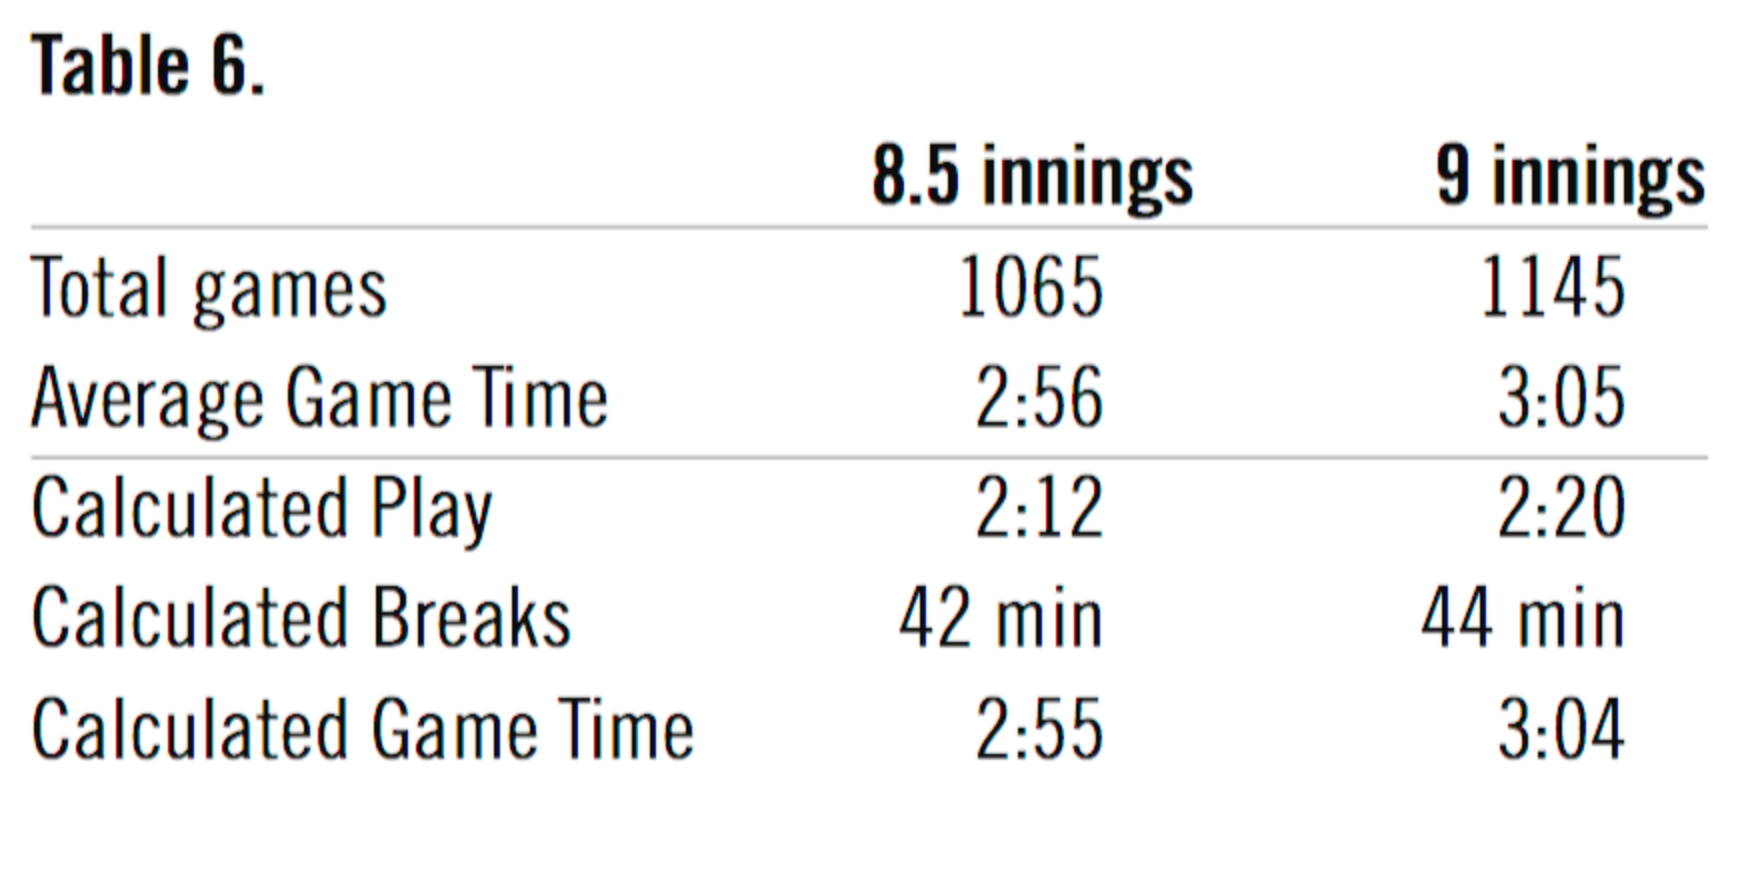
The “calculated” times were obtained by summing the observed average times for each half inning as well as the individual average times between innings. The nearly perfect match between the actual and calculated game times gives me great confidence that I considered the proper factors. As a final point, I looked on a per game basis at the various interruptions I identified. These are contained within the calculated play time and are listed in Table 7.
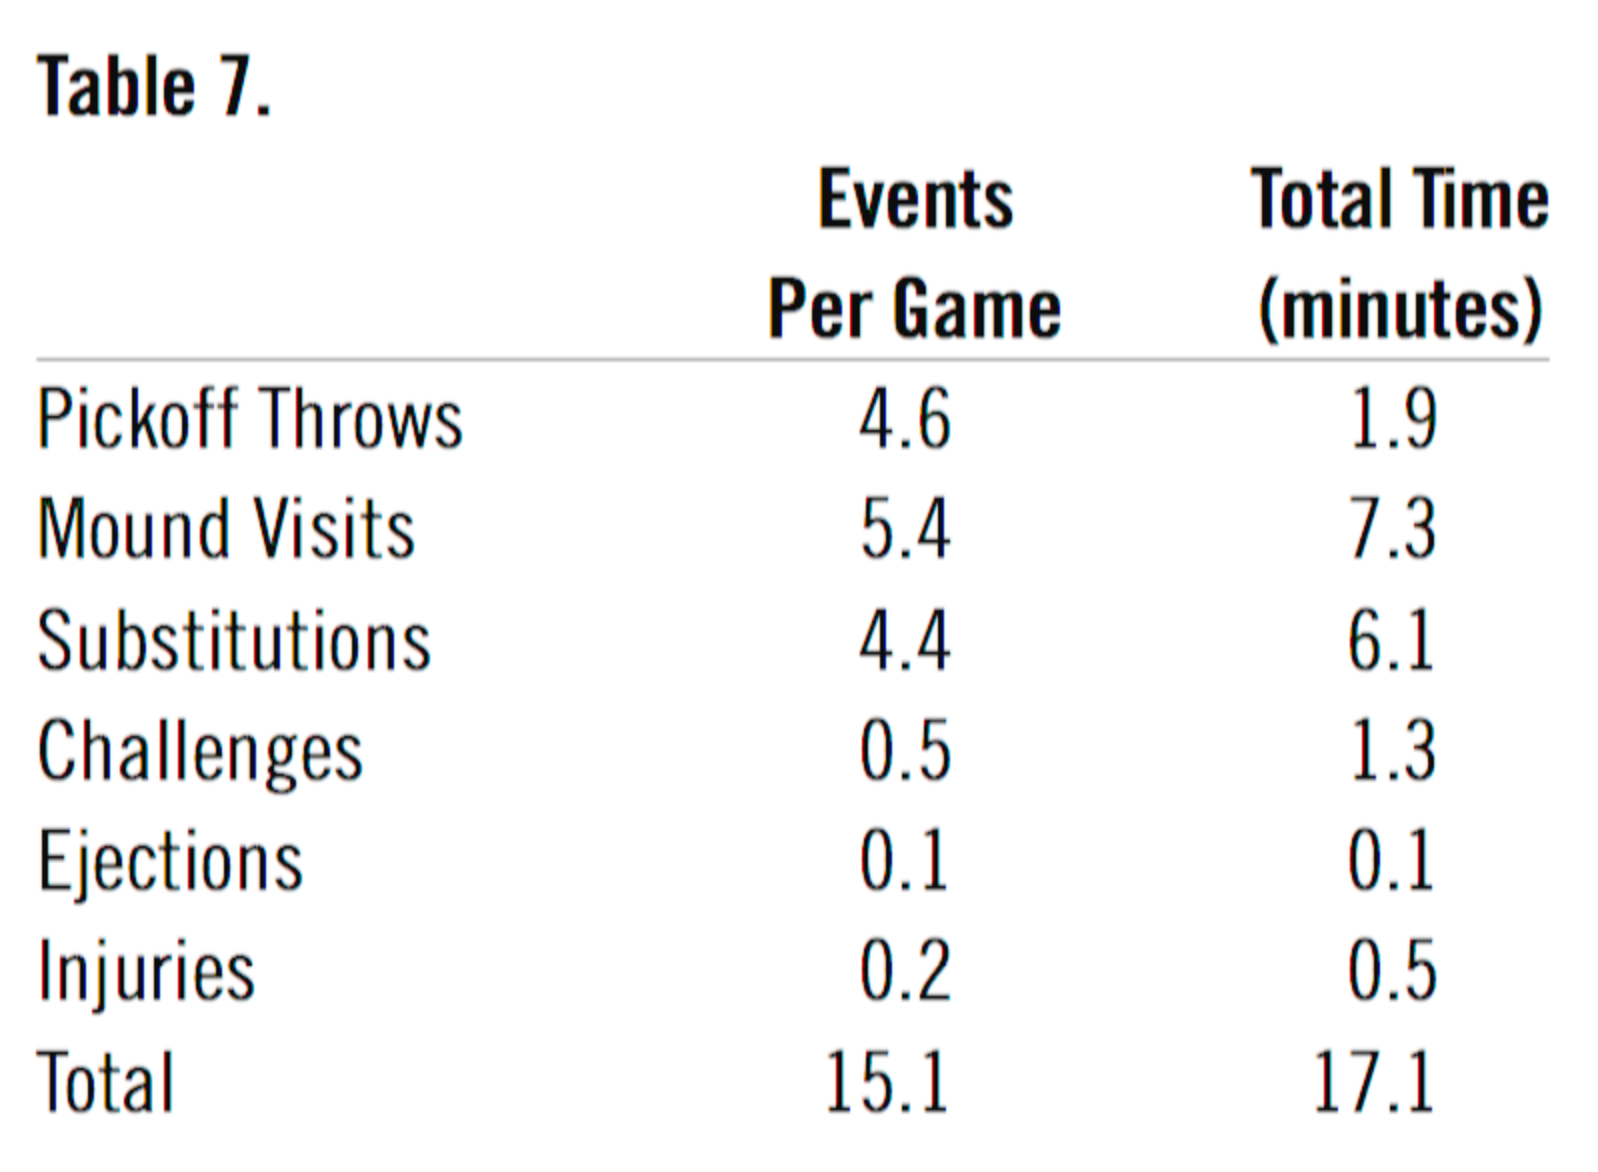
These regulation-length games average 3 hours and 1 minute, so the 17.1 minutes of interruptions comprise an average of 9.5% of the total time.
We are left with the question of where MLB could intervene to shorten games and I see no obvious target for rule changes that could mitigate this situation. There is a pending new rule requiring relievers to face a minimum of three batters instead of one, but these data suggest that will have little to no impact. It seems that the inherent structure of the game has changed to the current rate at which events flow and we should expect that to continue.
DAVID W. SMITH joined SABR in 1977 and has made research presentations at over 20 national SABR conventions. In 2001 at SABR 31, he won the USA Today Sports Weekly Award for his presentation on the 1951 NL pennant race. In 2016 he won the Doug Pappas Award for his presentation on closers. In 2005 he received SABR’s highest honor, the Bob Davids Award, and in 2012 he was honored with the Henry Chadwick award. He is founder and president of Retrosheet and an Emeritus Professor of Biology at the University of Delaware.
Notes
1 David W. Smith, “Why Do Games Take So Long?” SABR Baseball Research Journal, Vol. 47, No. 2 (Phoenix: SABR, Fall 2018). See also Retrosheet: https://www.retrosheet.org/Research/SmithD/WhyDoGamesTakeSoLong.pdf