
What Do Your Fans Want? Attendance Correlations with Performance, Ticket Prices, and Payroll Factors
This article was written by Ben Langhorst
This article was published in Spring 2014 Baseball Research Journal
North America is dotted by cities with unique histories, industries, landscapes, ethnicities, religions, and dialects. Just as political campaigns analyze the unique behavioral tendencies of geographical regions, Major League Baseball clubs could benefit from applying the same principles. The 30 MLB fan bases are as individualized as the towns they inhabit and MLB franchises would be wise to develop a thorough understanding of their fans’ values and behaviors. Such an understanding can serve as a critical foundation for the business decisions and investments made by MLB franchises.
Every offseason, teams invest and divest. While fans hope their team’s primary objective is to win a World Series, teams are often more focused on improving revenue and profit margins. Unfortunately for fans, profitability and on-field performance are only loosely correlated. When teams do invest in improving performance, they hope that the increased cost for presumably better players will be offset by increased revenues resulting from that improved performance. Vince Gennaro has written about the revenue incentive of making it to the postseason and calculated that a single postseason berth could be worth $20–70M in increased revenue over a five-year period.1 Gennaro has also written extensively about win curves, asserting that while revenue generally increases with winning, the relationship is not linear and the greatest marginal gains are realized when a team improves from mediocrity to playoff contention.2 Teams’ balance sheets include a variety of revenue streams such as media contracts, merchandise sales, and profit sharing distributions from the league, but their ticket sales is a publicly available metric that makes up roughly 20–45 percent of total revenue and generally correlates strongly with other revenue sources.3
Some teams have notoriously steadfast fans. For example, from 2004 to 2006, the Chicago Cubs went from winning 89 games to winning a mere 66, and their ticket prices rose by over twenty percent, but in the same time span, their ticket sales fell by only 579 per game. In fact, despite finishing dead last in the National League Central, the Cubs still sold 94 percent of Wrigley Field’s seats throughout the 2006 season. Other teams have fans that are more “fair-weathered.” Darren Glass examined correlations between team performance and attendance and found that from 1973 to 2002, the Cleveland Indians had the most positive correlation between home fan attendance and winning percentage, meaning that the Indians stood to gain more fans than any other team by winning more games.4 Yet another group of teams has fans that don’t seem to notice on-field performance. For example, from 2008 to 12 the Tampa Bay Rays have averaged 91.6 wins per season, made the playoffs three times, yet averaged nearly 9,500 fewer fans per home game than the major league average.
Before the games even begin, attendance may be predominantly determined by the cost of a ticket or a scheduled promotion. Ticket pricing has grown increasingly complex over the past decade, with increasing numbers of pricing levels, the growth of secondary ticket outlets, premium seats that sell for over $1000 each, and the introduction of dynamic pricing programs in which a seat is priced higher or lower depending on demand to view the opposing team. Teams also offer deals and promotions throughout the season to temporarily boost attendance. A recent study on minor league attendance by Ogden, Shorey, and Warneke that appeared here in the Baseball Research Journal found that the effects of such game-to-game factors like ticket discounts, giveaways, or fireworks may be overestimated and that sex, age, and sociological factors may play significant roles in determining attendance.5
Smart companies know their customers and strive to earn more of their business and smart MLB clubs do the same to improve their bottom line. This study uses ticket sales as an indicator of revenue and quantifies correlations between tickets sold for ball games and potential investment objectives and business decisions of MLB teams.
Some aspects of a club are directly controllable by team management. Payroll and the distribution of the total payroll among its players are two examples. A team can choose to field a few highly paid stars surrounded by many lower paid players or distribute its payroll more evenly. Ticket prices are another factor that a club can directly manipulate in an attempt to change attendance patterns. Other aspects of a club are more difficult for management to control, but are still the focus of investments. These factors include both team and individual performance on the field. The present study measures and presents the correlation between ticket sales and a variety of factors that are directly or indirectly controlled by team management. Armed with this knowledge, teams can invest in changes that they can expect to cause attendance to rise—areas where higher return on investment is likely. This study will show that most fan bases are as individualized as their cities and many of their attendance patterns are strongly correlated with factors that can be directly or indirectly controlled by team management.
METHODS
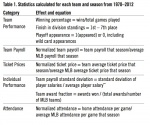
Data were compiled from the 1970–2012 seasons to quantify (a) attendance, (b) team performance in terms of wins, standings, and progressing to the playoffs, (c) team payroll, (d) average ticket prices, and (e) individual performance in terms of end-of-season awards and payroll standard deviation, which indicates the spread of pay (and presumably the spread of talent).6 Ticket price data were only available since 1991. The statistics listed in Table 1 were calculated for each team and season.7
As Table 1 shows, some of the metrics were normalized by league-wide averages to isolate team-specific changes from league-wide trends that may have been caused by free agent markets, labor strikes, economic conditions, introductions of new end-of-season awards or similar universal changes.
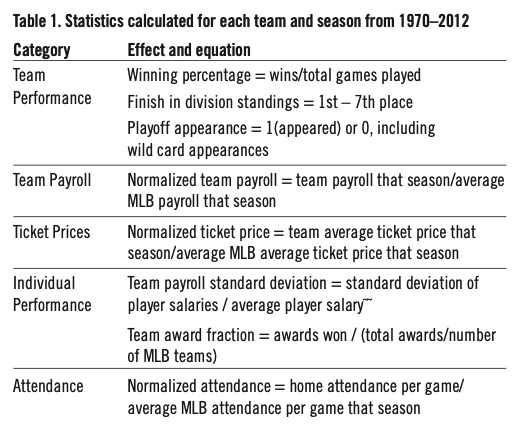
Relationships were examined between normalized attendance and the metrics that describe team performance, payroll, ticket prices, and individual performance. As an example, Figure 1 shows a plot of normalized attendance as a function of winning percentage for all MLB teams in seasons from 1970 to 2012 and two teams are highlighted within the plot for comparison.
Figure 1. Normalized attendance as a function of winning percentage.
The Cincinnati Reds have a more positive correlation between attendance and winning (654 additional fans per game per extra win) than the MLB average (464 additional fans per game per extra win) and the St. Louis Cardinals have a less positive correlation between attendance and winning (291 additional fans per game per extra win) than the MLB average.
A team’s season was excluded if a team played that season in a geographical region in which it is no longer based or if the team was not yet in existence (e.g. Washington Nationals data span 2005–12; Texas Rangers data 1972–2012; Colorado Rockies 1993–2012, etc.). Seasons in which a team sold more than 90 percent of its season-long seating capacity were excluded because latent demand (in the form of fans wishing but unable to buy a ticket) could not be quantified.
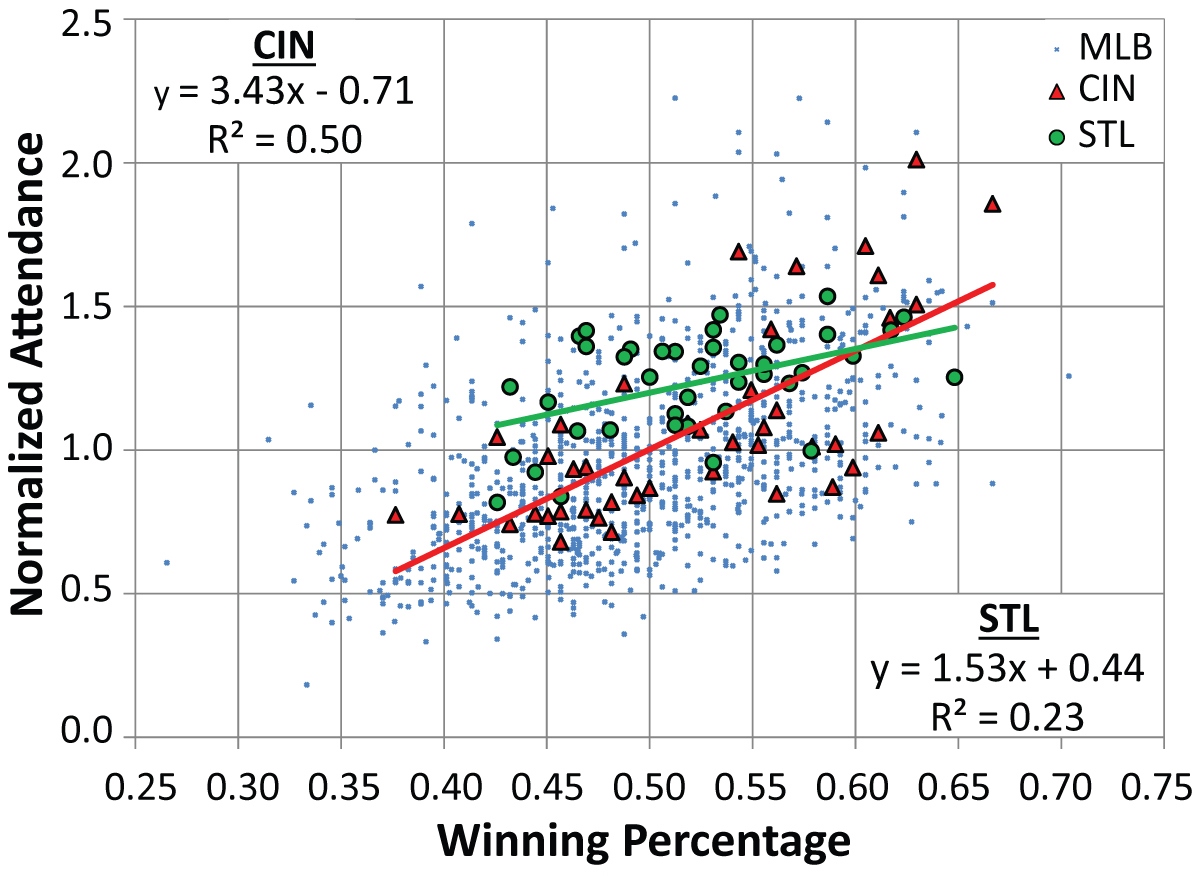
After making these exclusions, teams had reduced numbers of qualifying seasons of data. Using the number of qualifying seasons, a correlation coefficient limit was calculated above which one can be 90 percent confident in the correlation. This 90 percent confidence limit varied slightly from team to team depending on their number of qualifying seasons. Correlations were calculated between a team’s normalized attendance and the other metrics listed in Table 1. The correlation coefficient of each relationship was compared with that team’s 90 percent confidence correlation coefficient limit. Relationships with correlations that exceeded this limit are presented in Table 2 and gaps in the table’s data represent relationships that were not found to be correlated with a confidence of 90 percent or higher.
Table 2. Relationship between normalized attendance and various effects (% of MLB average / fans gained by changes in effect)
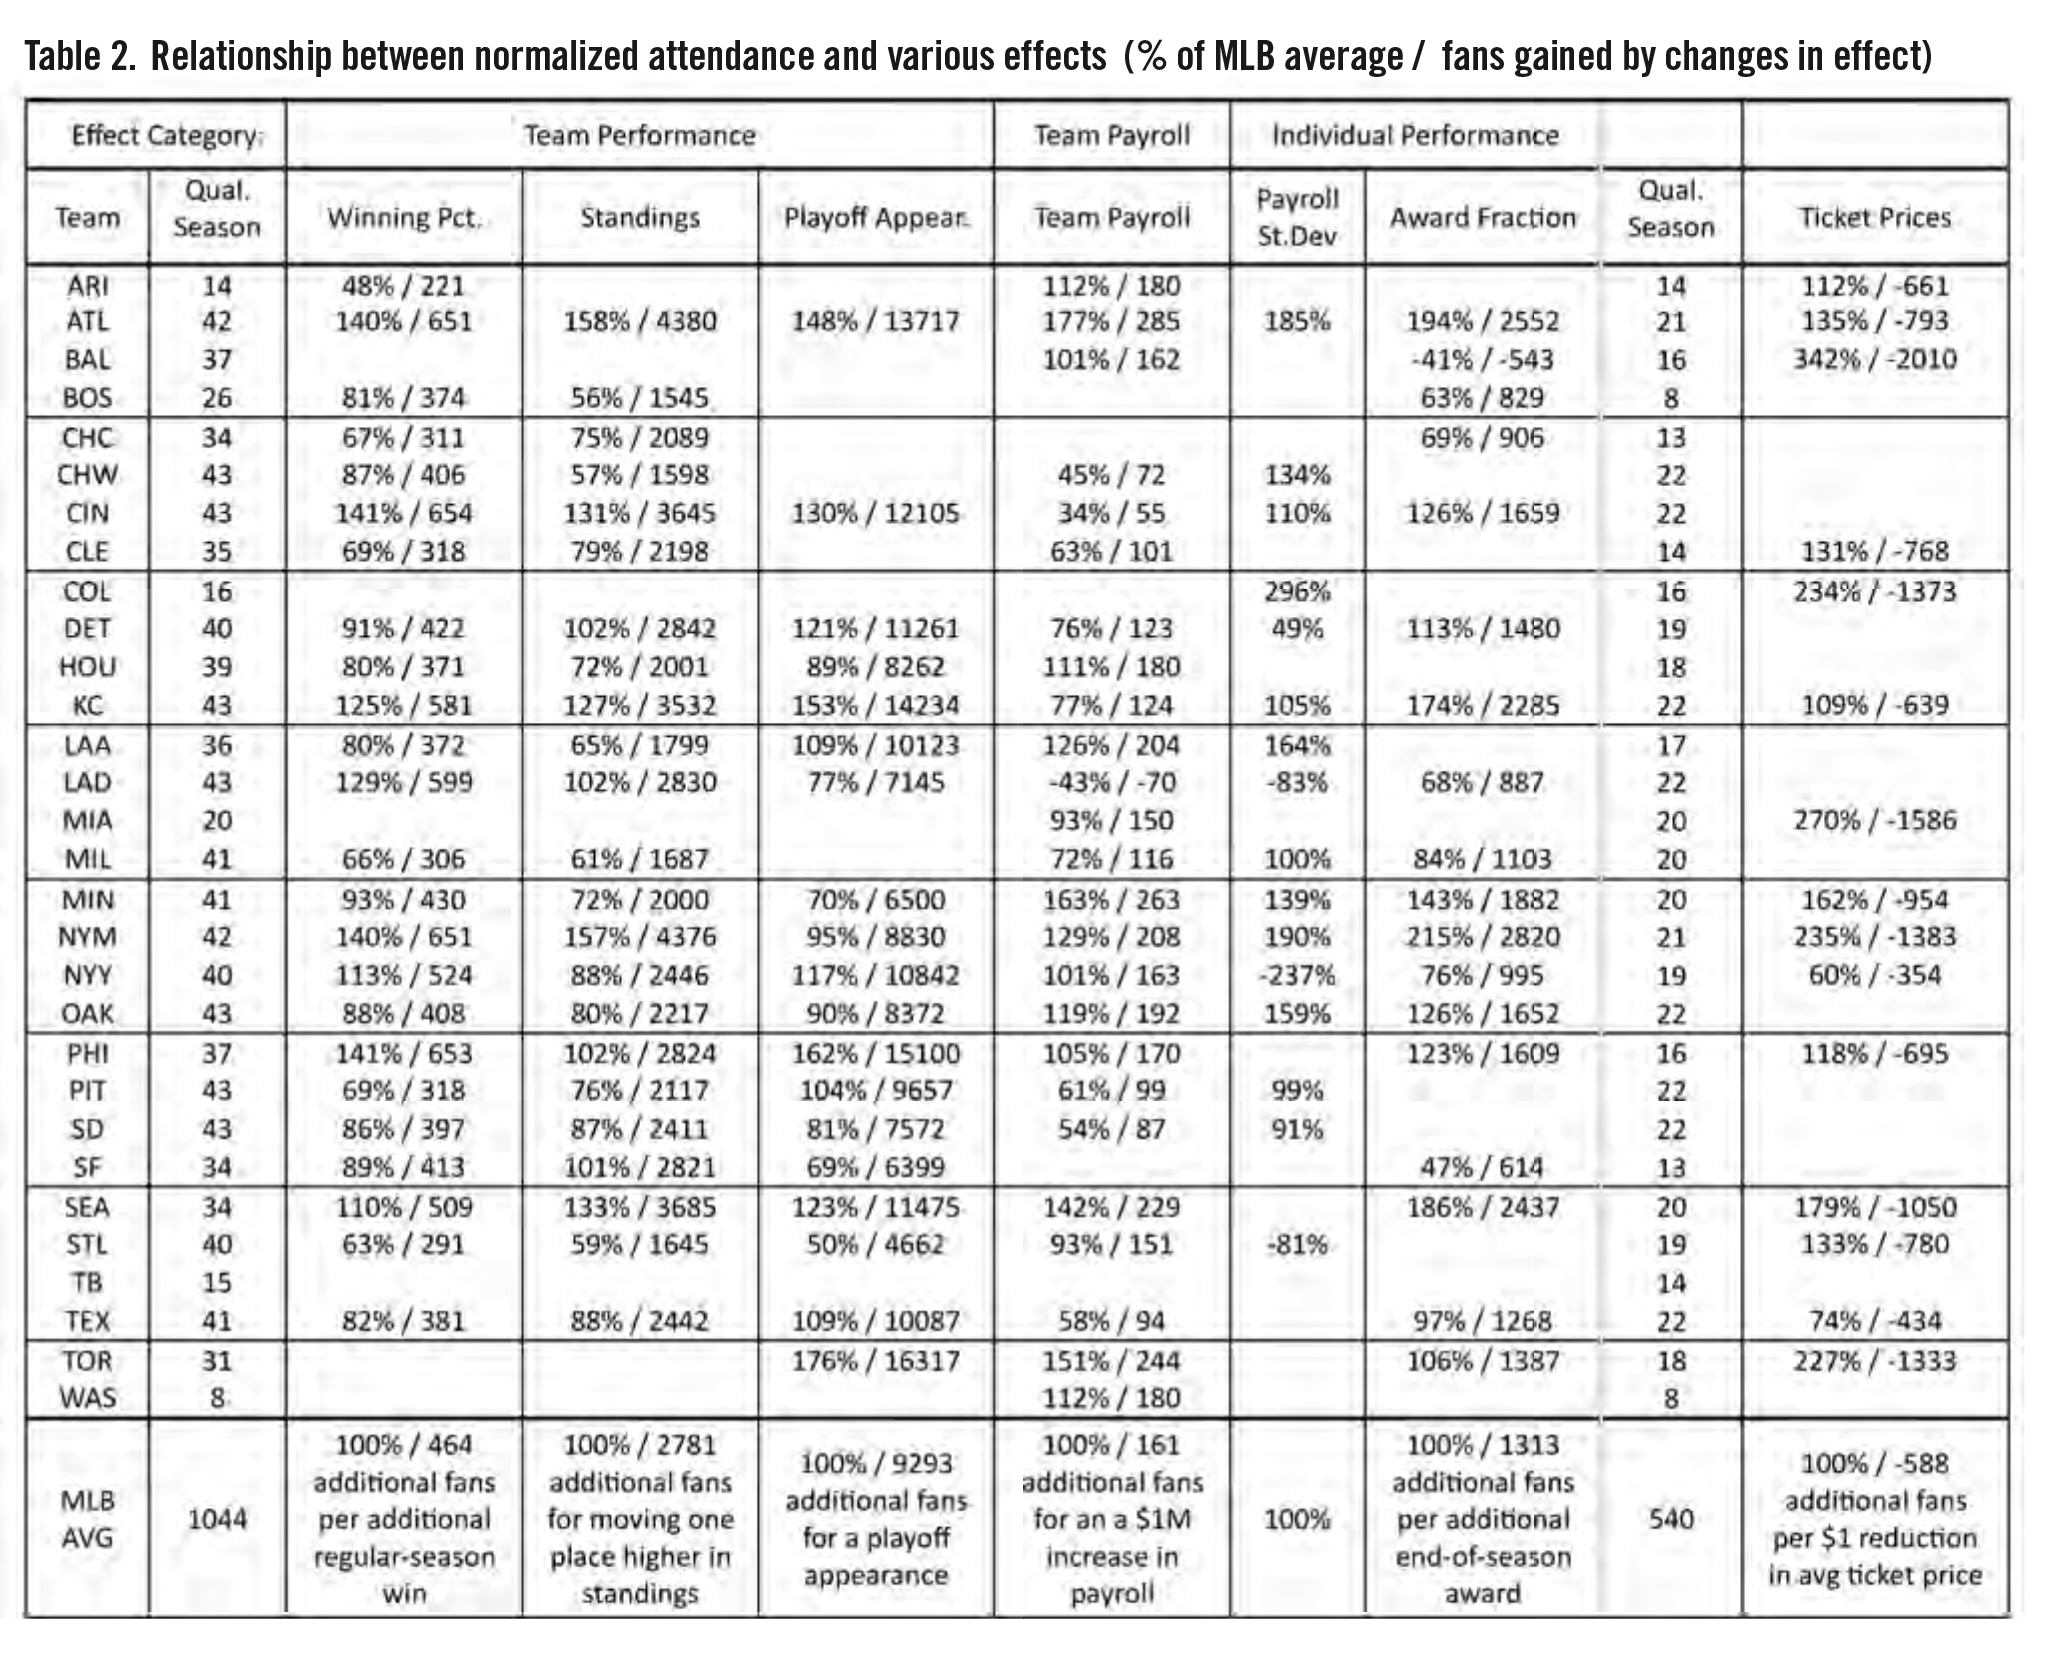
Ticket price data were calculated using data from 1991–2012, and each team’s 90 percent confidence correlation coefficient limit was adjusted to account for the fewer qualifying seasons. Compiling all qualifying seasons, league-wide relationships were calculated and are listed at the bottom of Table 2.
RESULTS
The correlations listed in Table 2 vary from strong correlations that were highly positive to strong correlations that were less positive or even negative. Weaker correlations that did not meet the 90 percent confidence criteria are shown as gaps in Table 2 indicating that either the fans’ behavior is inconsistent or that more seasons of data are needed.
A team whose correlation of normalized attendance with winning percentage is more positive that the MLB average stands to gain more fans per additional win than the average MLB team. Conversely, a team whose correlation of normalized attendance with normalized team payroll is less positive than the MLB average stands to gain fewer fans per additional million dollars of payroll than the average MLB team.
The relationship between attendance and ticket price was found to be generally weak, and in disagreement with the basic law of demand—an indication that other factors are strongly affecting demand. In fact, across all of Major League Baseball since 1991, higher ticket prices have been accompanied by higher attendance figures. If one examines the relationship between average ticket price and raw attendance numbers since 1991, 540 qualifying non-near-sellout seasons of data are available.
In those data, a one dollar increase in ticket price resulted in an increase of 298 fans per game (R = 0.27). However, such an analysis does not account for league-wide trends in ticket price or attendance. Table 1 lists the equations used to normalize attendance and ticket price. After normalizing the data by league-wide averages, the correlation is stronger (R = 0.46) and even more positive: a one dollar increase in ticket price resulted in an increase of 588 fans per game. The two approaches of examining the effect of ticket price on attendance—using raw and normalized data—are depicted in Figure 2.
Figure 2. The Blue Jays’ and Orioles’ fan bases have historically strong and positive correlations between normalized ticket price and normalized attendance.
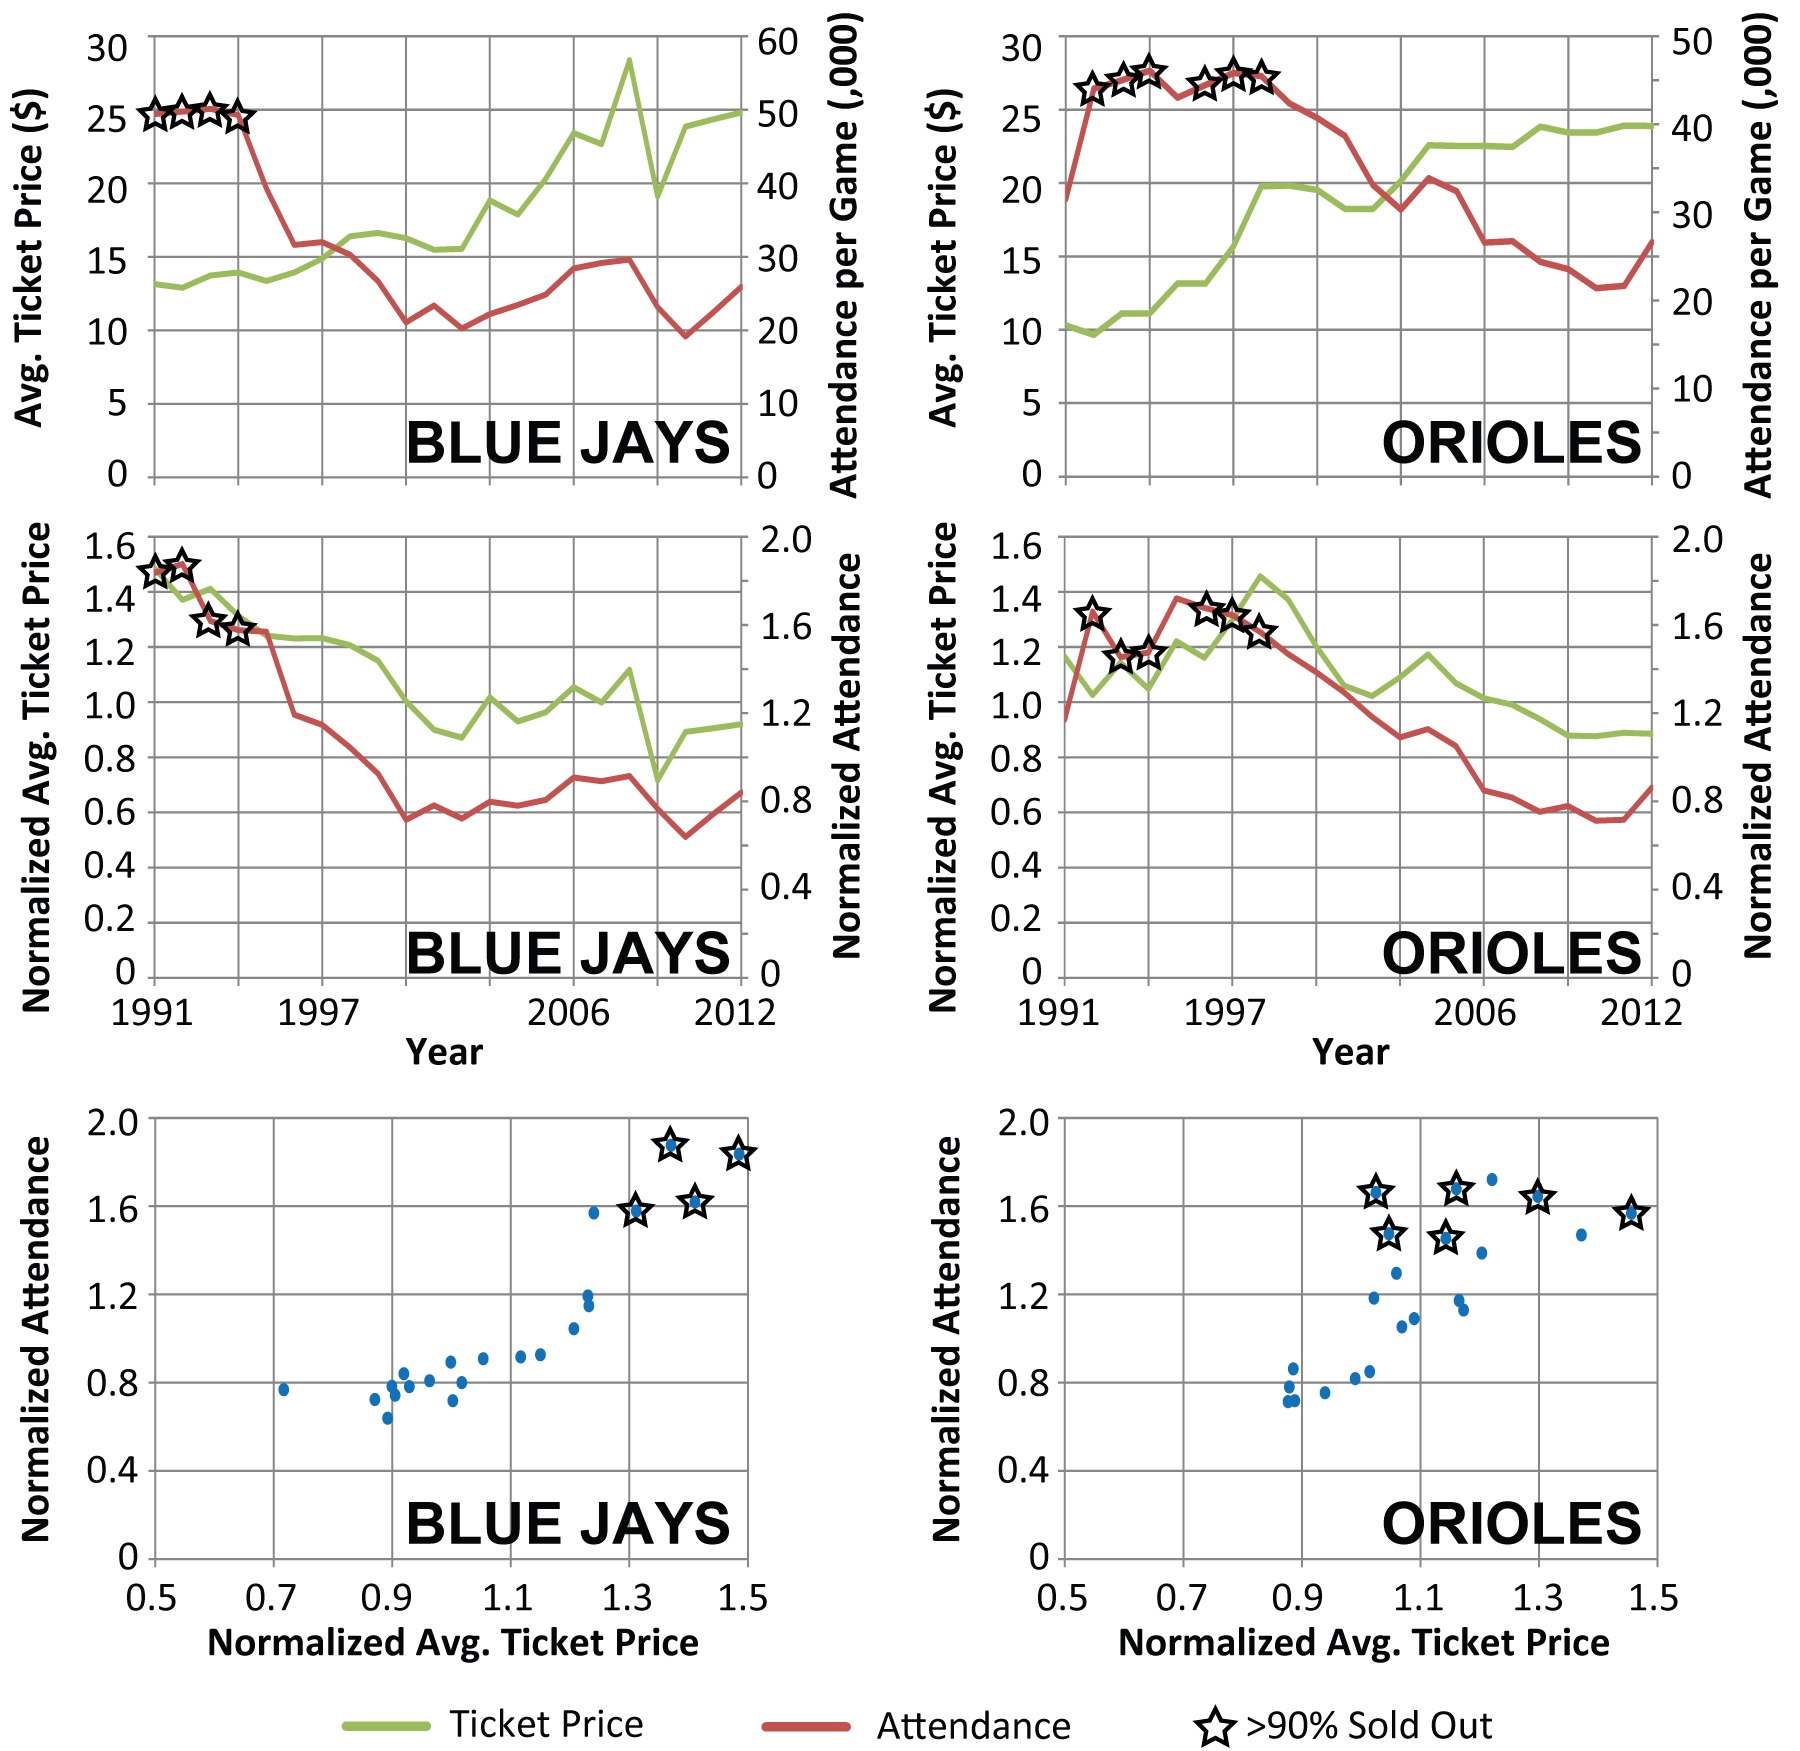
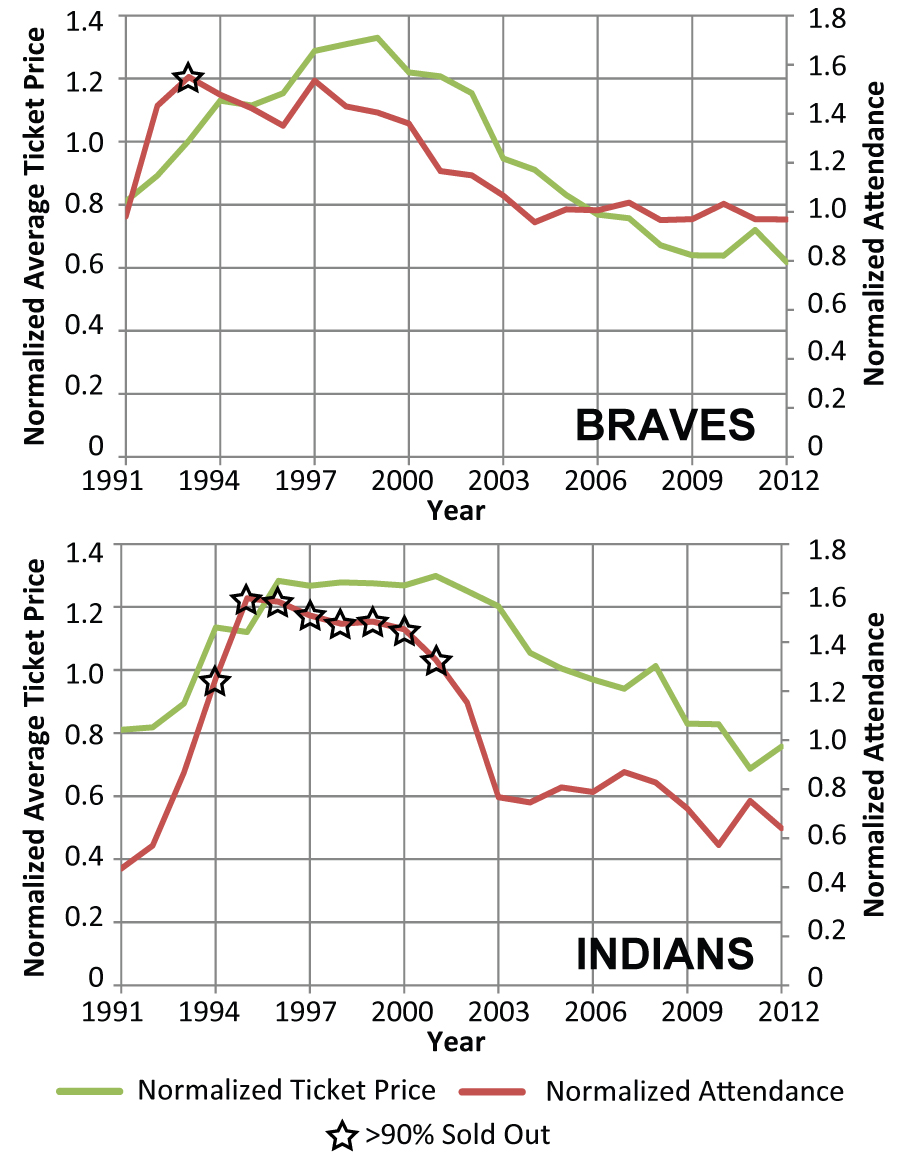
In addition to the data from Baltimore and Toronto, many other fan bases have historically positive correlations between normalized attendance and normalized ticket price. Table 2 shows that all of the correlations between team attendance and ticket price with 90 percent or greater confidence are, in fact, positive. Two other examples of less positive correlations, the Braves and Indians, are plotted as time histories in Figure 3.
Figure 3. Time histories of normalized ticket price and normalized attendance data for two teams with strong positive correlations.
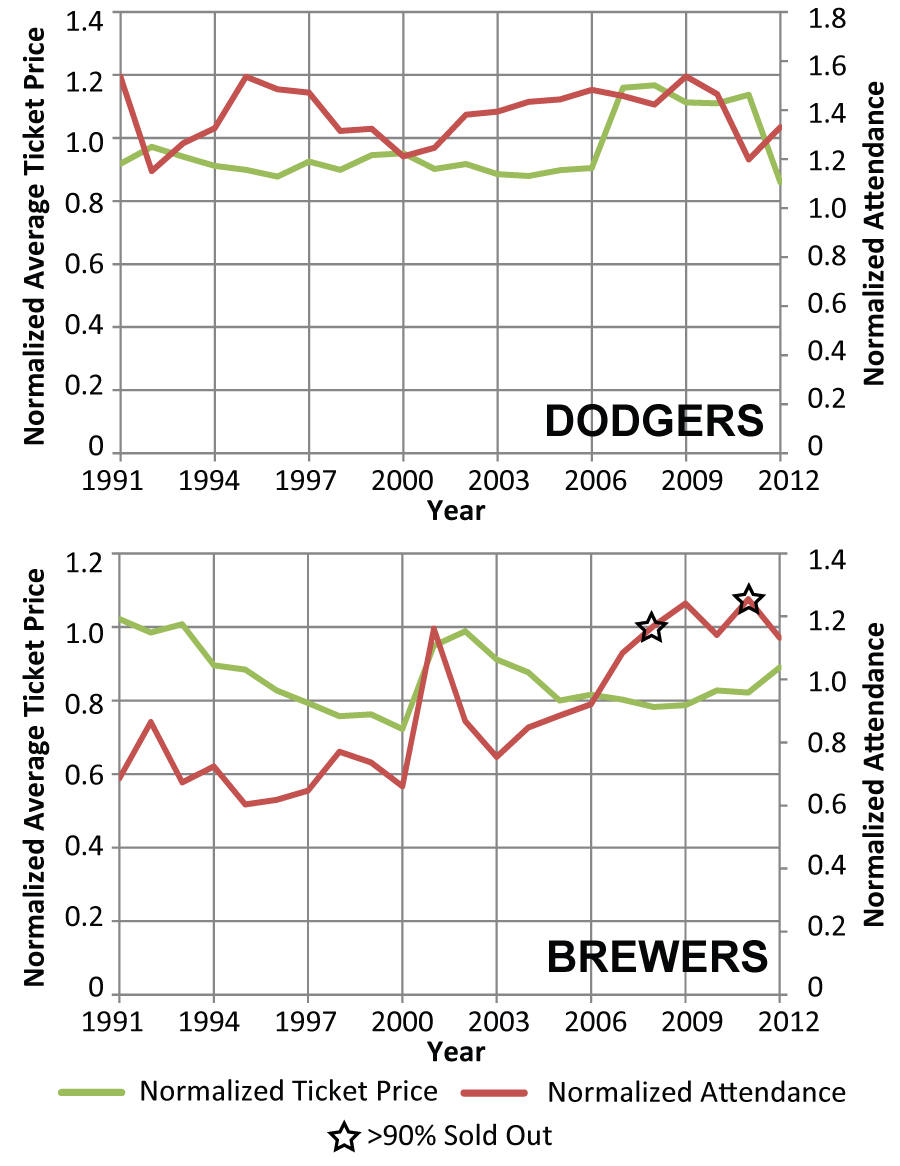
Fifteen fan bases in all have positive correlations that are significant with 90 percent confidence and the remaining teams’ data were poorly correlated. Two examples of poorly correlated data sets, the Dodgers and Brewers, are plotted as time histories in Figure 4.
Figure 4. Time histories of normalized ticket price and normalized attendance data for two teams with weak correlations.
In general, normalized ticket prices and normalized attendance are positively correlated across the league. Correlations for half of MLB fan bases were not significant with a 90 percent confidence, and correlations for the other half of MLB fan bases were positive. Attendance generally rising when ticket prices are higher contradicts the theory of demand, so this is likely an example of correlation that should not imply causation. While in-season ticket discounts may effectively boost attendance, season-long trends in attendance are generally not driven very strongly by changes in ticket prices. This is good news for clubs who wish to increase attendance without reducing ticket prices, and the remainder of this study focuses on ways to boost attendance by investing in particular aspects of the baseball team.
Looking beyond ticket pricing to payroll and performance factors, groups of fan bases appear. Using the data in Table 2, two Venn diagrams were created to visually display the apparent motivations of each team’s fans. The Venn diagram in Figure 5a includes teams whose fans are at least 10 percent more responsive than the MLB average to any of the three effect categories (team performance, team payroll, and individual performance). Conversely, the diagram in Figure 5b includes teams whose fans are at least 10 percent less responsive than the MLB average to any of the three effect categories (team performance, team payroll, and individual performance).
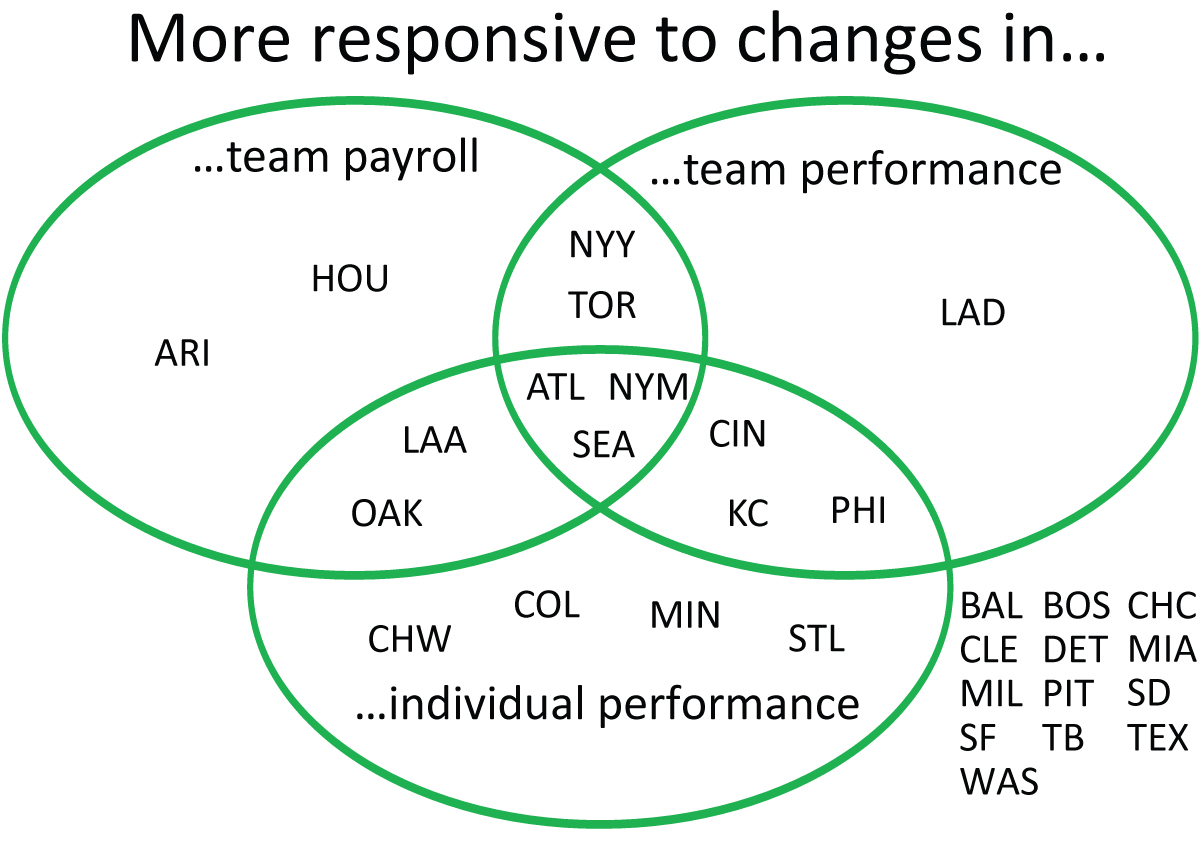
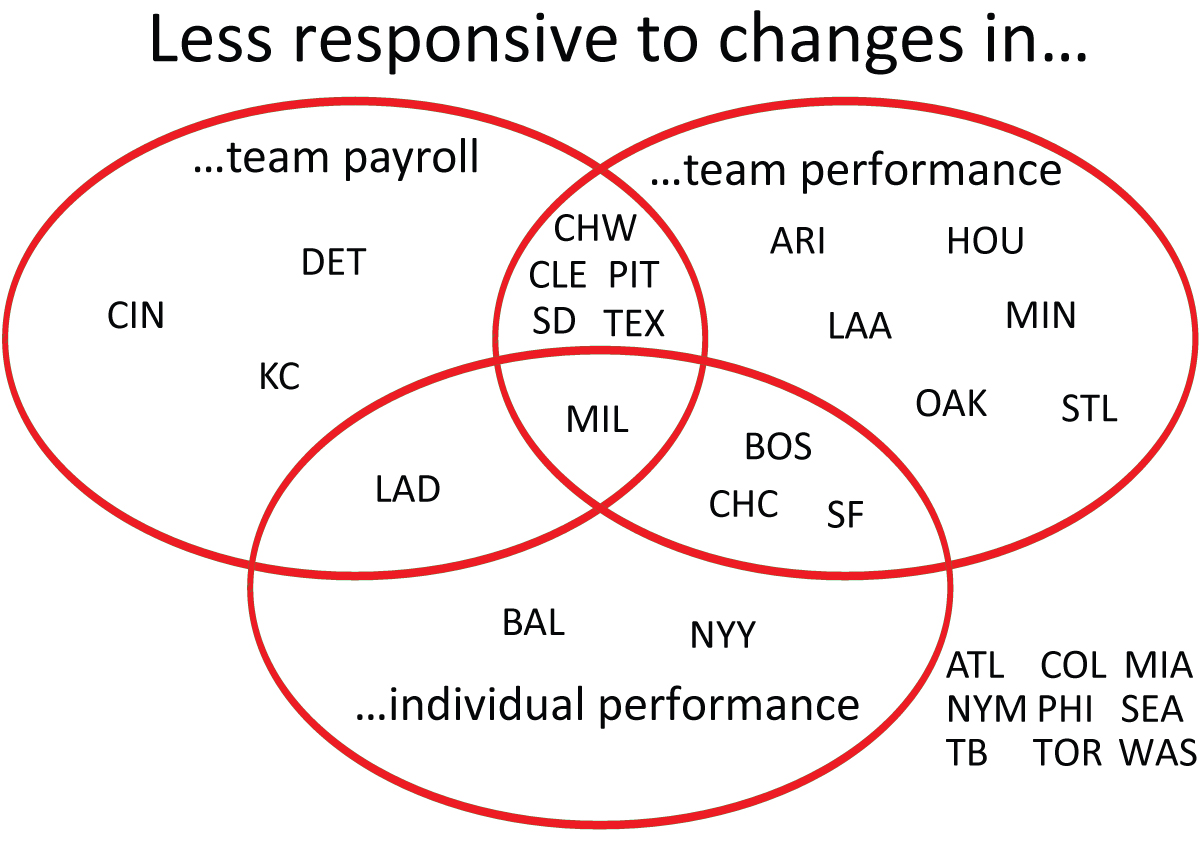
For example, the fans of the New York Mets, Atlanta Braves and Seattle Mariners all appear to respond strongly to changes in team performance, team payroll, and individual performance. Management of these organizations can make investments in these aspects of their team knowing that their fans will be more responsive to those investments than the average MLB fan base. Conversely, the fans of the Milwaukee Brewers appear to respond weakly to changes in team performance, team payroll, and individual performance. Management in Milwaukee should be less inclined to invest in these areas, knowing that their fans are less likely to respond to their investments by attending more games.
While some fans may respond to performance or payroll changes during the same season those changes occur, other fans may not respond until the following season. Table 3 lists teams with attendance figures that are more-positively and less-positively correlated with changes that happened during the previous season. The correlations listed in Table 3 all exceeded the 90 percent confidence limit described above.
Table 3. Teams whose attendance is closely related to effects from the previous season. Teams listed here have relationships that are at least 10 percent above or below the MLB average.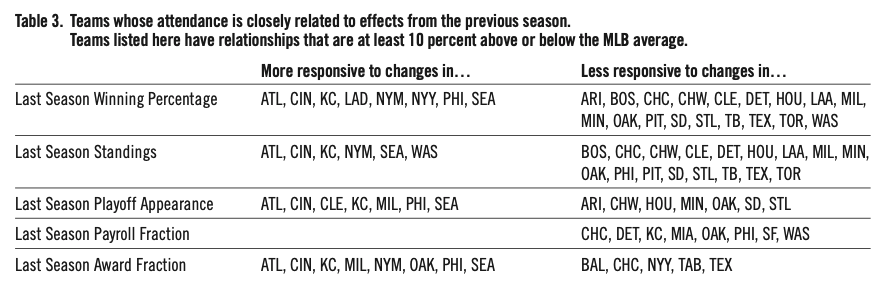
DISCUSSION
The Mets, Braves, and Mariners organizations are very fortunate to have fans that are predictable and highly responsive to changes in payroll and performance. Those organizations can consider investments in their team with a reasonable confidence that their fans will attend more games when their team wins more games, has a higher percentage of elite players, and a higher team payroll. Over the past 43 seasons (36 seasons for Seattle), these fans have been footing a large portion of the bill for their teams’ investments in winning. The Braves fans, for example, have responded to an additional $1M in team payroll by filling 285 additional seats per game. At an average seat price of $16.69 and an 81 home-game schedule, the fans can be expected to provide $385K of ticket revenue in response to the addition of $1M to team payroll. That revenue increase is from the payroll effect alone, and if the higher payroll results in a move up the standings or making the playoffs, other correlations are engaged and more revenue gains can be expected.
Factoring in additional revenue from fans purchasing premium tickets, parking, concessions, and merchandise, Braves’ management can invest in team payroll expecting larger than average financial returns. In comparison, Reds fans should only be expected to contribute approximately 10 percent of the cost of additional payroll, but they respond strongly to winning and an extra win on the field can result in an extra $1.13M in ticket revenue that season and $1.02M the following season. For reference, recent costs of free agents are roughly $6–7M per win above replacement (WAR), and in 2012, teams paid an average of $1.22M in payroll for each win and ranged from $0.59M per win (Oakland) to $2.51M per win (Boston).8
While some fan bases are more responsive to the groups of effects studied here and other fan bases are less responsive, still other fan bases are not responsive enough to have a 90 percent confidence in their responsiveness. The Tampa Bay Rays fans’ attendance is not well correlated with any factors: performance, payroll, or ticket prices. Perhaps more seasons of data will establish a stronger statistical basis for these relationships. While fans are unlikely to change their behavior based on awareness of their tendencies, these data may help fans understand why their teams tend to operate the way they do. With the exception of the 2013 season, the Pirates have had a dismal past couple decades, but the Pirates might invest more in payroll and winning if their fans were more responsive to those factors.
Examining correlations between one season’s attendance figures and the previous season’s stimuli, some fan bases are found to have stronger memories than others. The lists of teams in Table 3 show that Braves, Reds, Royals, Mets, and Mariners fans seem to have strong memories of the previous season and these teams’ performance during the season can affect the next season’s attendance more than the MLB average. Astros, Athletics, Cardinals, Cubs, Padres, Rays, Rangers, Tigers, Twins, and White Sox fans have a tendency to forget last season.
Over the course of a full season, the majority of fan bases appear to be motivated by factors other than ticket prices. Nonetheless, a study of in-season ticket price effects using higher fidelity data would be interesting. Ticket price effects are complicated by a number of factors including the range of ticket prices available, the general availability of tickets, dynamic ticket pricing, resale practices, and promotions and discounts. The high fidelity data needed are also typically proprietary.
CONCLUSIONS
Each team has a unique fan base. Intelligent organizations should seek to understand their fans and conduct business in keeping with the manners that their fans have historically been responsive. The correlations presented and examined above should be useful to teams seeking to improve their understanding of their fans’ motives and to teams seeking to quantify the attendance benefits of potential changes to their team’s makeup.
While the stimuli examined above were found to be highly correlated to MLB-wide attendance values, they fail to fully explain fan behavior. Other sociological factors such as local economics, demographics, weather, stadiums, media outlets, ticket price distribution and availability, concession prices, and the presence and performance of other pro sports teams may also significantly influence fan attendance. A more thorough understanding of all relevant factors that affect attendance may be able to explain why the fan bases of the Mets and Yankees are so different despite their co-location. Regional correlations with other revenue sources would also be worth future investigation. However, for now, this analysis of factors directly or indirectly influenced by team management may help MLB organizations to better understand their fans and also help organizations invest in changes more intelligently.
BEN LANGHORST has a Ph.D in materials science and engineering and works as an engineer, but enjoys applying his nerdiness to other interesting pursuits, such as baseball. Ben’s interests extend from the business of sports to the science and mechanics of sporting goods and athletic performance. For more information, contact Ben.Langhorst@gmail.com.
Notes
1 Vince Gennaro, “The Payoff for Winning Comes from the Postseason, Part 1.” Diamond Dollar$. MLB.com. August 6, 2012.
2 Vince Gennaro, Diamond Dollars: The Economics of Winning in Baseball. (Purchase, NY: Diamond Analytics, 2007.)
3 Ticket revenue fraction calculated using attendance data from Baseball-Reference.com, average ticket price data from Team Marketing Report, and revenue data from MLB Team Values, Business of Baseball, Forbes.com. This method estimates that Philadelphia, Boston, and Chicago Cubs earn 50%or more of their revenue from ticket sales, while Tampa Bay, Arizona, and Cleveland earn less than 20% of their revenue from ticket sales. In Diamond Dollars, Gennaro says on page 7 that on average, nearly 40% of revenue came from regular season gate receipts. That was based on 2001 data, and since then, this author believes that fraction has shrunk.
4 Darren Glass, “Fair Weather Fans.” The Baseball Research Journal, 32 (2004), 82.
5 David Ogden, John Shorey and Kevin Warneke. “Prospects, Promotions and Playoff Races: Do They Bring Fans to Minor League Games?” Baseball Research Journal, 42:2 (2013), 107.
6 End of season awards include MVP, Cy Young, Silver Slugger, and Gold Glove awards.
7 Wins, losses, standings, playoff results, and end-of-season awards from Baseball-Reference.com; Salary data from USAToday.com salary database; Stadium capacities from BallparksofBaseball.com; Ticket price data from Team Marketing Report, partially compiled by Doug Pappas at Business of Baseball Downloadable Data & Documents, http://roadsidephotos.sabr.org/baseball/data.htm.
8 Lewie Pollis, “How Much Does a Win Really Cost?” Beyondtheboxscore.com. October 15, 2013.
9 Using payroll data from USAToday.com salary database.