

Where Spectators Sit to Catch Baseballs
This article was written by Gary R. Scott - Cliff Frohlich
This article was published in 1981 Baseball Research Journal
It is the custom at major league baseball games that fans can keep all baseballs which are hit or thrown out of play into the spectator seating area. Not surprisingly, many fans treasure souvenir baseballs obtained in this manner. Indeed, if given a choice, most young fans would probably appreciate more catching a foul ball than watching such a protracted event as a perfect game, or experiencing such a fleeting event as a triple play.
Although there is an enormous body of statistical information available concerning major league baseball games, players, and stadia, we are unaware of any quantitative research concerning what happens to baseballs that go into the grandstands in the normal course of play. As baseball fans, the present authors have often wondered where to sit in a baseball stadium to maximize the likelihood of obtaining a baseball. Clearly, in America, this is a question of basic importance. If you doubt this, attend a major league baseball game with a child between the ages of six and 12, and he or she will set your doubts to rest.
Fortunately, the problem of determining the likely resting place of errant baseballs is a problem that can be tackled using the tools of science. For the past three years, the authors have attended nearly 100 major league baseball games at seven different stadia. We have made careful observations of all batted balls, with particular attention to batted balls that come to rest off of the field of play. The present paper is a summary of our observations.
In addition to answering the question of where to sit to obtain or avoid baseballs, we will address a number of other specific questions about baseballs that are retained by the fans. For example, what are a fan’s chances of taking home a baseball? Do some baseball stadia or baseball players produce more balls for the fans than others? Does it matter whether the batters or the pitchers are right or left handed?
Methods
At each ballgame in the data set, the authors kept detailed records of who pitched, who batted, and what happened to every ball that the batter swung at. Because it was tedious and imprecise to locate each ball on a map of the stadium, a shorthand notation was used to record the “zone” of the playing field where every batted ball first touched the stadium.
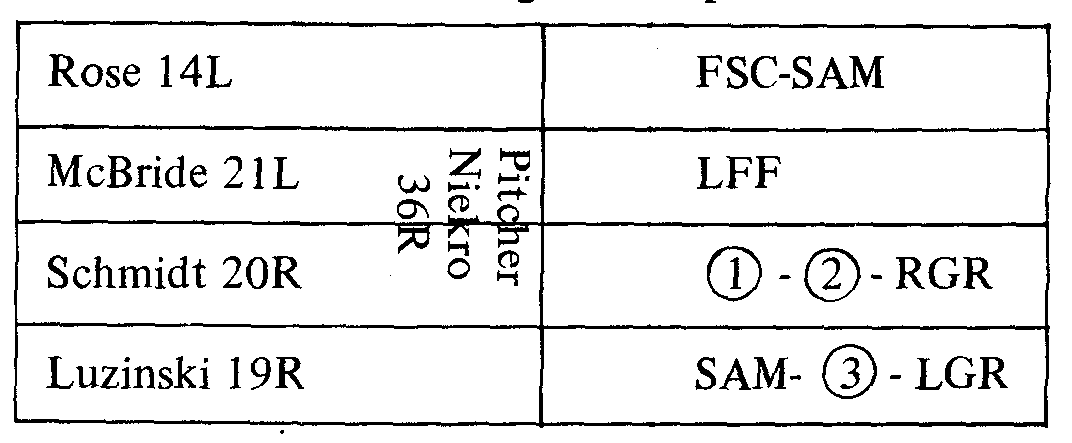
For example (see Table 1), the first inning of the game between Philadelphia and Houston on October 10, 1980 began when the right handed pitcher Niekro (36R) pitched to the left handed batter Pete Rose (14L). Rose’s first swing was fouled into the screen (FSC) and his second swing was a swing and a miss (SAM). The second batter, McBride, flied to left field (LFF). Schmidt then fouled two pitches into the grandstands, which are noted as (1) and (2), since they were the first and second balls that went into the stands in this game. After Schmidt grounded to the right side (RGR), Luzinski had a swing and a miss (SAM), a foul into the stands (3), and a grounder to the left side (LGR). Notation for other zones of the playing field included fouls behind the plate
(FBP), and flies to right (RFF). For these data, the first point of contact between the ball and the field determine the zone marked. Thus a LGR could denote either a ground out to the left side or a ground single to left. Similarly, RFF could either be a fly out or a base hit, and FLG could either be a harmless foul dribbling to the left side, or a pop fly caught in foul territory by the third baseman. For statistical analysis, the zone data for all observed at-bats were punched onto IBM cards.
Table 1
Shorthand record of batter’s swings for Philadelphia team during the first inning of the playoff game against Houston on October 10, 1980.
First Inning, Philadelphia
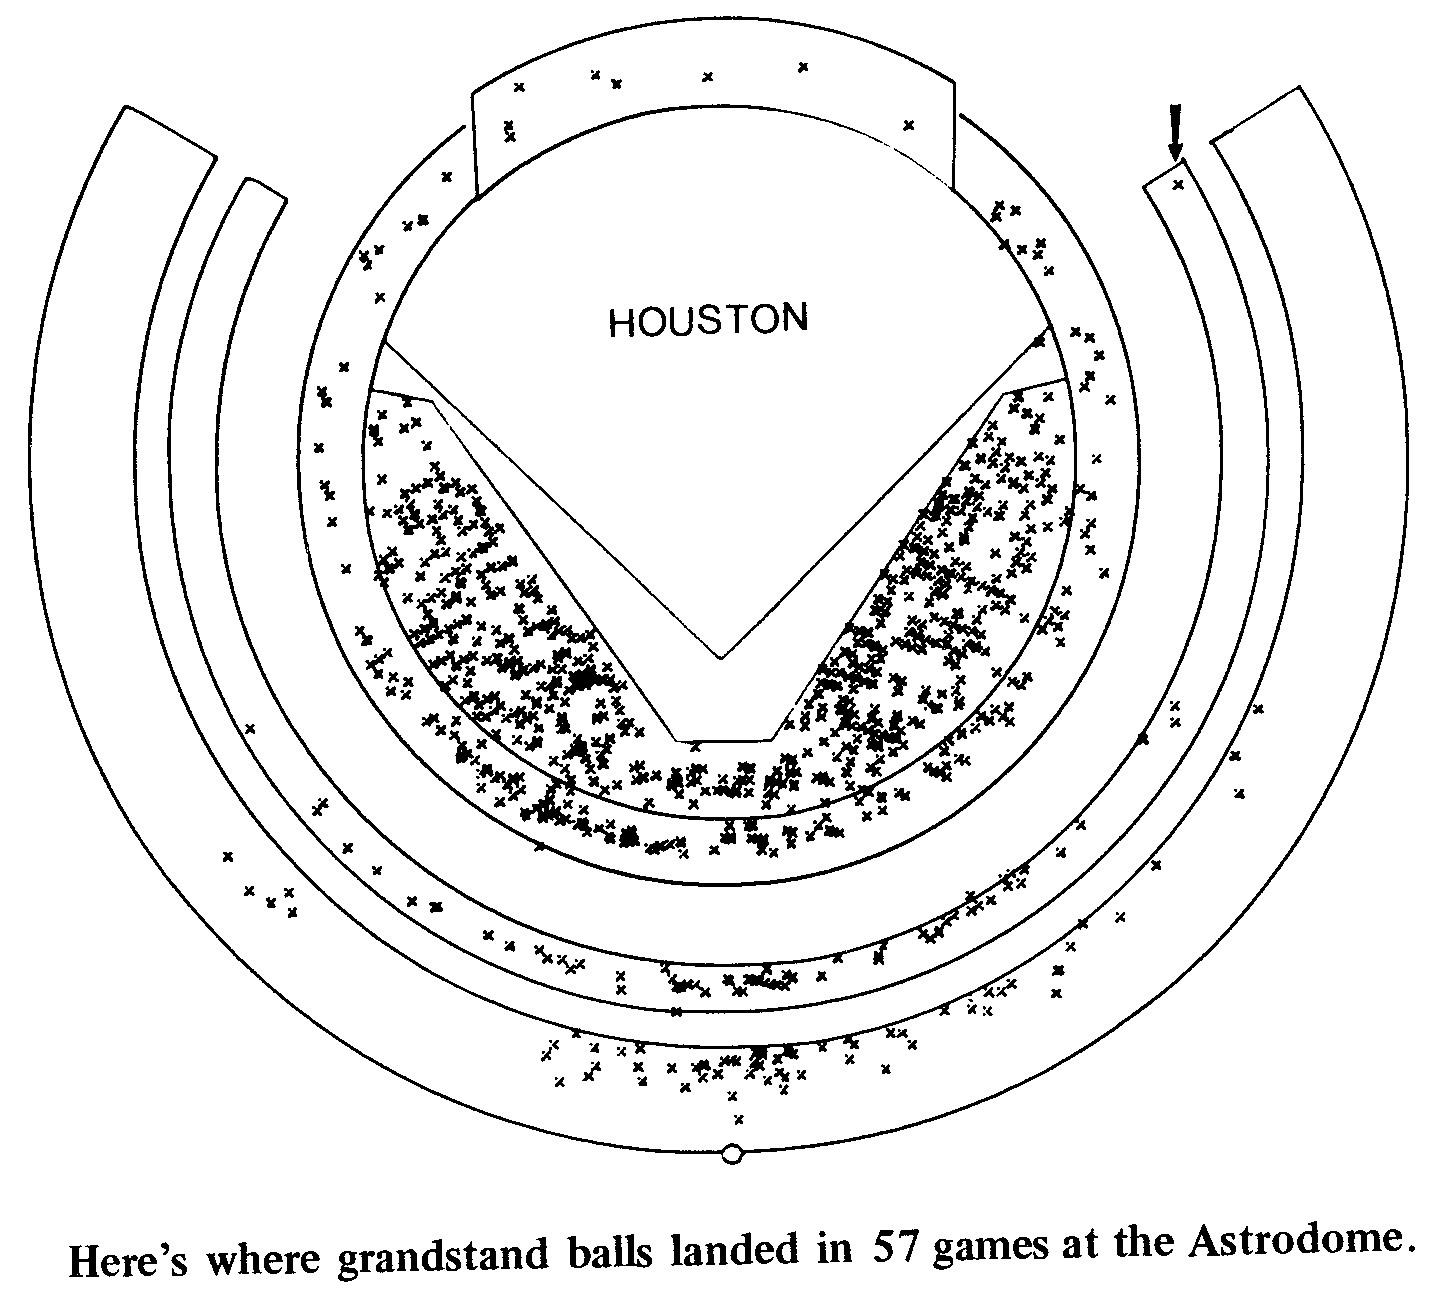
We collected additional information for baseballs that went into the grandstand, or “grandstand balls,” such as (1), (2), and (3) above. Each ball’s identifying number was marked on a map of the stadium to show where the ball landed in the crowd. Although the vast majority of baseballs that went into the stands during the game did so directly, a few foul balls bounced into the stands after being designated FLG, or even LFF fair balls as ground rule doubles. All were numbered and mapped. Although the true location of fouls could not always be determined precisely, the mapped locations faithfully reproduce the approximate locations.
To facilitate analysis we carefully measured the coordinates of the mapped grandstand balls, and keypunched the coordinates of the ball along with the handedness (L or R), team, and number of the batter and the pitcher. In this keypunched form, the data could be easily manipulated to make computer grandstand maps of the balls produced by particular batters, pitchers, teams, series, etc.
Results
The data collected indicated that there were significant variations in the number of grandstand balls (GB) at different games. At the Astrodome, the most GB observed was 3 1 during an extra-
inning game between the Astros and the Cubs on August 23, 1980. The Astros finally won this game by a score of 1-0 in the bottom of the 17th when the pitcher, Joe Niekro, singled home the game’s only run. The fewest GB observed was five during a game with Atlanta on opening day in 1976. The most complete data available for any stadium are from games at the Houston Astrodome, where we observed 975 balls go into the crowd during 57 baseball games. The Astrodome data include five regular season games for every team in the National League, and two of the 1980 playoff games between the Astros and Phillies.
A comparison of the Astrodome data with the data from Candlestick Park in San Francisco and from Oakland Coliseum shows clearly that on the average, fewer balls were retained by the
Astrodome fans than by fans at either other park (Table 2). In particular, the GB average for nine-inning games was 16.2 at the Astrodome, compared to 23.2 at Candlestick and 25.5 at Oakland. In addition, several games were observed at Oakland, San Francisco, and even in Toronto where more than 31 GB occurred.
The zone data suggest that there may be fewer GB at the Astrodome because more balls are fouled into the screen or behind the plate than at the other parks. For example, about 7 per cent of all swings at the Astrodome are fouled into the screen compared to 2 per cent at Candlestick and 4½ per cent at Oakland. In contrast,
Table 2
Average number of baseballs hit into the crowd or grandstand balls at different stadia visited by the authors.
|
Stadium |
Games |
Ave. GB |
|
Houston Astrodome |
50 |
16.2 |
|
Candlestick Park, San Francisco |
10 |
23.2 |
|
Oakland Coliseum |
10 |
25.5 |
|
Toronto Exhibition Stadium |
2 |
29.0 |
|
Seattle Kingdome |
2 |
24.0 |
|
Detroit Tiger Stadium |
1 |
19.0 |
|
Baltimore Memorial Stadium |
1 |
22.0 |
Only 13 per cent of swings are GB at the Astrodome, compared to 17 per cent at Candlestick and 20 per cent at Oakland. There appear to be no significant differences at these parks in the proportion of fly balls (LFF or RFF), grounders (LGR or RGR), or swings and misses (SAM).
To evaluate further how the pattern of balls varied at different stadia, we performed detailed analysis of ten games between the Houston Astros and the San Francisco Giants. Five of the games took place in the Astrodome, and five at Candlestick Park. Presumably because the competing teams were the same, the most significant variable affecting the incidence and pattern of fouls was the stadium. As before, the results strongly suggest that the existence of significantly fewer GB at the Astrodome is related to the presence of significantly more fouls into the screen at the Astrodome.
For particular stadia, the maps of GB show clearly that the density of GB is higher in some areas of stadia than others. For example, in the upper stands, very few baseballs are fouled into the stands beyond first base and third base. However, it is common for balls to be fouled nearly straight backwards of home plate. In the lower stands, GB are common both on the first and third base sides and behind the plate. However, the number and location of GB that occur in the area behind the plate depend strongly on the construction of the foul screen in this area.
An analysis of data for particular players shows that different individuals differ in the proportions of GB’s produced. For example, for Astros pitchers which the authors observed for more than 200 swings (Table 3), Sambito and Ryan produced more than twice as many GB’s per nine innings as Ruhle. Note that GB’s seem to be correlated strongly with strikeouts as in each case increases in the number of GB’s per nine innings occurred along with increases in the proportion of strikeouts per nine innings as well as increases
Table 3
Statistics concerning grandstand balls for Astros pitchers. Data from 57 games for pitchers whose pitches elicited 200 or more swings by batters.
|
|
GB per 9 |
total |
percent |
percent |
SOs per |
BB per |
|
Name |
innings |
swings |
GBs |
SAMs |
9 innings |
9 innings |
|
Sambito |
11.89 |
218 |
16.9 |
29.3 |
9.32 |
0.96 |
|
Ryan |
11.46 |
362 |
18.5 |
27.9 |
9.06 |
4.10 |
|
Richard |
8.25 |
505 |
13.0 |
29.9 |
8.50 |
2.75 |
|
Forsch |
7.21 |
499 |
12.6 |
16.4 |
3.89 |
1.71 |
|
Niekro |
7.16 |
682 |
12.1 |
17.3 |
3.79 |
2.67 |
|
Andujar |
6.71 |
385 |
11.4 |
17.4 |
3.05 |
3.05 |
|
Ruhle |
5.51 |
223 |
9.4 |
15.6 |
2.62 |
0.78 |
in the percentage of swings and misses (SAM’s). There appears to be no clear relationship between GB’s and walks, as the two pitchers with the lowest proportion of walks (Sambito and Ruhle) were respectively the most and least likely to produce GB’s.
For batters, there seems to be no similar relationship linking GB’s and the rate of strikeouts or walks (Table 4). Cedeno and Cruz were the two Astros most likely to get walks and also the best hitters for average; however, they were respectively the highest and lowest in the percentage of GB’s produced (16.4 per cent vs. 11.0 per cent). They were neither the least likely nor the most likely Astros to strike out.
Table 4
Statistics concerning grandstand balls for Astros batters. Data from 57 games for players with 200 or more swings.
|
percent |
percent |
bat. |
SO |
walks |
total |
|
|
Name |
GBs |
SAMs |
ave. |
ave. |
ave. |
swings |
|
Cruz |
16.4 |
15.3 |
0.295 |
0.101 |
0.101 |
320 |
|
Leonard |
16.1 |
21.5 |
0.263 |
0.164 |
0.093 |
241 |
|
Cabell |
13.1 |
24.2 |
0.274 |
0.121 |
0.037 |
425 |
|
Landestoy |
13.1 |
12.6 |
0.256 |
0.082 |
0.081 |
213 |
|
Reynolds |
12.6 |
9.6 |
0.248 |
0.090 |
0.042 |
269 |
|
Puhl |
11.3 |
7.9 |
0.284 |
0.078 |
0.094 |
290 |
|
Cedeno |
11.0 |
20.1 |
0.285 |
0.112 |
0.118 |
308 |
The study confirmed several factors that most readers probably assume. One is that right-handed batters foul more balls into the lower stands on the first base side, whereas left-handed batters foul more often to the third base side. Right-handed batters almost never foul balls into the upper stands on the third base side and vice versa for left-handed hitters. In fact, in 57 games in the Astrodome, the only exception occurred on April 26, 1980, when lefty Mike Jorgenson of the Mets hit a long foul that landed in the upper deck beyond first base. The third factor that we all anticipated was that the vast majority of home runs are pulled. On September 6, 1980, left-handed batter Bull Durham of the Cardinals hit a fair ball into the right field mezzanine in Houston, which, as shown on the accompanying map, is very difficult to do.
Discussion
There are several ways that a fan hoping to bring home a grandstand ball (GB) can increase his chances of doing so. One often underestimated factor that affects one’s chances of obtaining a GB is crowd size. Since the number of GB’s is independent of crowd size, a particular fan is more likely to catch a ball when the crowds are small. During the 57 games we attended at the Astrodome the lowest attendance was 5700 fans on September 19, 1978 (which was, incidentally, the night that the comebacking Jim Bouton started for the Atlanta Braves and pitched well against J. R. Richard). At the other extreme, for four games we watched the attendance exceeded 46,000, such as on September 22, 1979, when Niekro won his 20th game pitching against Cincinnati. Since, on the average, about 16 GB’s are produced each game at the Astrodome, a fan can expect that he or she will bring home a ball about once in every 350 to 3000 games.
In addition, the present study clearly shows that a fan can choose the location of his seat so as to make his chances of getting a ball significantly higher than indicated above. In the upper stands, nearly as many balls are fouled into the seats in the lower half of the three sections straight back of home plate as in the entire remainder of the upper deck. In the lower stands, the best places are among the most expensive seats, such as on the right side out to somewhat beyond first base. The equivalent seats on the left side are also good if the teams playing have a significant number of left-handed hitters.
There are also some places in a stadium where GB’s almost never go. For example, in the 57 games in the Astrodome only two balls went into the upper stands on either the right or left field side beyond first and third base. Home runs into the stands in straight-away center field are also quite unusual, presumably because it is difficult to hit a baseball more than 410 feet without pulling it.
The present study confirms that some stadia produce more GB’s than others, although the reasons for this are not completely clear. One possible factor is the size and configuration of the protective screen behind home plate. Two different screens are presently used at the Astrodome, one entirely vertical screen which allows balls to land in the seats in the lower stands directly behind home plate, and a second screen attached to the front of the upper stands with a sloping portion which prevents balls from landing in the seats just behind home plate. During the 44 games at the Astrodome where the vertical screen was used, 122 balls landed in the area behind the vertical screen, suggesting that the use of this screen will cause about 3 more GB per game to occur than if the sloping screen were used. An extremely small screen is used at Exhibition Stadium in Toronto, possibly contributing to the large number of GB observed there. Anther factor that varies from stadium to stadium is the area of foul territory in which a ball can be in play. Clearly, since the majority of all GB are hit into the lower stands, the larger the size of the area in foul territory which is in play, the fewer fouls that may be expected to be hit into the crowd.
Finally, it is known that the number of home runs differs at different stadia. For example, in 1979 and 1980 a total of only 94 home runs were hit at the Astrodome, fewer than at any other major league stadium. In contrast, the highest total number of home runs (355) was hit at Seattle. Thus home runs alone can account for differences of up to about 1 .6 GB/game at different stadia (i.e., 1.6 = (355-94)/l62 games).
Although the primary purpose of the present study was to analyze the incidence and causes of GB’s, the information collected about zones where batted balls land confirmed several beliefs that are commonly held by baseball players and enthusiasts. For example, it showed that right-handed batters have more difficulty making contact with balls thrown by right-handed pitchers than by left-handed pitchers, that right-handed batters swing and miss at 24 percent of till balls thrown by right handers, but only 19 per cent of the balls thrown by left handers. As expected, the data confirmed that batters are likely to “pull” grounders; however, we were surprised to discover that both right and left-handed batters hit about the same proportion of flies to right and left field.