

World Series Winners and Losers: What’s the Difference?
This article was written by Kent von Scheliha
This article was published in 2005 Baseball Research Journal
One hundred is a nice round number to use as the population basis for a statistical analysis of World Series winners and losers. With this wealth of data, certain burning questions might be addressed, and some surprising facts could emerge. What is it that differentiates the teams that win the World Series from those that lose? Is there a unique quality, a certain special ability, which the winners have and the losers do not? And more particularly, what the heck happened to the 1954 Indians?
Fundamentally, the ability to score and prevent runs is the best indicator of a team’s success. Let us then create something that we will call the Team Strength Index. Here’s how it works. In a given league in a given year, a normal distribution and standard deviation are created for runs scored per game and runs allowed per game, using the entire population of teams in the league as the statistical basis. The position of every team in the league on the two normal curves is located; in statistics, this position is called the z-score. The z-score is simply an indicator of how far a given score is from the mean score. Each team’s two z-scores (for runs allowed and runs scored) are added together to form its TSI.
Eagle-eyed statistical purists will note that the term “normal distribution” snuck into the preceding paragraph before we even switched on the floodlights. In any collection of random data, a normal distribution can be calculated and imposed, creating an aesthetically pleasing bell curve out of what may be a data distribution mess. In reality, the numbers could be quite crooked.
For an example league and year, the constituent teams might be clumped at the high and low ends of the range, with a no-man’s land in the middle. Or, there might have been a few powerhouse teams at the top, with everyone else crowded together at the bottom. In any distribution, there is a degree of skewness, a statistical concept whose discussion is beyond the scope of this essay.
Further, a data sample may more closely resemble any number of other types of statistical distributions. Rigid use of the normal distribution in this study is a simplifying assumption put in place to keep us from ascending into the statistics methodology stratosphere and suffering from the attendant lightheadedness.
Another important assumption being made here is that by simply adding the two z-scores for runs scored and runs prevented, we are presuming that offense and defense are equally important. No attempt is being made to put a weighting factor on either side of the ledger. Scoring and preventing runs are two sides of the same team coin.
So how does the Team Strength Index work? Example: In a hypothetical league, each side scores an average of five runs per game. Thus, the mean of the normal curve for both runs scored and runs allowed is five. Standard deviations are computed, based on the entire population of teams in the league, and are found to be 0.75 in both cases (equivalence is never true in reality, but we’re keeping it simple for the sake of argument here).
In this example, the team that the league sends to the Series happens to score an average of 6.5 runs per game and allow 3.5 runs per game during the regular season. Since they score at 1.5 runs better than the league average, their offensive component of the TSI (z-score) is equal to 1.5 divided by the standard deviation of 0.75, which is 2. Similarly, the defensive component is also 2 (the negative sign is reversed, since fewer is better). This gives our hypothetical squad a TSI of 2 + 2 = 4.
The point of rating each World Series team in relation to the rest of the teams in its respective league is to make valid comparisons. The average number of runs scored per game has ebbed and flowed over the years as baseball has evolved, so directly comparing a team from 2004 to one from 1903 would be meaningless. The game has changed so much over time (the Deadball Era, the advent of the basket glove, the lowered pitching mound, the designated hitter, interleague play, steroids, etc.) that you can meaningfully compare a team only to its peers.
The one intangible variable in all this is the relative strength of the two leagues in a given year. We have to assume that, over time, the AL and NL have had a fairly even distribution of talent and ability between them. It’s an assumption that has to be made for this study to have any meaning, even though in any year one can argue that league A is better than league B.
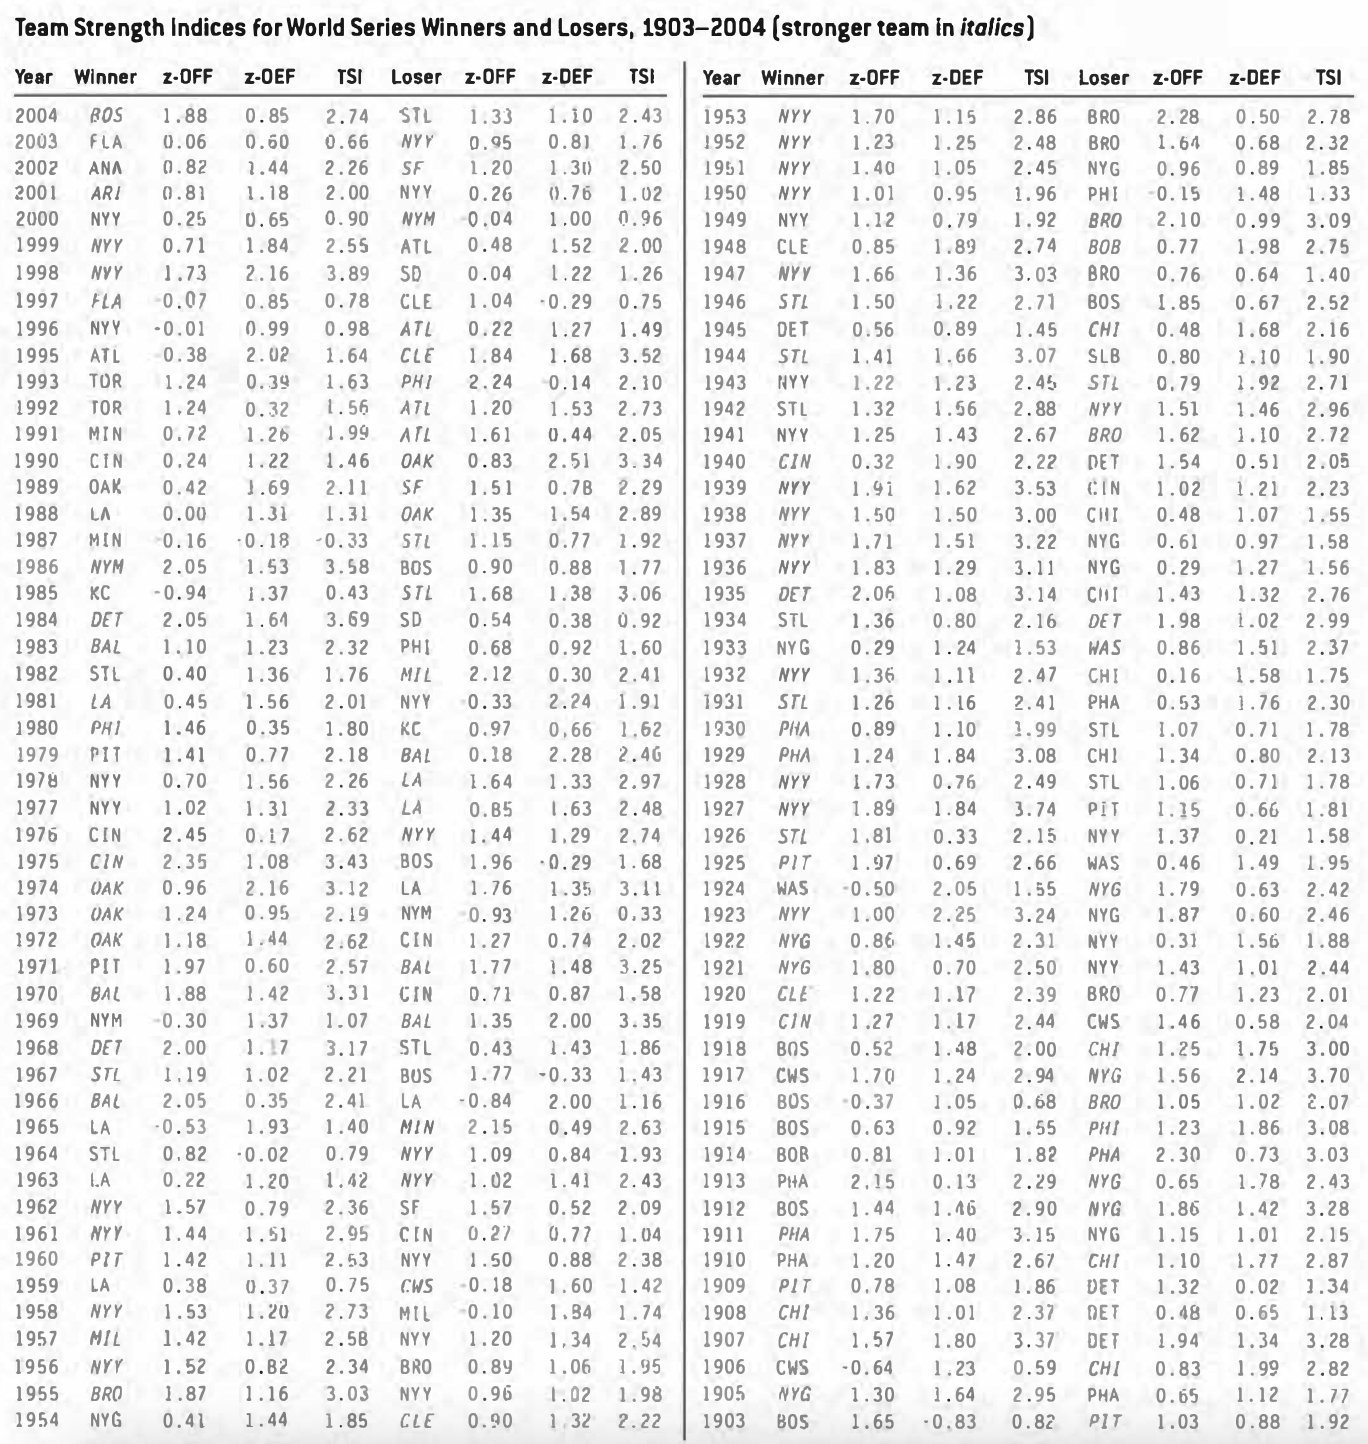
We now crunch the numbers for all 200 teams that have advanced to the Series, calculating a TSI for each one. The average World Series winner has a TSI of 2.259; losers show a TSI of 2.169. The winners are only 4% stronger than the losers on average. That’s it. Further, the stronger of the two teams emerged victorious only 56% of the time. So in a short series (most World Series were best-of-seven), the stronger team has a barely better than 50/50 chance of winning it all.
Another interesting point: on average, teams that go to the Series are slightly better at preventing runs than scoring runs. This fact holds true for both winners and losers. Winners are about 7% better at preventing than scoring; for losers, that number is 6%. So while winners are slightly stronger overall than losers, both are skewed toward the run-prevention side of the equation. We might then conclude that strong pitching and defense will get you to the Series more reliably than strong hitting, but there’s no advantage to be had once the Series begins.
Using the Team Strength Index, we can compare and rank all 200 teams. First, the monster teams:
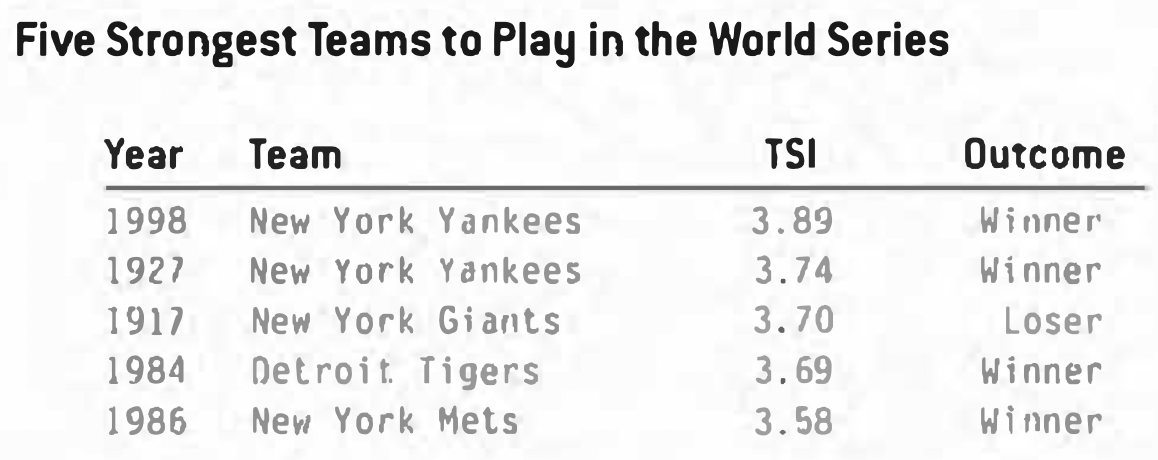
The ’98 Yanks stand as the best team in history, edging out their legendary 1927 namesakes. With a TSI of 3.89, they were leaps and bounds ahead of what anyone else was doing in the AL that year. On the other side of the ledger:
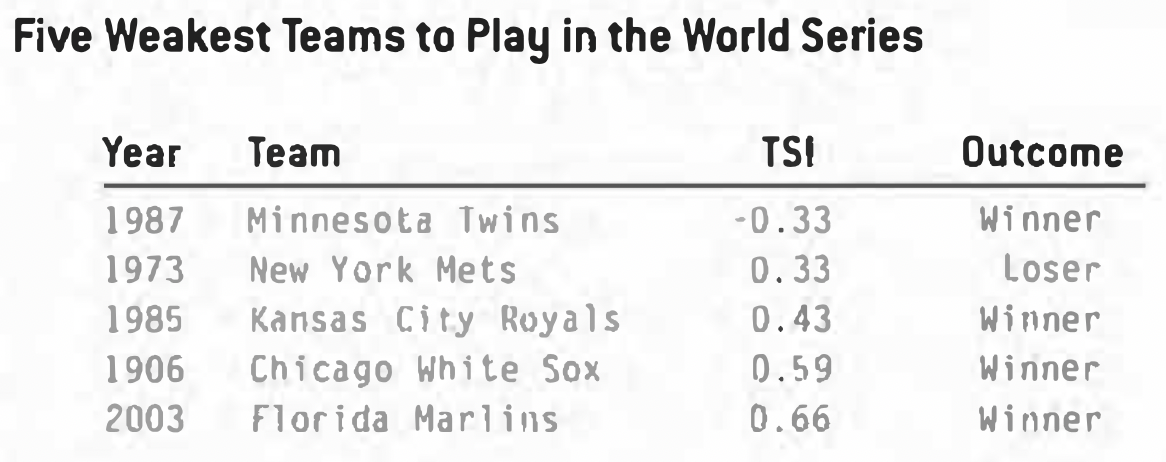
The ’87 Twins stand as the biggest anomaly in history. This is the only team out of the 200 that have played in the World Series to have been below average in its league in both scoring and preventing runs. They have the distinction of being the only World Series team with a negative TSI, perhaps proving that sometimes statistics don’t tell the whole story. Furthermore, the fact that out of the five weakest teams, only one lost, suggests that once the World Series begins, anything can happen.
Consider now the biggest mismatches in history. We define mismatch as the largest difference in TSI between the teams for each World Series pairing in which the stronger team won.
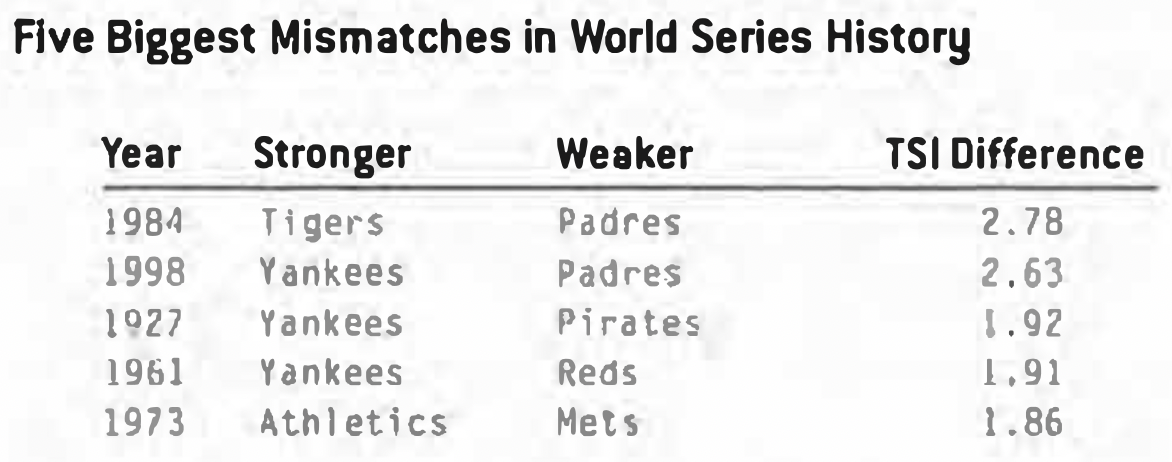
Let us not shed a tear for the Padres. Even though they came up empty-handed in two trips to the Series, they were on the wrong side of the two most lopsided matchups ever. Against the Tigers in 1984 and the Yankees in 1998, they never had a chance. The Team Strength Index also allows us to rank the upsets:
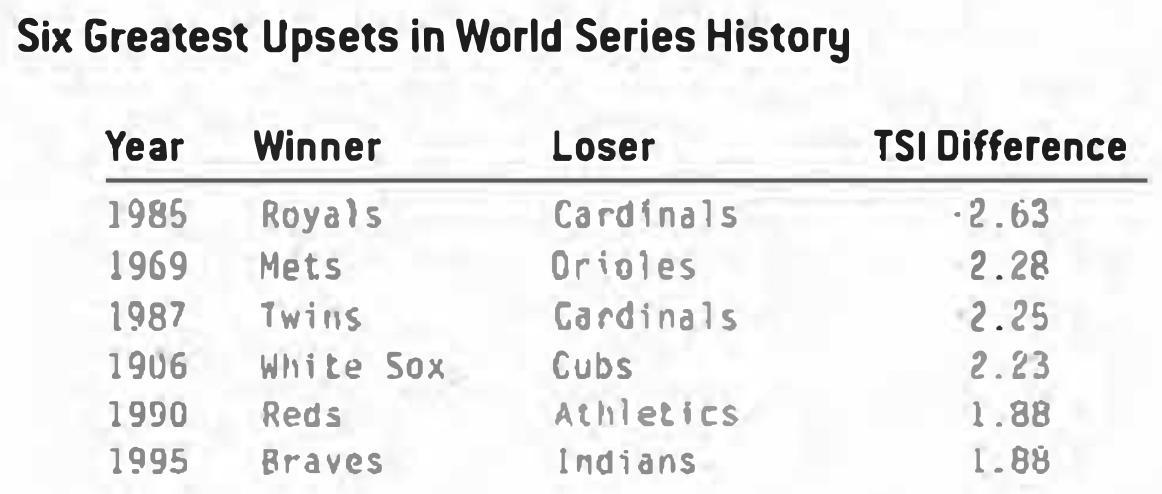
The Miracle Mets of 1969 can be considered only the second most miraculous winners of the World Series, dethroned by the ’85 Royals. Conspicuous by its absence from this list of upsets is the Giants’ win over the Indians in 1954. Baseball lore often cites this as the biggest World Series collapse ever. Yet in spite of Cleveland’s 111-43 regular season record, they were merely an average World Series team. Their TSI of 2.22 falls somewhere in the middle of the pack. While certainly an impressive squad, their ability to score and prevent runs does not indicate their eye-popping won-lost record. Could they be the team in history that caught the most lucky breaks in the regular season? Tellingly, their loss to the Giants ranks as only the 31st biggest upset.
By breaking out each team’s run-scoring and run-preventing components of the TSI, we can establish which teams that played in the World Series relied mostly on offense or defense. Here are the teams that were the offensive powerhouses.
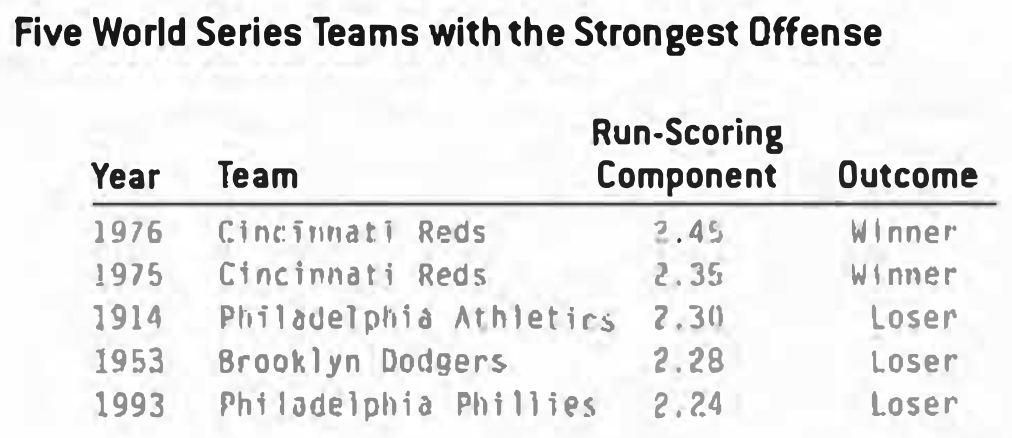
Yes, the Big Red Machine of the mid-70s certainly earned its reputation. Conversely, the teams that rode their defense (primarily pitching) to the World Series:
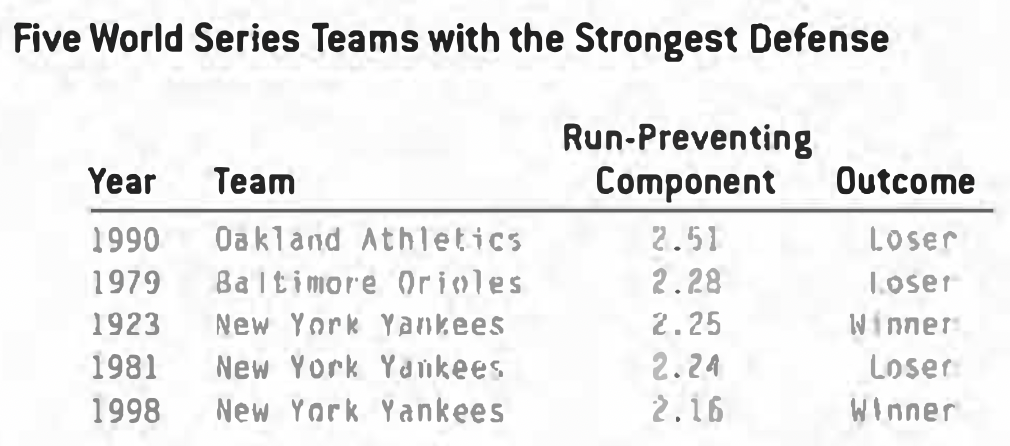
Curiously, being dominant either offensively or defensively does not consistently lead to a win in the World Series, as the last two tables seem to show. The most balanced team was the Yankees squad that won in 1938. Their TSI of 3.00 was comprised of identical run-scoring and run-preventing components of 1.50.
A few conclusions can be drawn from this study. As scholars of the game have long suspected, the World Series is simply too short for the stronger team to win consistently. While a best-of-31 series might favor victory for the stronger team, few baseball fans are going to have the patience and perseverance to watch the same two teams play each other night after night into December. And this is a good thing. The short series makes the outcome virtually unpredictable, giving hope to the underdog and riveting our attention for a week or so in October.
The fact that teams that go to the World Series are slightly stronger in pitching and defense than they are in hitting indicates something about the game itself. Many baseball people believe intuitively that pitching and defense can be relied upon more consistently than hitting. When the game is on the line, success is more likely to come from a timely strikeout or double play than it is from a clutch hit. The statistics here seem to support what managers already knew in their gut.
If you want to get to the Series, load up on pitching and be strong up the middle. That said, once you’re there, anything can happen.
KENT von SCHELIHA is a stress analysis engineer who works in the aerospace industry. He resides in Kirkland, Washington. His fantasy baseball team stinks.
(Click image to enlarge)