

Was the Price Right: Were Baseball’s Highest-Paid Players in 1921 Worth Their Salaries?
Editor’s note: This article was originally published in 2021 as part of the SABR Century 1921 Project.
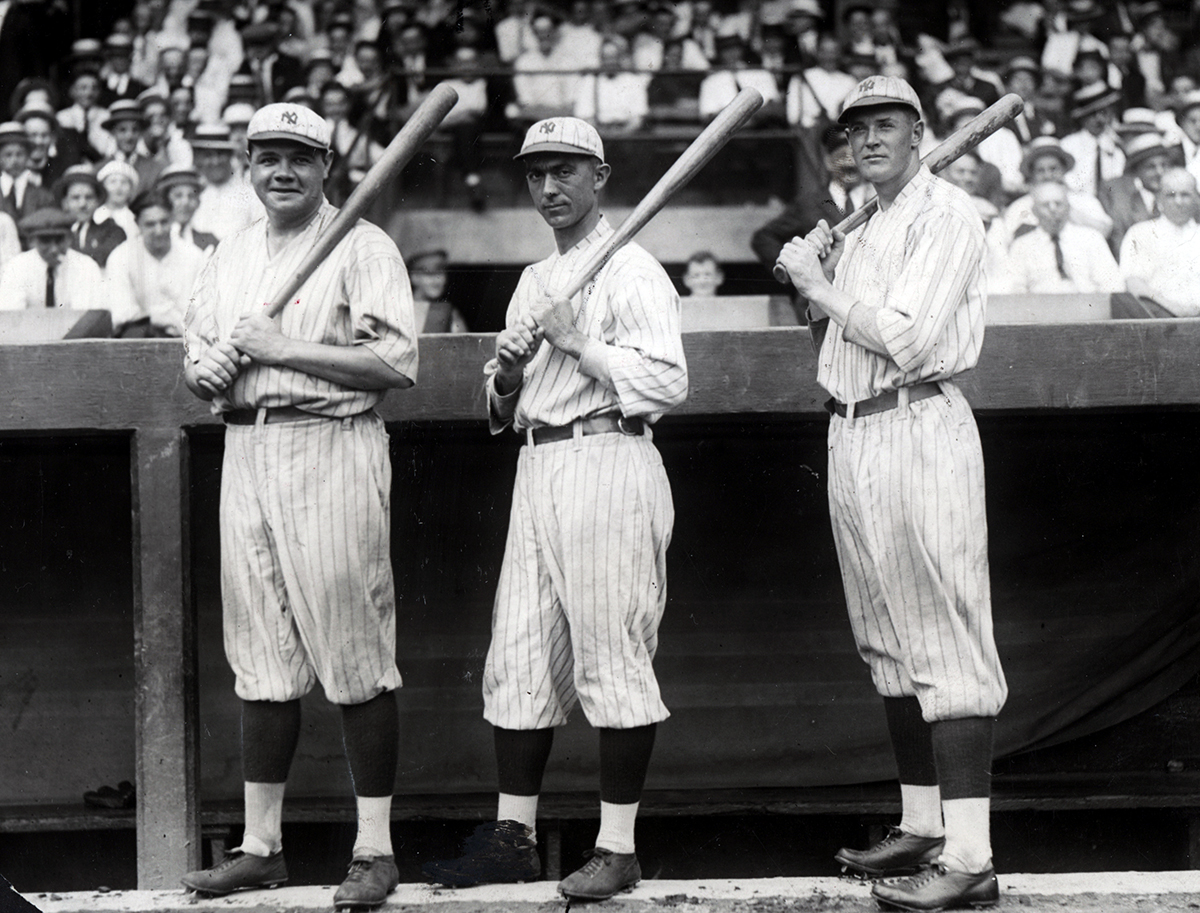 Babe Ruth, Frank Baker, and Bob Meusel were the Yankees’ first version of Murderers’ Row, leading the franchise to its first American League pennant in 1921. (SABR-RUCKER ARCHIVE)
In 1914 Frank “Home Run” Baker, the legendary Deadball Era slugger, hit the most home runs in baseball: nine. It was an impressive feat, and Baker, as an overall great hitter, attempted to get a raise from his manager, Connie Mack. But the Athletics’ co-owner refused to renegotiate Baker’s three-year contract.1 As a result the slugger sat out an entire season, and finally came back with the Yankees at a salary of $9,166.
But in 1921, the Deadball Era slugger wasn’t really a home-run hitter anymore, despite having one of the largest contracts in the league. That season Baker hit nine home runs, which would have been solid a decade earlier. But the top of the leaderboard was now held by the likes of Ken Williams, Rogers Hornsby, and, of course, Baker’s teammate Babe Ruth. The Bambino finished the season with an astonishing 59 home runs. Baker was now paid like the superstar he once was, except he wasn’t playing like one anymore. Baseball was changing fast.
The history of bad contracts is a long one in baseball, and all of them have a narrative behind them. High salaries might come from actual good performances, but also from former glory, reputation, biased performance indicators, or just pure hope. Even in today’s major leagues, despite all the analytics and money, one can still find plenty of bad contracts – which merely shows how hard it is to find the right salary. One might wonder why this is important, and the reason is simple. A team’s goal is to put players on the field, and win as many games as possible for the cheapest possible price.
This led me to an interesting question: How good were managers and owners at correctly valuing players? Or, put in a different perspective, how do salary and performance correlate in 1921? Sure, in 2021, with all the available data and performance metrics, one can imagine that a player with a high <insert your favorite statistic here> would get a big contract. But back then, one can assume batting average, runs scored, and RBIs were the kings of baseball metrics for everybody. And that includes the people paying the checks.
Methodology and data
To answer this question, or at least try to cast some light on it, I gathered the data of all 1921 National and American League players from Baseball Reference, including the salaries. Most of them came from Michael Haupert’s research of contracts.2 I then correlated these salaries with several metrics and pieces of information, for both batters and pitchers. If batting average was that important for managers, one might expect to see a high correlation between this metric and the player’s salary.
An important note is that we don’t have the salary of every player at that time. These players have been omitted from the data set.
Correlations are calculated using Pearson’s correlation coefficient. These coefficients are expressed by a value between -1 and 1. A value of 0 indicates no correlation, while anything between 0.5 and 1 generally indicates a strong one.
Ruth, Baker, Hornsby, and Friendly Batters
Let’s start by taking a look at the data, and then let’s interpret it together.
Correlations
|
Year |
Avg |
OBP |
Slg |
OPS |
HR |
Runs |
RBIs |
STL |
Age |
Count |
|
1921 |
.393 |
.416 |
.427 |
.446 |
.374 |
.454 |
.388 |
.377 |
.397 |
137 |
As one can see, I used the salary of 137 batters. These range between $25,000 (Ty Cobb) and $1,500, with an average of $5,518. However, only 42 of these players have a salary above the average.
The first thing one can notice in that table is that almost everything features a medium correlation. But surprisingly (or not), metrics that you might have expected as bigger factors, like batting average, home runs, or steals, are less important than what one might find with OPS. Of course, OPS hadn’t been calculated yet, but it means that hitting the ball was not enough. How hard a player was hitting it was also important.
Another interesting perspective is the difference between RBIs and runs. It appears that, while a factor, it was less important to drive runs than to actually score. This makes sense, given our previous observation. If you want to get paid, you better be able to hit and run the bases. Another possible explanation is that because RBIs were not calculated before 1920, the ability to drive in runs, at least as represented by this statistic, might not have been a big factor for contract offers yet.
One will also notice that the correlation between batting average and OBP is very, very close. Getting on base was already a popular idea.
Finally, one might see that age correlates in a medium fashion here. In 1921 experience was apparently a big factor when it came to salaries. Actually, if one takes the 20 highest-paid players, only two of them are younger than 27, Babe Ruth (26) and Hornsby (25), while 10 are older than 30 (so probably beyond their prime). In that group, we find Frank Baker once again, paid $13,000 (ranked sixth) for a 99 OPS+.
Overall, it’s hard to find one big factor when considering salaries and metrics. Yet, it means that managers were doing an overall good-enough job. These correlations are not high, but rather homogeneous.
One caveat here is that we did not evaluate any defensive metric. But given that half of the top 10 didn’t even have a positive dWAR, I don’t think we would have a bigger correlation with it. Which doesn’t mean defense was not part of the equation when it came to contract offers. It certainly was, but given how difficult it can be to accurately measure defense abilities, a correlation between advanced defensive metrics and salaries would be unexpected in my opinion.
Looking for exceptions
When it comes to baseball, it’s often very easy to find exceptions. I stated above that owners and managers did a good-enough job at evaluating players and paying them accordingly. But there are also plenty of cases where this is clearly not the case.
I mentioned Home Run Baker being the sixth highest-paid player in the league while having an OPS+ of 99. But there are reasons for that. His former glory probably played a role, and also the fact that he got his high salary before Babe Ruth started to hit home runs all over the country’s ballparks. In essence, he was still a symbol of the Deadball Era.
And what about Larry Kopf, earning at least $8,000 while producing an OPS+ of 57 and an oWAR of -0.4 (for a total -0.4 WAR)? Despite that, Kopf would be traded to the Boston Braves for two more years, producing disastrous statistics before he retired to take care of his gasoline stations.3
On the other hand, future Hall of Famer Harry Heilmann played for a barely-above-average salary of $6,000 while getting the batting title and an OPS+ of 167. According to the Bill James Historical Baseball Abstract and The Sporting News, his salary was closer to $7,500, but even at this price it was a bargain for a player with so much talent. He finished fifth in the bWAR ranking among position players at 6.8 (despite a -1.2 dWAR). Heilmann received a significant raise in 1922, receiving $12,500 – proof that his talent was finally recognized.
Comparing with modern players
One thing I wanted to do when interpreting these correlation factors was to compare them with modern numbers. After all, one might expect the correlations to be very high nowadays. But this is a pretty complex task, for the simple reason that a large part of the best players in baseball today have ridiculously low contracts. Aaron Judge, for example, received $684,300 in 2019, his third complete year in the majors.
When young talents are paid such low amounts, it becomes hard to correlate anything. Sure, one could only analyze players paid more than an arbitrary set salary, but then you also end up with a lot of old players carrying bad contracts. In the end, I preferred leaving this for another time, and not playing with confirmation biases.
Vaughn, Walter Johnson, and the workhorses
The pitchers’ data set is more limited than the batters’ ones, but one can immediately notice some interesting things.
|
Year |
ERA |
IP |
K |
Wins* |
Age |
Count |
|
1921 |
-0.307 |
.483 |
.508 |
.276 |
.550 |
98 |
* For wins, only 56 pitchers with at least one win qualify
In 1921 the highest-paid pitcher was Bill Doak, with a salary of $12,500. The lowest was Garland Braxton, paid $1,200. There was an average of $4,632 among all counted players. Out of 98 pitchers, only 38 of these players have a salary above the average.
Note: A negative correlation means that when one number goes up (salary), the other one goes down (ERA). Which makes sense, given that the best pitchers have a lower ERA.
Let’s start with the obvious: ERA. While there is a correlation, it’s not a strong one. In 1921, ERA had already been around for a while; the NL had started tabulating it almost a decade earlier. But even if it wasn’t widely used, it might sound obvious that the best pitchers should be the ones who allow the fewest runs, and thus should receive larger salaries. However, data suggest it wasn’t always the case.
In the same spirit, the wins correlation might come as a surprise. I think one can interpret this in two ways: either wins were not that important to managers and owners, or this was regarded as a pretty useless statistic that could be high for almost any pitcher, since it depends heavily on team performances.
On the other hand, strikeouts seemed to be an important factor, just like the number of innings pitched. I infer that managers favored pitchers who could go the distance, with a large number of K’s. We know now that pitchers who can strike out more hitters typically will allow fewer runs. This is a strong sign of biases in evaluating performances of pitchers. In 1921, being a workhorse with a strong arm was the best way to get a big salary.
Once again, age is an important factor –the most important among the metrics used for correlation here. No pitcher younger than 27 is in the top 20, and only five of them are in the top 50! For sure, experience was a big factor in 1921. But at the same time, the average age is 27, about a year younger than that of batters.
It’s well known that pitchers back then were used more than modern pitchers are. But this also led to a lot of dead arms, and it’s not hard to imagine some players being totally out of juice by age 30 or so. Carl Mays, the second highest-paid player among pitchers, pitched 336⅔ innings in 1921. That’s way above the 223 innings pitched by Justin Verlander in 2019. It also means that the pitchers not able to carry on that infernal rhythm might end up retiring more quickly. This forces managers and owners to bring younger arms, and keep the ones that can pitch a lot. Apparently, to their eyes, this was more important than actual efficiency on the field.
Underpaid talent
The 1921 pitchers’ data contains plenty of underpaid talents. That includes Hall of Famer Stan Coveleski, paid barely above average while producing 7.3 bWAR. But also Dolf Luque, pitching 304 innings while keeping an ERA+ of 105 ($5,000), and Jesse Haines, paid $4,000 while pitching 244⅓ innings with a 104 ERA+. These are just examples, and one can find plenty of them.
On the other hand, there don’t seem to be that many overpaid pitchers, with the notable exception of Hippo Vaughn. In his last season the 33-year-old pitched only 109⅓ innings while producing a 6.01 ERA with a $9,633 contract, the fifth-highest in the league at that time. He never played in the majors again, after a complicated story with his club during the summer of 1921. And given how good he had been during previous seasons, I’m sure most teams would have given him a good contract. Maybe the price was actually right?
Conclusion
As we’ve seen, there’s a clear difference in the way batters and pitchers were considered, at least moneywise. Most of the metrics used describe a situation where managers and owners consider a broad range of skills, not only batting average or steals for example. Though with the end of the Deadball Era, power would probably become more of an important factor.
On the other hand, pitchers were clearly paid based on their power, experience, and endurance, with far less regard paid to their actual impact on the number of runs scored. And that, despite the fact that ERA was already around.
It was 1921, and the analytics movement still had a long way to go before gaining the status and complexity it has today. Hopefully this change has been for the better.
Sources
In addition to the sources cited in the Notes, the author consulted Baseball Reference.com and Retrosheet.org, and the following:
Jordan, Douglas J. “Eras of ERA,” thesportjournal.org, https://thesportjournal.org/article/eras-of-era/, accessed February 1, 2021.
King, Steven A. “When Did Frank Baker Become ‘Home Run‘ Baker?,” sabr.org, https://sabr.org/journal/article/when-did-frank-baker-become-home-run-baker/, accessed February 1, 2021.
Pomrenke, Jacob. “1919 American League salaries,” sabr.org, https://sabr.org/journal/article/1919-american-league-salaries/, accessed February 1, 2021.
Posnanski, Joe. “The Long Sad History of Injured Pitchers,” nbcsports.com, https://mlb.nbcsports.com/2013/08/28/the-long-sad-history-of-injured-pitchers/, accessed February 1, 2021.
Notes
1 David Jones, “Home Run Baker,” sabr.org,
https://sabr.org/bioproj/person/home-run-baker/, accessed February 1, 2021.
2 Michael Haupert, “MLB’s annual salary leaders since 1874,” sabr.org,
https://sabr.org/research/article/mlbs-annual-salary-leaders-since-1874/, accessed February 1, 2021.
3 Jim Sandoval, “Larry Kopf,” sabr.org,
https://sabr.org/bioproj/person/larry-kopf/, accessed February 1, 2021.