

Team Batting Average: A Comprehensive Analysis
This article was written by David Macias - Douglas Jordan
This article was published in Spring 2019 Baseball Research Journal
It’s July 1 of any year. Your favorite team has played about half the season and has been struggling at the plate recently. The team batting average (BA) is .234 compared to the league average of .246. This solitary datum indicates that the team’s BA is well below the league average. But what is the history of team BA over the course of the season? Has the team been consistently below average or is this a result of their recent struggles at the plate?
One of the primary results of the analysis done for this paper is to show what happens to team BA over the course of a season and to see if there are any league-wide similarities over the course of a season. Once this analysis is complete, we will be able to establish how many games into the season are necessary to draw a conclusion about a team’s batting ability.
At the beginning of a season, people will sometimes say it’s too early to draw any conclusions about a team. For example, on April 12, 2018, with the San Francisco Giants’ record at 5-6, Grant Cohn wrote, “It’s way too early to make statements etched in stone about the Giants.”1 But just 17 days later when the Giants’ record was 13-14, C.W. Nevius stated, “ [D]on’t tell us it is early. If last year taught us anything, it is that the way a team starts a season can be an excellent predictor of how it ends a season.”2 How long does it take to be able to draw a reasonable conclusion? Does it require 50 games, 40 games, 20 games, or is it even fewer? The surprising conclusion from this analysis is that at the 16-game mark (roughly 10 percent of the season) you can be fairly certain whether a team will be weak-hitting or strong-hitting for the entire season.
Methodology
Retrosheet, provides game logs for every MLB game played during a season. These game logs provide hitting, pitching, and fielding data for both teams, which include hits and at bats for each team for the game. In order to perform the analysis in this paper we wrote a Visual Basic program to extract hits and at bats from the Retrosheet data for each game during a season. The data were aggregated game by game. This allowed team BA to be calculated after every game and a season-long series of team BA to be constructed. MLB data for the five years 2013–17 were used to provide the data for the analysis. The final team BA for every team, for each year, was compared with the final team BA shown in Baseball-Reference.com in order to ensure that the calculations were accurate. No discrepancies were found.
Results: Part 1
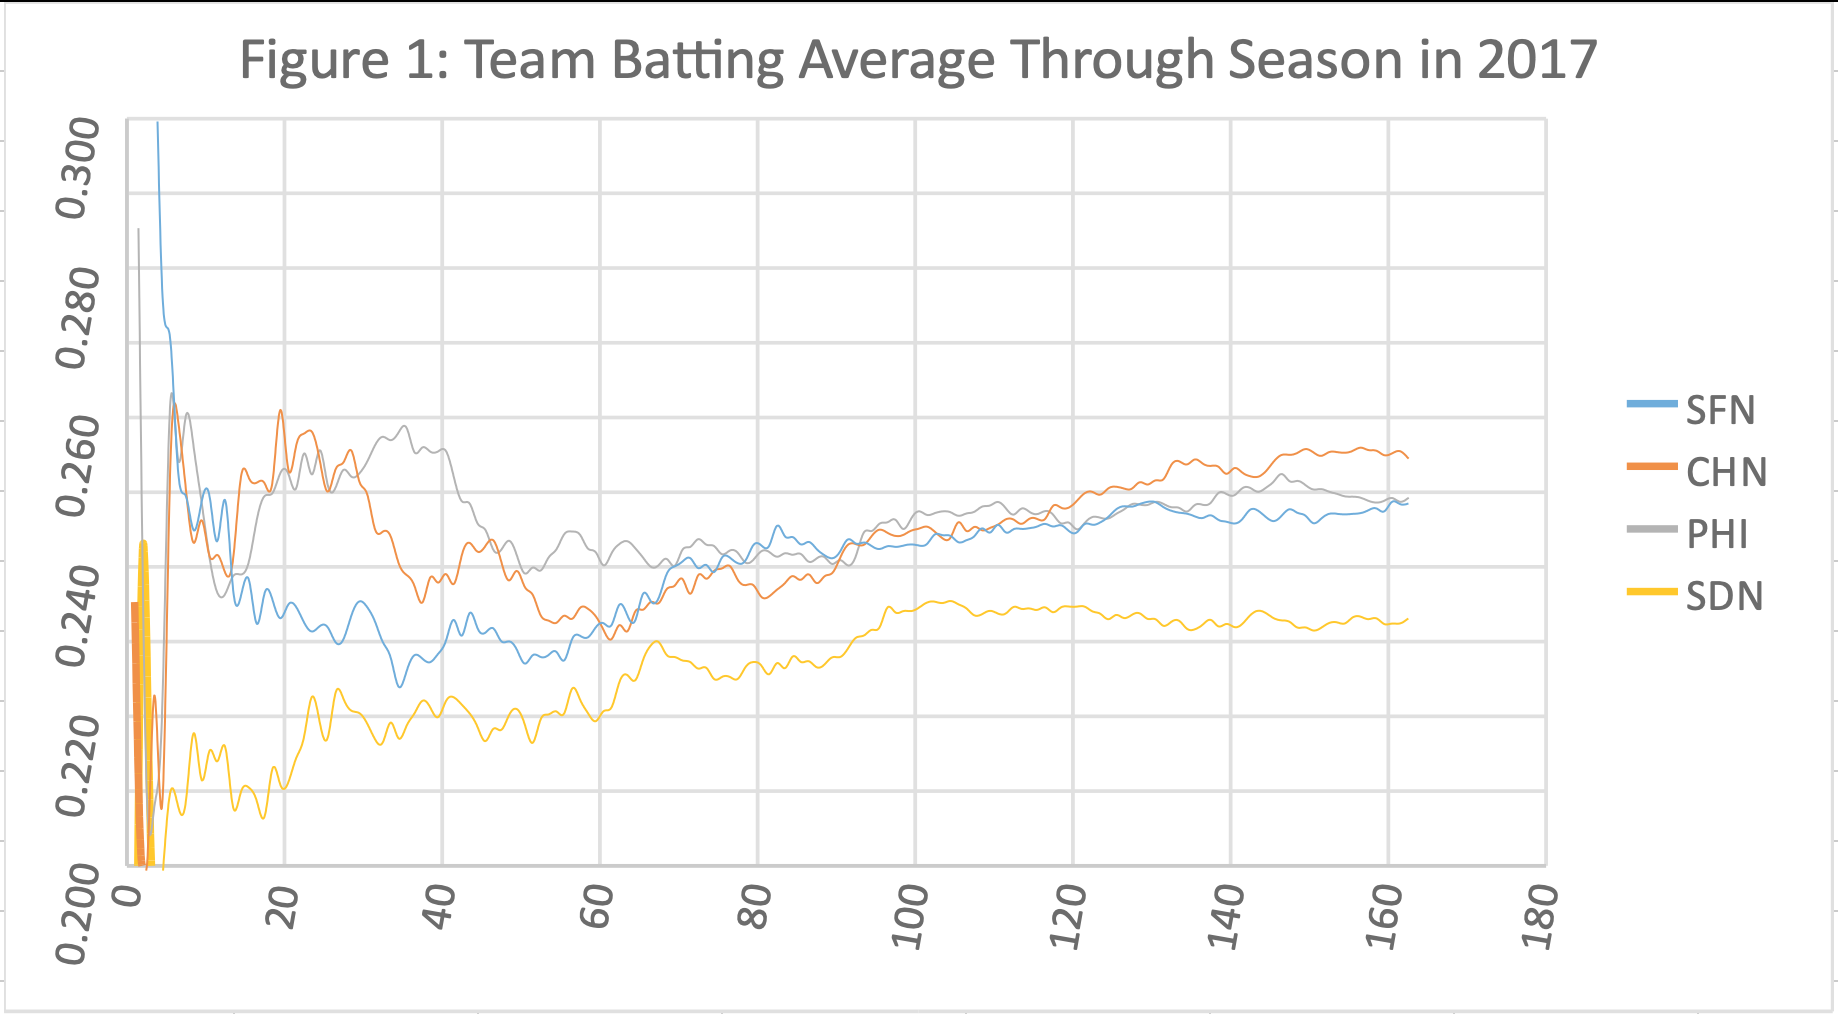
The data described above are used to produce a graph of a team’s BA as the season progresses. Figure 1 shows the plots for four randomly chosen NL teams in 2017.
Figure 1: Team Batting Average Through Season in 2017
(Click image to enlarge.)
Team BA varies considerably over the course of a season. The Giants’ BA declined consistently over the first 35 games of the season before bottoming at .225, and then climbing thereafter to finish at about .250. Philadelphia’s BA peaked at .260 at game 34, then declined to .240 over approximately the next 20 games, before finishing at .250. Seeing how team BA changes through a season is interesting, but those raw data can be used to answer more interesting questions. The team BA at the end of the season is the most accurate representation of how they batted in aggregate. We can use the data to find out how quickly teams approach their final season BA. To do that, the difference between the team BA at any point in the season and the final team BA is calculated. The results for the same four teams in Figure 1 are shown in Figure 2.
Figure 2

(Click image to enlarge.)
The graphs shown in Figure 2 are all within about five points of the final team BA by game 120 of the season, and three of the four are within five points by game 100. Except for the Cubs, the Figure 2 curves are roughly flat after game 100, which suggests that team BA for most teams doesn’t change too much after that point of the season. However, four teams is too small a sample to draw any general conclusions, so this analysis is repeated for all MLB teams for 2017. The results are shown in Figure 3.
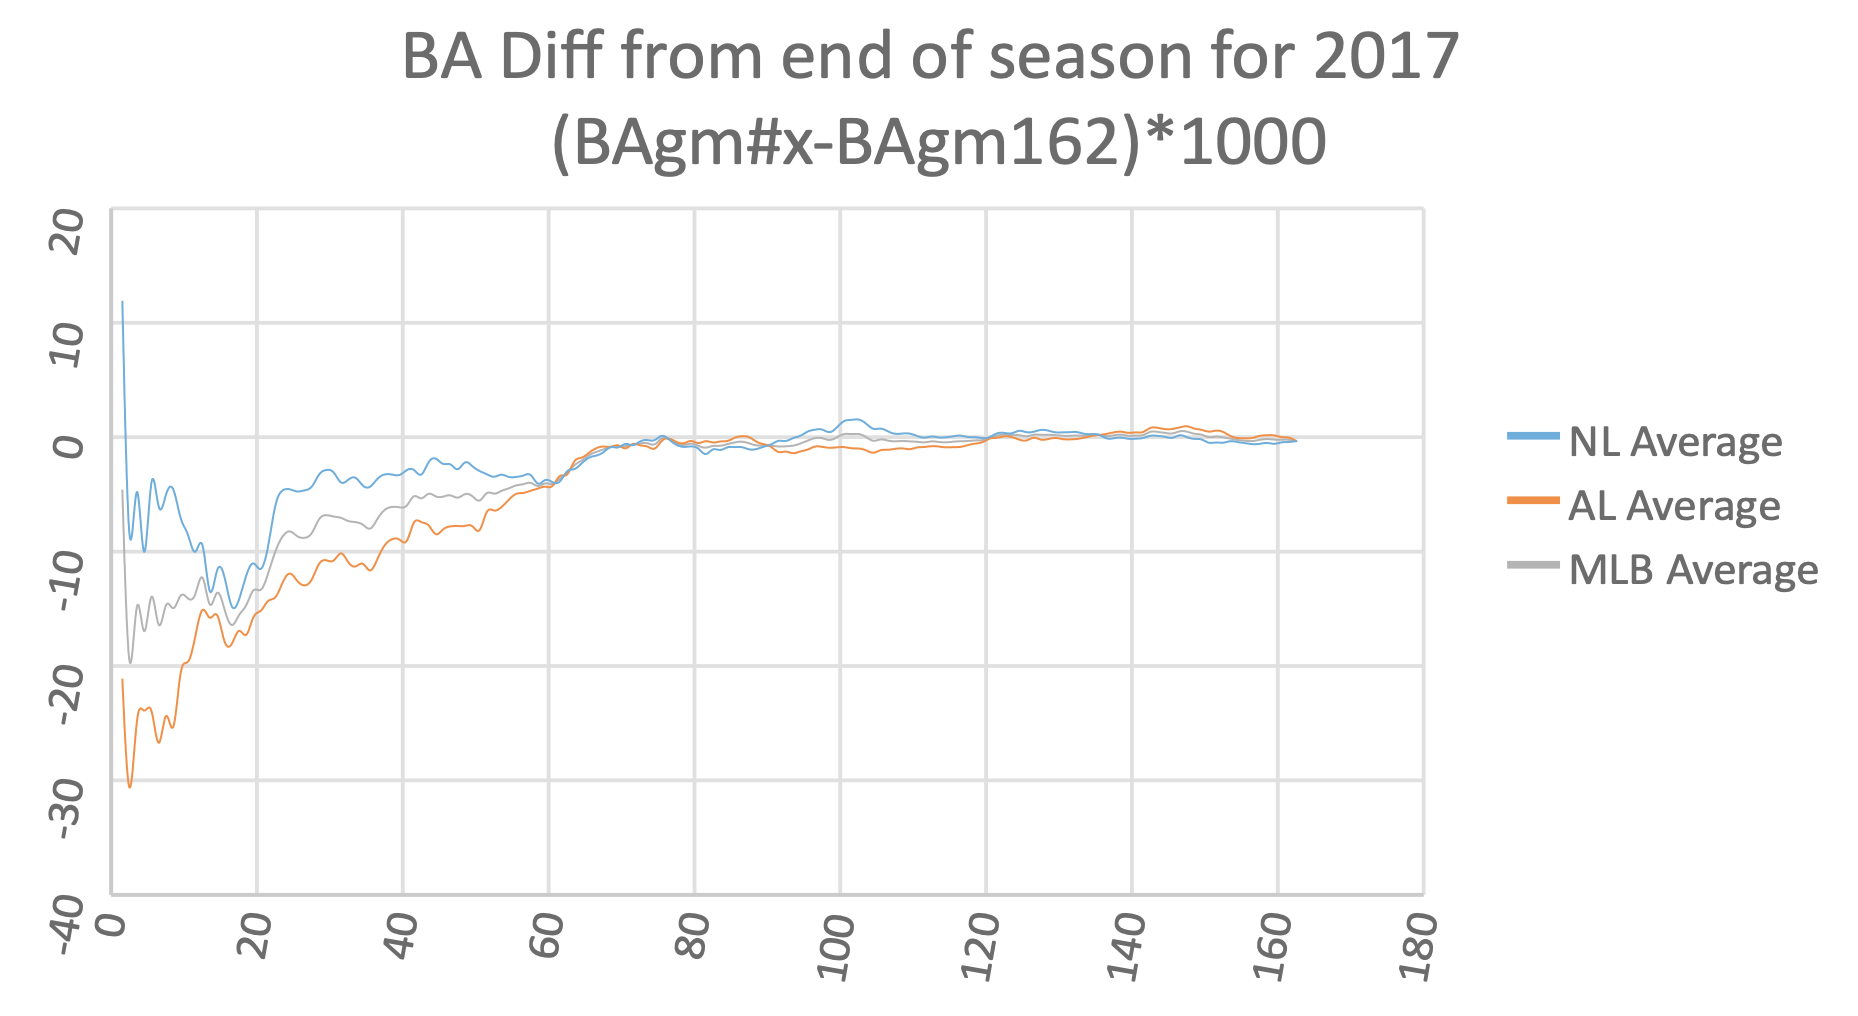
Figure 3: BA Difference From End of Season For 2017
(Click image to enlarge.)
The results shown in Figure 3 clarify the smaller sample result in Figure 2. In 2017, team BA rose from game 20 to game 70 for MLB. For MLB as a whole, team BA rose by about 13 points from game 20 to game 70. Thirteen points is a large increase. On average, team BA improved significantly until about halfway through the season. Of course, this is only one year’s results. Does the same thing happen in other years? Figure 4 shows what happened in MLB overall for the years 2013–17.
Figure 4
(Click image to enlarge.)
Figure 4 shows that the general trend of team BA increasing over the first half of the season also occurs in 2013–17. In addition, the tendency increases from 2013–17. The increase in team BA over the first half of the season is larger in 2017 than in any of the other years.
This result matters because people may draw erroneous conclusions if they don’t know that team batting averages tend to rise until about mid-season. For example, in an article about no-hitters written roughly one-quarter of the way through the 2018 season, Dave Sheinin states, “Meantime, the league wide batting average of .245 (down 10 points from 2017 and 26 points from 1999) is at a 46-year low.”3 Sheinin is comparing end of season MLB baseball batting averages with an early season MLB batting average. Based on the result of this paper’s analysis, it’s very likely that the MLB batting average at the end of the 2018 season would be higher than .245, which would refute the point Sheinin is trying to make.
Finally, the Figure 4 result provides an answer to the perennial question of whether pitchers or hitters have an advantage early in the season. Jason Catania explored this question at the beginning of the 2014 season and concluded, “So while you might have expected pitchers to have an advantage early on relative to the rest of the season … the results don’t always bear that out, at least in recent years.”4 In contrast to what Catania found, Figure 4 shows (at least recently) that pitchers have an advantage over hitters in terms of batting average during the early stages of a season.
Results: Part 2A
There is another interesting question that can be examined, given the time series of team BA that was used to generate the previous results: How many games into the season does it take to determine a team’s batting prowess? Obviously, a game or two is not sufficient, but how many games into the season are required to draw a reasonably accurate conclusion about whether a team will be a strong- or weak-hitting team over the course of the season? “Common wisdom” has said that it can take 30-40 games to know the true character of a team. Those numbers are anecdotal. What do the actual data say?
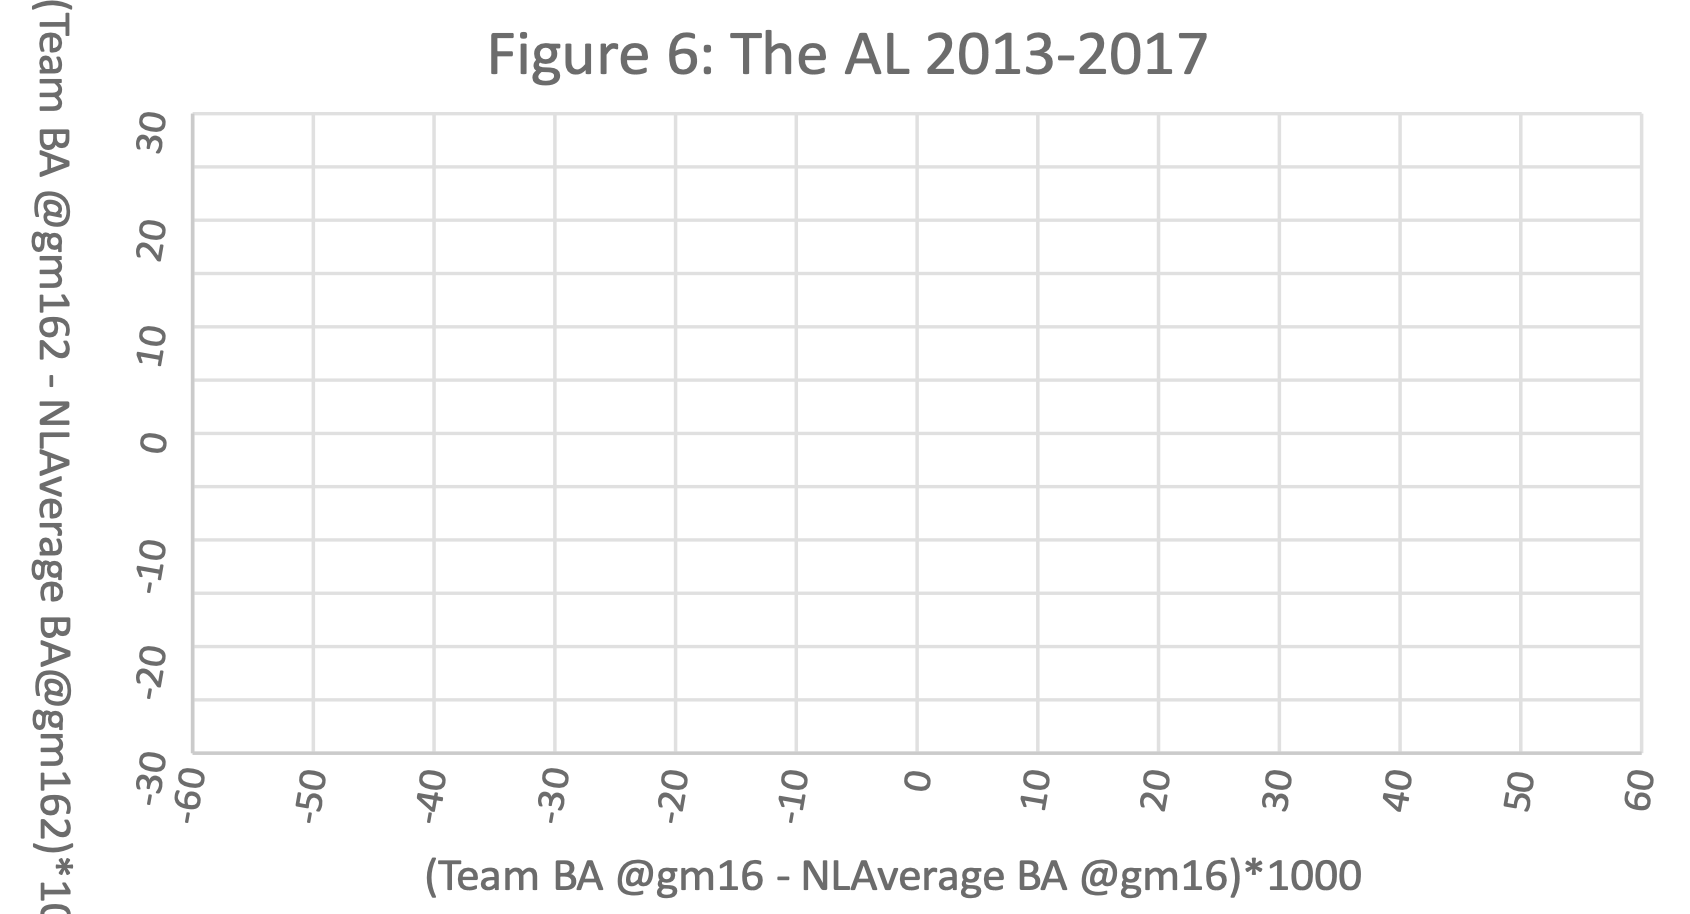
To analyze this question, we compared team batting averages to the league average at 16-game intervals through the first half of the season. Sixteen games is chosen because it represents about 10 percent of the season. Those differences are compared to the difference from the league batting average at the end of the season. For example, in 2017, the Giants were batting .233 after 16 games, while the NL overall batting average was .240. At the end of the season, the Giants were batting .249 while the NL overall batting average was .254. The differences between these pairs of numbers, -.007 and -.005, are multiplied by 1000 to become one point in Figure 5. The same analysis is done for all fifteen NL teams for 2013–17 to generate the 75 datum points shown in Figure 5. The same analysis is done separately for the AL (because of the designated hitter) with the results shown in Figure 6.
Figure 5: The NL, 2013-17
(Click image to enlarge.)
Figure 6: The AL, 2013-17
(Click image to enlarge.)
A linear regression is run to establish the relationship between team BA differences at game 16 and team BA differences at the end of the season. The regression lines are the dotted lines in the two figures, with the equations and regression coefficients shown in the upper right corner of each figure. The coefficients of 0.26 for the NL and 0.21 for the AL show two things. First, the relationship between the differences in team BA at game 16 and team BA at game 162 is positive, so a higher (lower) team BA difference at game 16 will tend to indicate a higher (lower) team BA difference at game 162. The magnitude of the coefficients indicates that if the team BA at game 16 is 10 points above (below) the league average, then the best estimate of team batting average at game 162 will be 2.6 (NL) and 2.1 (AL) points above (below) the league average at game 162. The t-statistic associated with the NL coefficient of 0.26 is 4.8 and the t-statistic associated with the AL coefficient of 0.21 is 4.6. Both of these t-statistics are statistically significant at the one percent level, and indicate that there is a strong relationship between the difference in BA at game 16 and the difference in BA at game 162. In other words, looking at a team’s BA compared to the league average at game 16 of the season can give you a pretty good idea of how the team’s BA will be compared to the league at the end of the season. The diagnostics associated with the regressions in Figures 5 and 6 are shown in the Appendix.
Results: Part 2B
The fact that there is a statistically significant relationship between team BA differences at games 16 and 162 is important, but not very useful in practice. However, it would be useful to know how likely it is that a weak (strong) hitting team at game 16 will be a weak (strong) hitting team through the rest of the season. The data in Figures 5 and 6 allow us to answer that question. We ignore teams whose BA is within five points of the league average at game 16 (those between the two heavy vertical lines). These teams are hitting near the league average, so for one of them to finish the season above or below the league average would not be very surprising.
That leaves Figures 5 and 6 divided into six quadrants that are labeled Q1, Q2 etcetera. The points in Q1 represent teams that were more than five points below the league average at game 16 and were more than five points below the league average at the end of the season. For these teams, their performance at game 16 accurately predicted their below average performance at game 162. Points in Q3 represent teams that were batting more than five points below the league average at game 16 but are more than five points above average at season’s end. These teams saw significantly improved batting performance over the course of the season. Similar statements can be made for the teams in Q4 and Q6 except that teams in Q6 saw significantly worse batting performance as the season progressed.
The numbers of teams in each quadrant allows us to assess a probability that a team that is in Q1 or Q4 at game 16 will stay there. For example, in Figure 5, there are 26 teams who were batting more than five points below the league average at game 16. Thirteen of those teams were also batting five points or more below league average at game 162. The analogous numbers for the AL in Figure 6 are 32 and 16. Combining the data for the two leagues together yields a total of 29 out of 58 teams that remained in Q1 between game 16 and game 162. This is exactly half, or 50 percent of the teams. The combined numbers for both leagues in Q4 are 26 out of 60, or 43 percent. These results show that a below-average batting average team at game 16 has a 50 percent chance of being a below-average batting average team for the whole season. The data in Q4 show that above-average hitting teams at game 16 have a 43 percent chance of staying above-average for the whole season. It’s also important to note that a below-average hitting team at game 16 has only a 6 out of 58 chance, roughly 10 percent, of ending the season with a BA more than five points above the league average. An above-average hitting team at game 16 has a 10 out of 60 chance, 17 percent, of hitting more than five points below average by the end of the season.
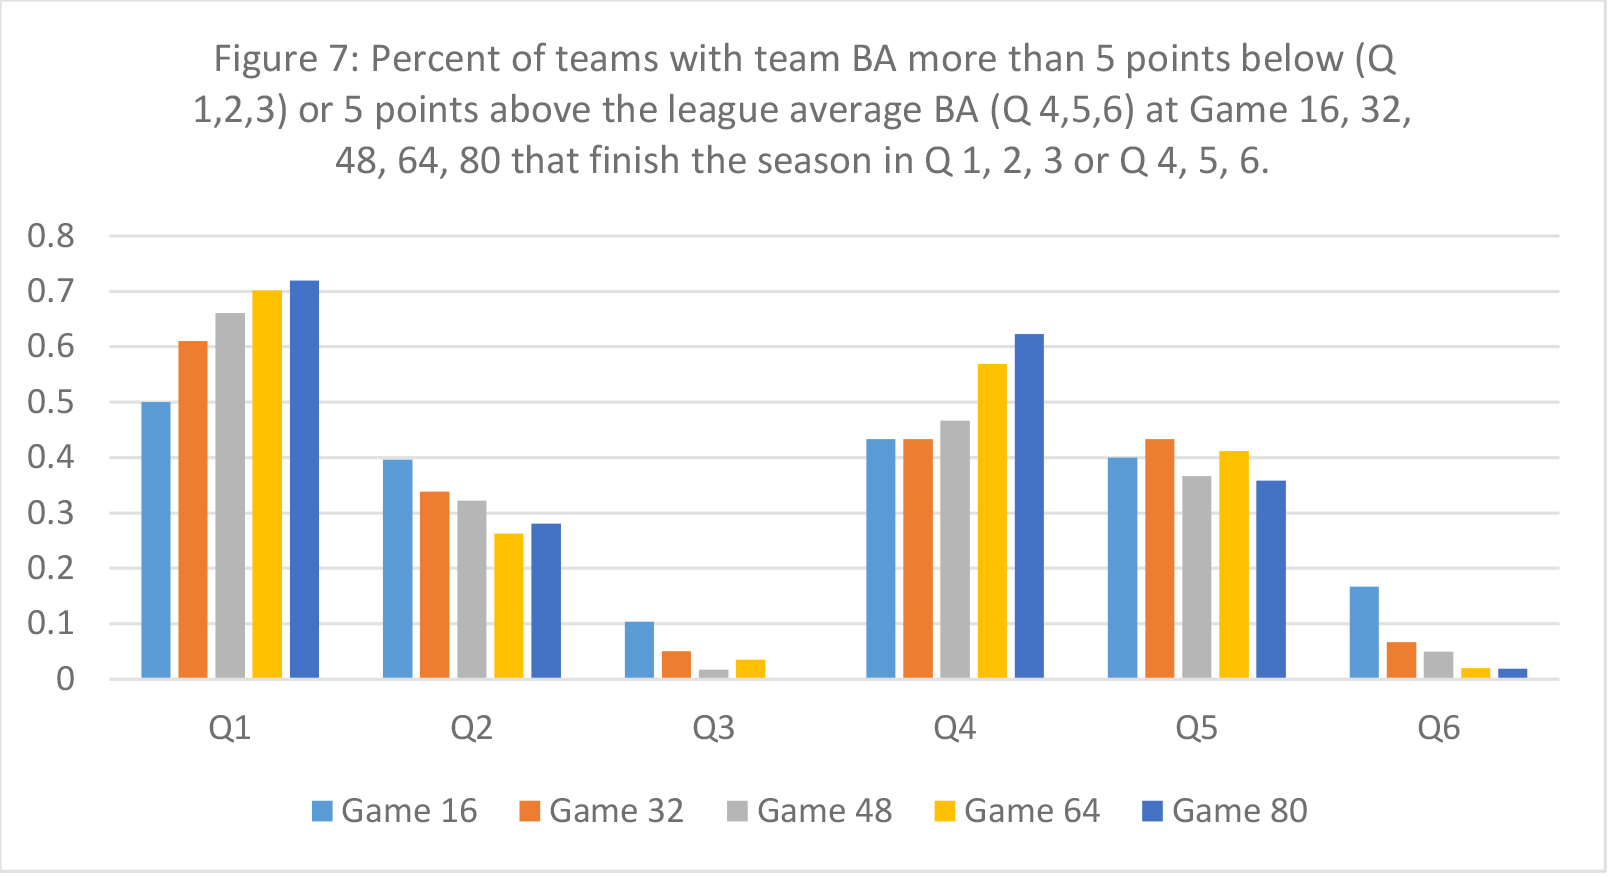
These results suggest that weak or strong hitting teams at game 16 tend to stay that way. But what happens as the season progresses? Data that are applicable at only one point in the season aren’t very useful. Therefore the analysis just described was also done at the 32, 48, 64, and 80 game marks of the season. The results are shown in Figure 7.
Figure 7
(Click image to enlarge.)
Figure 7 shows what happens as the season progresses. The Q1 and Q4 results show that the percentages of weak (strong) hitting teams that stay that way over the course of the season increase as the season progresses. For example, in Q1, 70 percent of the teams that are hitting poorly at game 64 of the season will stay that way, compared against 50 percent at game 16. Only two out of 57 teams—3.5 percent—that were hitting below average at game 64 ended the season more than five points above the league average. The Q3 results as a group show that the chances of a weak hitting team improving to hit five points or more above the league average by the end of the season start at ten percent and decline as the season progresses. It is interesting to compare the Q1 and Q4 results as groups. The lower percentages in Q4 show that it is more likely that teams that are hitting well early in the season will see deteriorating hitting performance. The slightly higher percentages in Q6 as a group compared with Q3 tell the same story.
Conclusion
Data for 2013–17 show that team batting averages tend to rise over the first half of the season for MLB as a whole (Figure 4). The difference between team BA and the league average at games 16, 32, 48, 64, and 80 is plotted against the difference between team BA and the league average at the end of the season (Figures 5, 6). The results show that there is a statistically significant relationship between these two differences, even at game 16 of the season. In other words, it only takes about 10 percent of the season to get a reasonably good idea if a team is going to be a strong- or weak-batting average team for the whole season. Finally, Figure 7 shows that a team that is batting at least five points below (above) the league batting average at game 16 has a 50 percent (43 percent) chance of hitting more than five points below (above) the league average at the end of the season.
DOUGLAS JORDAN is a professor at Sonoma State University in Northern California where he teaches corporate finance and investments. He has been a SABR member since 2012. He runs marathons when he’s not watching or writing about baseball. Email him at douglas.jordan@sonoma.edu.
DAVID MACIAS is a Faculty Member at Sonoma State University in Northern California where he teaches Accounting and Income Tax. David has also been a manager in a Research Organization and a SABR member since 2018. The article “Team Batting Average: A comprehensive Analysis” is his first contribution to the BRJ. He plays golf when he’s not watching baseball. Contact David at maciadav@sonoma.edu.
Notes
1 Grant Cohn, “Missed Opportunity,” The Press Democrat (Santa Rosa, CA), Sports section, page 1, April 12, 2018.
2 C.W. Nevius, “Creaky Giants ship continues to take on water,” The Press Democrat (Santa Rosa, CA), Sports section, page 1, April 29, 2018.
3 Dave Sheinin, “No-hitters (and near-misses) show how MLB is changing — but is it for the better?” Washington Post, May 11, 2018. https://www.washingtonpost.com/news/sports/wp/2018/05/11/no-hitters-and-near-misses-show-how-mlb-is-changing-but-is-it-for-the-better/?utm_term=.cc69f31525f1
4 Jason Catania, “Do Hitters or Pitchers Have the Upper Hand Early in the MLB Season?” April 1, 2014, https://bleacherreport.com/articles/2013296