
The 1906-10 Chicago Cubs: The Best Team in National League History
This article was written by Bryan Soderholm-Difatte
This article was published in Spring 2011 Baseball Research Journal

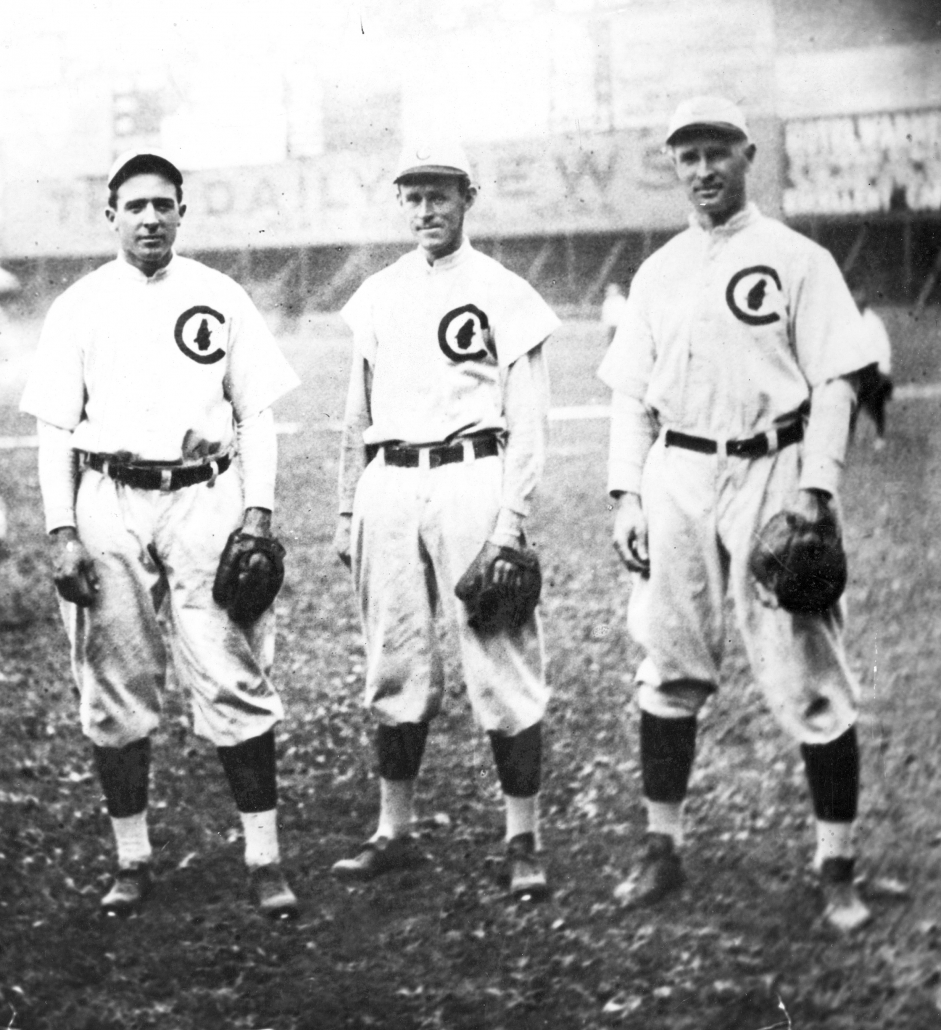
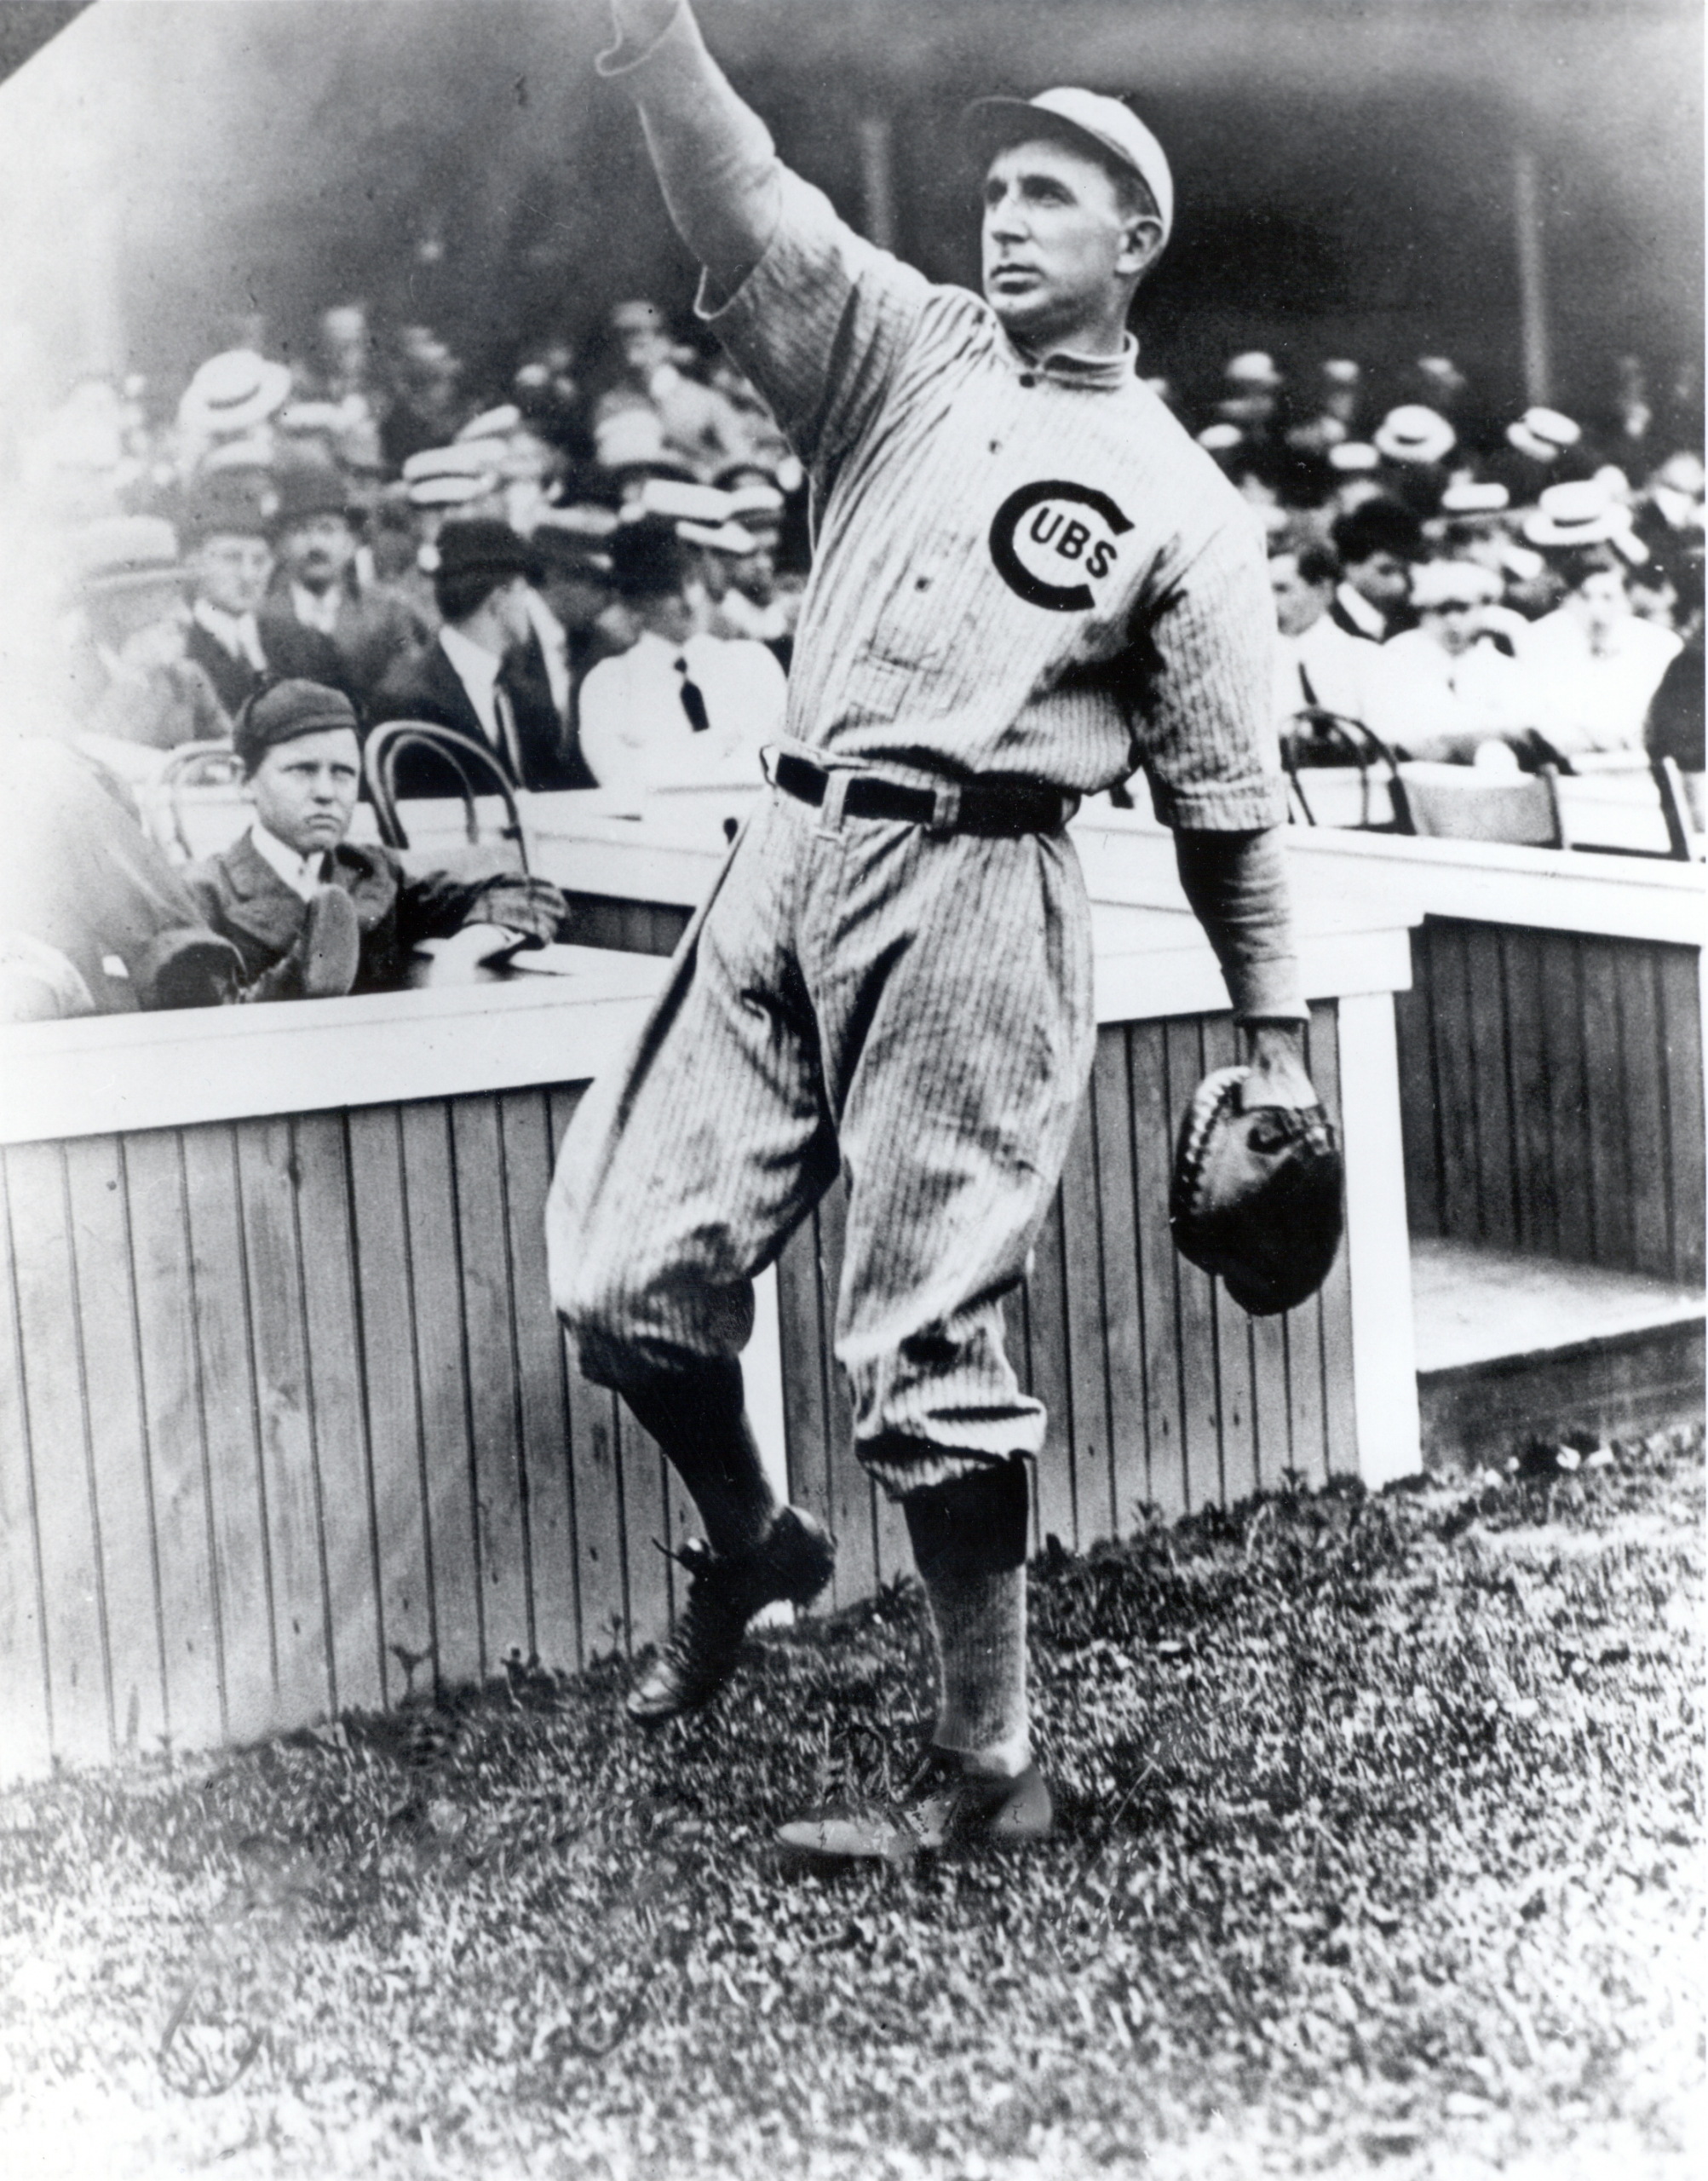
Joe Tinker, Johnny Evers, and Frank Chance — the defensive heart of the 1906–10 Chicago Cubs dynasty. (NATIONAL BASEBALL HALL OF FAME LIBRARY)
Once upon a time, the Chicago Cubs dominated the world. They were the best team in baseball not just for the one incredible year of 1906, but for five years, winning nearly 70 percent of their games, four National League pennants, and two World Series. Once upon a time, the Chicago Cubs dominated the world. They were the best team in baseball not just for the one incredible year of 1906, but for five years, winning nearly 70 percent of their games, four National League pennants, and two World Series. Let’s go to the bullet points:
- In 1906, the Cubs won 116 games and—not counting Union Association or National Association teams—posted the highest season winning percentage in history (116-36, .763), finishing 20 games ahead of the New York Giants—coming off back-to-back pennants of their own— whose 96 wins in any other year would have had them in contention at the very least. Chicago moved into first place for good May 9 and was virtually unbeatable the last two months of the season. From the beginning of August until the season ended on October 7, the Cubs went 50-8, running off winning streaks of 11, 14, and 12 games. Their longest losing streak of the year was three games in May. Prior to the World Series, the last time they lost back-to-back games had been on July 23–24.
- In 1907, Chicago repeated with 107 wins, finishing a comfortable 17 games up on the second-place Pittsburgh Pirates. The Cubs took over first for good on May 28, and on July 4 already held an 11½-game lead. In 1906 and 1907, the team had a streak in which it won 122 of 154 contests.
- In 1908, Chicago fought a three-way pennant race for the ages—maybe the greatest ever—winning by one game over arch-rivals New York and Pittsburgh. From there, Frank Chance’s men captured what is famously their second (and last) World Series. August had ended with the Cubs and Giants tied and the Pirates down by a mere halfgame. Despite starting September 14–6, the Cubs found themselves in second place, 4½ games behind the Giants, on the eighteenth. With only 16 games remaining, the deficit seemed so difficult that even firebrand second baseman Johnny Evers doubted their chances of winning a third straight pennant. Undaunted, and helped by Fred Merkle’s rookie “boner” on September 23 of failing to touch second base on a game-winning hit, the Cubs won 14 of their last 16 (excluding two ties) to eke out the pennant. At 99 wins, this was the only year of the five the Cubs failed to win 100.
- In 1909, the Cubs improved their victory total to 104. It so happened, however, that Pittsburgh won 110.
- Chicago again won 104 games in 1910, which this time was good for a fourth pennant as they ended 13 games ahead of second-place New York. The Cubs went into first for good on May 24 and led the Pirates by 10 games and the Giants by 12 games by the end of August. The 1910 Cubs were also the inspiration for that greatest of American poems—at least according to me—Franklin Pierce Adams’ ode to that “trio of bear cubs,” Tinker, Evers, and Chance, suitably entitled “Baseball’s Sad Lexicon.” The poem was printed in the New York Evening Mail on July 12, when the Giants were in Chicago. John McGraw’s men trailed the Cubs by only 1½ games, but the writing was perhaps apparent on the wall. The Giants’ loss to the Cubs on July 11 was the first of five straight defeats and nine losses in 12 games, effectively finishing them for the season and allowing Chicago to cruise to pennant number four in five years. (You may have gathered by my calling this the greatest of American poems that literary criticism is not my day job.)
The extent to which the Cubs dominated the league from 1906 through 1910 leads one to wonder whether they are the best National League team since the advent of what is called the “modern era” at the start of the twentieth century. But consider the time. This was the dead ball era. It was also a time when baseball was still developing its professional skills. There was much greater variability than today in the quality of teams and players in the major leagues. The refined skills of players and the absolute quality of baseball itself inexorably improved as the game became ever more scientific, markedly diminishing that variability. Taking into account, therefore, some of the great National League teams that followed—the New York Giants from 1920 to 1924 that won four consecutive pennants; the St. Louis Cardinals from 1942 to 1946, winners of four pennants and three World Series in five years; the Brooklyn Dodgers from 1949 to 1956 with five pennants in eight years; the Cincinnati Reds’ 1972 to 1976 “Big Red Machine” that won four division titles, three pennants, and two World Series in five years; and the Atlanta Braves with their 14 consecutive division titles from 1991 to 2005—where do the 1906–10 Cubs stand among the best NL teams since 1901?
A FRAMEWORK FOR ANALYSIS
I begin this analysis with a structured methodological approach that attempts to balance quantitatively these teams’ records of achievement and assess their relative dominance over the National League in their time. It is necessary to rate the performance of their core players relative to the league in both contemporary and historical context. I deliberately did not assign greater or lesser weight to any of the three categories—achievement, dominance, or players—because their relative importance may be variable according to time (or era) and circumstance, such as the extent to which pitchers were allowed to finish what they started.
The methodology yields a “score” for each category as well as a “total” score for comparative purposes. The specifics for each category will be discussed when I use this methodology to provide a baseline for evaluating the 1906–10 Cubs’ place in history. First, some ground rules.
My one basic requirement is that the teams being considered—those mentioned above—have a consistently strong record of no less than five consecutive years. All of the teams being considered in this analysis won or could have won five consecutive pennants. Were it not for the Pirates and their 110 victories in 1909, the Cubs would have taken five flags in a row.
(Click table images to enlarge.)
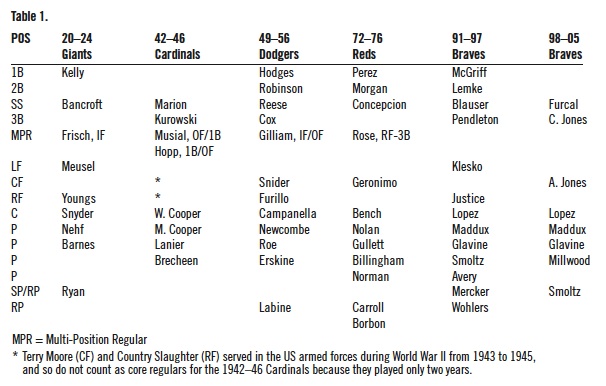
Teams are defined by their core group of regular position players and pitchers for the years under consideration. In all but one case, the core group of players corresponds with the teams’ consecutive years of remarkable success. The exceptions are the 1991–2005 Atlanta Braves, which I break down into two different teams—1991 to 1997 and 1998 to 2005—based on a nearly wholesale turnover of their core position players by 1998, although their stellar trio of starting pitchers in Maddux, Glavine, and Smoltz overlapped both teams. Core players must have been on the team for at least four years, including at least half of the years being considered in this analysis. Table 1 identifies the core players on their team for at least half the years under consideration for the teams (besides the Cubs) mentioned above.
Finally, and most important, this structured approach is intended only to inform, not dictate, the final analysis. My final analysis will use this structured methodological approach for each team as the foundation for evaluation, but other data-based factors are surely in play to test the proposition that the 1906–10 Chicago Cubs, despite playing in the deadball era at a time when the game was still discovering itself, were the National League’s best team ever.
This analysis would not have been possible without the indispensible website Baseball-Reference.com.
ACHIEVEMENT AND DOMINANCE: THE CUBS WON OFTEN AND WON BIG
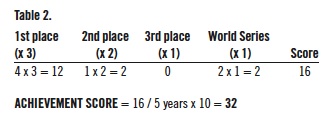
I measure “achievement” by what a team accomplished over a period of no less than five years, with greatest emphasis on accomplishment during the regular season rather than post-season success. Achievement is weighted according to accomplishment: three points for each time finishing first; two for each second-place finish; and one for every third-place finish.
Winning the World Series (and, since 1969 when divisional alignments began, winning the pennant) count for only one point in my methodology. Total achievement points are divided by the number of seasons (at least five) for the team under consideration, multiplied by ten (in order to deal with double-digit numbers).
The obvious point of controversy is that winning the World Series, and (since 1969) even the pennant, counts the same as finishing third during the regular season, and for less than finishing second. But while winning the World Series is the ultimate achievement in any year, it is also valid to evaluate teams by which are the best over the course of l-o-n-g baseball seasons. World Series and League Championship Series are short series, and sometimes a team which has established itself as the best or even dominant over a long season doesn’t win in the post-season, because, as is so often stated, anything can happen in a short series. The 1973 Cincinnati Reds, for example, with 99 wins, were upended in the NLCS by the New York Mets, who with a mere 82 victories had posted the fourth-best record in the National League.
The 1906-10 Chicago Cubs’ achievement score by this methodology is shown in Table 2.
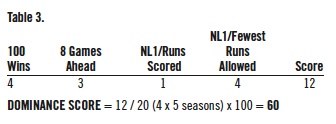
I define a dominant team as one so superior to its rivals that it is unlikely to be seriously challenged for first place except on rare occasions (usually by another dominant team). To put it another way, a dominant team typically blows away the competition and cruises to the finish line. I measure a team’s “dominance” by four equally weighted factors: the number of 100-win seasons, the number of times finishing first by a margin of at least eight games, the number of times leading the league in runs, and the number of times leading the league in fewest runs allowed. Total dominance points are divided by the product of four (for each dominance factor) times the number of seasons (at least five) for the team under consideration, which I multiplied by ten in order to deal with double-digit numbers.
Why use these four factors? A team that meets any one of these factors is very good, but dominant teams have to indeed dominate. The first two factors are related but not mutually exclusively; in none of the blowout pennant races won by Stengel’s Yankees, for example, did they win 100 games or more. The one year they did win 100—1954—they finished second. The second two factors are related to number of wins according to baseball’s Pythagorean Theorem, but not necessarily in reality. The 72–76 Reds won four division titles, had the best record in the NL three times, but led in scoring only once and were never better than third in runs allowed. The McCarthy-era Yankees were great not only because of their six 100-win seasons and eight blowout pennants, but also because they led in runs seven times and in fewest runs allowed seven times. Taken together, this represents a dominance that would be lost if we just went with 100 wins.
I chose 100 victories rather than 90 as my first benchmark for dominance; a 100-win team is far more likely to dominate. From 1901 through 2000, 163 NL teams won between 90 and 99 games. Of those teams, 87 (or 53%) finished first; on the other hand, 35 of the 39 NL teams (90%) that won 100 or more games finished first. The 1909 Cubs were the first of the four that did not.
I chose finishing first by a margin of at least eight games as a reasonable standard for dominating the league (or, since 1969, the division). Including division titles since 1969, not counting the 1981 split-season and the terminated-by-strike 1994 season, there were 134 pennant races in each major league in the twentieth century. In the National League, 49 of those 134 pennant races were decided by margins of at least eight games. That’s 37%, virtually the same as the 47 of 134 pennant races decided by three games or fewer.
 The 1906–10 Cubs were well-balanced, and with few weaknesses, dominated in every facet of the game. We’ve already seen their dominance in the win column and in claiming three pennants by decisive margins (and a fourth in the tightest of pennant races, which can be cited as a mark of greatness). The Cubs’ pitching and fielding were phenomenal. Four times during this five-year run, Chicago led the NL in fewest runs allowed, and did so by substantial margins. In 1906, the Cubs allowed only 381 runs, 89 fewer than the next club, Pittsburgh. In 1907, Chicago’s 390 runs allowed were 86 fewer than the Philadelphia Phillies’ second-lowest total. In 1909, the Cubs allowed a mere 390 runs while the pennant-winning Pirates allowed the second fewest runs, 447. And in 1910, Chicago again led the league in fewest runs allowed with 499, New York coming in second with 567. These are big differences. (The Cubs did not lead the league in fewest runs allowed in 1908, ceding 16 more runs than the Phillies, who had the lowest total.)
One reason the Cubs’ pitching was so great was their team fielding. According to data available on Baseball-Reference.com, Chicago led the league in defensive efficiency—making outs on balls put into play—every year of the five except 1908. Their rate of making outs on 72.6% of playable balls in 1906–10 was far better than the league average of 69.9%. In 1906 and 1907, the Cubs’ defensive efficiency rated 4.2 and 3.0 percent better than the second-best NL team. While the Cubs never led the league in double plays—thanks in large part to their stinginess in allowing base runners—“Tinker-to-Evers-to-Chance” deserved to have a poem written about them for their overall defensive prowess.
The 1906–10 Cubs also had an impressive offense to go along with great pitching and terrific defense. They led the league in runs scored only once—in their incredible 1906 season—but finished second each of the next four years. Arch-rivals Pittsburgh and New York both led the league in scoring twice. Of no small significance, however, was the offensive efficiency of these Chicago Cubs in taking advantage of scoring opportunities. The Cubs had the best ratio of runs to hits, as well as runs to total base runners (determined by total hits, walks, and hit batsmen), of any NL team from 1906 through 1910, besting the league average by 12.6 and 12.8 percent, respectively. This team not only won blowouts—a record of 147-49 in games decided by five or more runs, a five-year percentage of .750—but also the close ones; they were 146-82 in one-run games for an excellent .640 percentage.
The 1906–10 Chicago Cubs’ dominance score, the highest of any National League team for a five-year period since 1901, is shown in Table 3.
THE PLAYERS: CUBS STRONG AT THE CORE
A great team’s players go a long way toward establishing its legacy. The 1906–10 Cubs, for example, are perhaps even better known for their double play combination of Tinker, Evers, and Chance than for their accomplishments (except, of course, for that historical trivia about 1908 being the last time the Cubs won a World Series). The great teams are often identified by their Hall of Fame players, but what really matters is who the best players on the team were and how good they were relative to their contemporaries and others in baseball history. It is that three-part question that the “players” component of my methodological approach attempts to answer.
To measure quantitatively the “players” part of the methodology, I rely on the Wins Above Replacement (WAR) metric developed by Sean Smith of Baseball-Projection.com. I believe that three elements must be considered: first, the relative importance of the core players to their team’s success for the years under consideration; second, the number of core players on that team who were the best at their positions at the time of their team’s achievement; and third, the number of players on that team who were among their league’s best in the surrounding decade, in the half-century, or in the full century based on their performance (particularly as captured by the WAR metric) specifically during the five or more years under consideration for their team.
 WAR presents the number of wins any specific player added to his team above what a replacement-level player from Triple-A, or one shuttling between the major leagues and Triple-A, would contribute. WAR data for players and team rosters are both readily available at Baseball-Reference.com.
Measuring the overall impact of a team’s core regulars to the success of their team is key because, notwithstanding that teams lacking depth are much less likely to have sustained success—especially over multiple years—this analysis is intended to determine the best team, at least in part, by who had the best core players. The first part of my “players” equation represents, for the years under consideration, the core regulars’ combined WAR as a percentage of the total WAR earned by the team’s entire roster. The equation begins by adding the percentage of the team’s core regulars’ collective WAR to the average annual total WAR of the team’s entire roster for the years under consideration and dividing by ten, thereby attaining a single digit number to serve as a baseline for building a total “players” score.
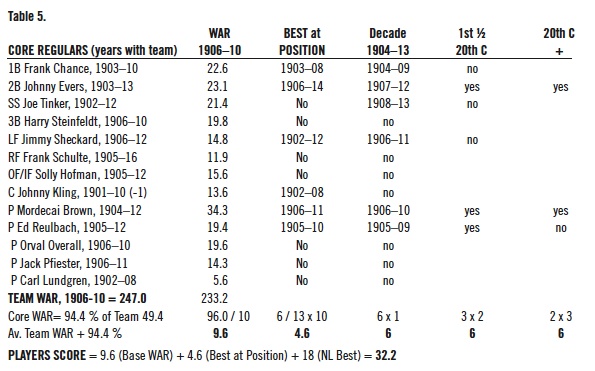
The 1906–10 Cubs had remarkable stability among their core regulars, with eight position players and four pitchers on the roster for all five years. In this era, core regulars received nearly all of the playing time, and with rosters at just 18, bench players filled in only when necessary. It is perhaps not surprising, therefore, that the Cubs’ core players—eight position players and five pitchers (see table below), including Carl Lundgren who was on the team only through 1908—accounted for 96% of the team’s total WAR over those years. In 1906, for example, aside from their eight starting position player regulars, Chicago had only three position players appear in more than five games: second catcher Pat Moran, who caught 61 games; infielder-outfielder Solly Hofman, who appeared in 64 games; and outfielder Doc Gessler, who appeared in 25. Only Moran and Hofman made more than 100 plate appearances.
For the second element of my players score, I made an informed judgment based primarily on the WAR metric as to how many of the team’s core regulars were the best in the league at their positions, with the stipulation that the player must have been the best in the league at his position for at least five consecutive years (to avoid one- or two-year wonders). Being best in the NL at his position takes into account one player for each fielding position (including three outfielders); a multiposition regular (Stan Musial, alternating between first base and the outfield throughout his career, may be the most notable multi-position regular in league history); and five starting pitchers and a dedicated relief ace (the concept of which really did not come into vogue until after WWII). Each player must have been the best in the league at his position for at least half of the years of achievement for the team being considered, meaning that a minimum of three of the player’s five-or-more years as the best in the league must correspond with his team’s run of success. The number of players who were the best at their position is divided by the total number of the team’s core players.
I count the Cubs with four position players (first baseman and manager Frank Chance, second baseman Johnny Evers, catcher Johnny Kling, and outfielder Jimmy Sheckard) and two pitchers, Mordecai “Three Finger” Brown and Ed Reulbach, with five or more years as the best in the league at their position including at least three consecutive between 1906 and 1910. And were it not for Honus Wagner at shortstop, Joe Tinker would have made five. Chicago’s pitching ace, Three Finger Brown, could have been counted as the National League’s best reliever as well as one of its best starting pitchers during these years. From 1908 to 1910 in particular, Brown was a workhorse out of the bullpen in addition to starting and completing more games than any other pitcher on Chicago’s formidable pitching staff. Brown started 96 of the 467 games the Cubs played those three years, completing 86, but also finished 41 games started by other pitchers, going 7–5 and collecting 19 retroactively-awarded saves. To put his role in perspective, Three Finger Brown was in at the finish of 27 percent of the Cubs’ games and with a record of 81–32 and those 19 saves, had a direct stake in 100 of the Cubs’ 307 victories—almost exactly one-third—from 1908 to 1910.
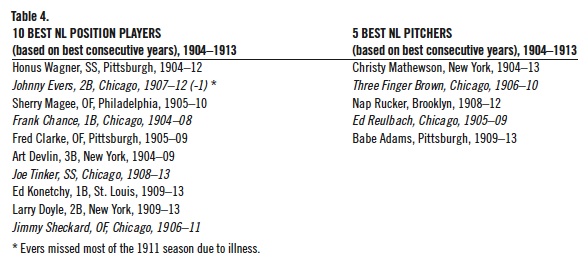
The third and final part of my “players” equation uses a point system for core regulars on the team who have a place among the best players in their league during all or part of the twentieth century. If a player on the team under consideration, based on his best consecutive years, was one of his league’s ten best position players, five best starting pitchers, or the best reliever in the decade surrounding his team’s run of success—which is always in the middle of that ten-year period—that counts for one point. The 1906–10 Cubs had four players and two pitchers among the NL’s ten best position players and five best pitchers in the surrounding decade, as shown in Table 4.
The team under consideration earns an additional two points if the player—based on his best consecutive years performance in the surrounding decade—was also one of his league’s 25 best position players, 15 best starters, or three best relievers in the first half of the twentieth century (1901–50) or one of his league’s 30 best position players, 18 best starters, or six best relievers in the second half-century (1951–2000). (The number of best players in each league is higher for the second half-century because of expansion, and I selected only three relievers in the first half-century because few teams had a dedicated relief ace over many seasons until the mid-1940s.)
Finally, teams under consideration receive three more points if a player was also one of the 50 best position players, 30 best starting pitchers, or six best relief pitchers in his league from the beginning of the twentieth century to date (a century-plus legacy) based on his best consecutive years performance in the decade surrounding his team’s specific five years (or more) of achievement. These totals are added to the baseline number, based on WAR, and to those for best in the league at their positions to comprise the total “players” score.
My position player and pitcher rankings are based on their highest sustained level of performance for five or more consecutive years, within which, of course, might be a sub-par season or two. I examined the pattern of WAR scores falling within the range of bookending (for the most part) All-Star quality seasons—defined on Baseball-Reference.com as five wins above replacement—that determine a player’s best consecutive years, looking at high and low anomalies, their frequency, and level of performance he maintained for most of those years. I looked for consistency at a high level over at least five consecutive years, not just highest average annual WAR because averages can be skewed by exceptionally good or bad years. Allowance is granted for “best years” to be interrupted by complete or nearly complete seasons lost to military service, injuries, or illness (realizing that some may question equating military service with the other two).
All of these judgments are mine, informed (once again) by WAR. They are not based on the totality of the player’s career, but on the player’s five or more best consecutive seasons, with at least three years corresponding with his team’s five-year run of success, or four years for teams (like the 1949–56 Dodgers or the 1991–97 and 1998–2005 Braves) whose achievements span seven or eight years. In this construct, Cubs’ first baseman Frank Chance—who, based on WAR for his best consecutive years, has not only a half-century legacy as one of the 25 best position players in National League history, but also a legacy as one of the league’s 50 best since 1901—does not, repeat not, count for any historical legacy points for the 1906–10 Cubs because his five best consecutive years began in 1903 and overlapped only the first two of his team’s five-year run of greatness.
Unlike the factors I considered for achievement and dominance scores and the use of WAR to measure the direct contribution of core players to their teams’ success, where the numbers are objectively what they are, I acknowledge that my determinations of the league’s best players at each position and, even more, about their historical legacy—whether for the ten-year period, the half-century, or century-plus—are necessarily subjective. While based primarily on the WAR metric, they are also informed by historical narratives about the teams and their players which touch on leadership or baseball intelligence that cannot be easily, if at all, captured in an all-encompassing metric. Consequently, I expect some disagreement with my judgments about players; this methodological framework should be considered a shared framework which allows readers to make their own subjective determinations about players and see how they fit within this construct.
Only one of the eight core position regulars on this team—second baseman Johnny Evers—has a century-plus legacy in my considered opinion, and no other has even a half-century legacy for his best consecutive years as a player covering at least three between 1906 and 1910. Of the five pitchers on the Cubs’ roster for all or most of those years, Three Finger Brown has a century-plus legacy and Ed Reulbach a half-century legacy among the NL’s 15 best pitchers.
The 1906–10 Chicago Cubs’ players score by the methodology just explained is in Table 5.
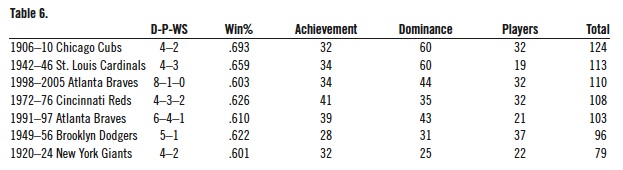
1906–10 CUBS ARE NL’S BEST BY THIS METHODOLOGY
Using this methodological framework, here is how the 1906–10 Chicago Cubs—who had by far the best winning percentage—compare to the other National League teams considered in Table 6. It is important to note that the advent of divisional play in 1969 forced me to adjust for calculating “achievement” scores in the divisional era. Winning the division after 1969 counts for the same three first-place points as winning the pennant before then, to which I also add half-point (.5) if the division winner had the best record in the league, and an additional point if the division winner went on to win the pennant (which now counts the same as winning the World Series) in the league championship series (LCS).
This means that teams in the divisional era can have a higher achievement score than teams before, despite having exactly the same accomplishments over the same number of years, because their pennants count for four points (three for finishing first in their division, plus one for winning the LCS) compared to only three for teams like the 1906–10 Cubs, to whom I give no additional point for winning the pennant by virtue of finishing first. This seeming inequity should not be considered discriminatory against teams prior to 1969, because the current setup makes it more difficult to win a pennant than in the days when finishing first and winning the pennant were one and the same. Modern teams deserve credit for the increased difficulty.
My inclusion of Johnny Evers as a “century-plus” player for the Cubs, based on his best consecutive years beginning in 1907 and an understanding derived from historical accounts of his leadership on the team, is bound to be controversial. The argument has been advanced, after all, that neither he nor double-play partner Joe Tinker were deserving of Hall of Fame enshrinement based on their career performance. I’m comfortable with my selection, but should I concede that Evers was not a century legacy player based on his best consecutive years (including 1907 to 1910), the 1906–1910 Cubs would still have the highest overall score (121) of any National League team in history by my methodological approach. It would still be true even if his best consecutive years did not make Evers one of the NL’s 25 best position players in the first half-century, which would give the Cubs a total score of 119.
My analysis does not end here, however, because, as I already mentioned, this multidimensional structured methodology is intended to inform, not dictate, the results as to which National League team was the best in history. Let’s examine the 1906 through 1910 Cubs relative to each of the other teams under consideration with the results of this methodology as a foundation. The following analysis is data-based so that conclusions may be seen as substantiated rather than merely subjective.
1920–24 NEW YORK GIANTS: A WEAK CASE
In becoming the second major league team in history (the first since 1885 through 1888) to win four consecutive pennants (1921 to 1924), the 1920–24 Giants accomplished something even the 1906–10 Cubs, great as they were, could not. New York’s five-year stretch began with a second-place finish behind Brooklyn. The Giants won the World Series in 1921 and 1922, and—but for catcher Hank Gowdy tripping over his mask and failing to catch a pop foul, and a bad hop over third baseman Freddie Lindstrom’s head—might have won the 1924 Series as well.
Notwithstanding four straight pennants, the 1920–24 Giants were hardly dominating. Their .601 winning percentage over the five years was the lowest of any of our teams under consideration, and they have by far the lowest dominance score by my methodology of any of the teams. The Giants had no 100-win seasons—the most games they won was 95 in 1923—and their pennant winning margins were by 4, 7, 4½, and 1½ games. In 1921, New York had spent only eight days in first place (excluding off days) before taking over for good on September 9 amid a 10-game winning streak. They did not command the 1922 pennant race until the end of August. Only in 1923 were the Giants comfortably ahead for most of the season, and in 1924 New York squandered a 9½-game lead on August 8, spending all of September never more than 2½ games ahead of pennant rivals Brooklyn and Pittsburgh.
This Giants team did not overwhelm the competition, and their pennant rivals were not as strong as those of the 1906–10 Cubs. It is true that Chicago played against 13 teams during their five-year run that lost at least 90 games, while the Giants played against only nine such losers. The 1906–10 Cubs, however, also faced eight other teams that won 90 or more games, while only five other teams won as many as 90 during the Giants’ run. Even more significantly, the Giants’ record against their rivals for the National League pennant—including the 1922 second-place Reds (winners of only 88)—was barely above .500, at 68–64. The 1906–10 Cubs, on the other hand, played exceptionally well against their pennant rivals, all with 90 or more wins, posting a 98–77 record. Put another way, extrapolated over the full 154-game season played at the time, the Giants would have won only 79 games, compared to the Cubs’ 86, against the other contemporary best teams in the league.
1942–46 ST. LOUIS CARDINALS: A LEGACY DIMINISHED BY WAR
By winning one more World Series than the 1906–10 Cubs, the 1942–46 Cardinals’ four pennants and three World Series championships in five years exceed the Cubs’ combined achievement and dominance scores. The Cardinals finished second to the Cubs in 1945 by three games, which of course led to the last World Series sighting of Chicago’s north side team.
The Cardinals’ first and last pennants in this stretch were clearly legitimate because U.S. involvement in World War II had yet to claim many major leaguers in 1942; by 1946, the war was over and most of the players were back home. The middle two pennants, however, came when the war had stripped teams of many of their biggest talents. They probably would have been the first team in history to win five straight pennants had Stan Musial not spent 1945 in the uniform of his country instead of that with a bird balancing on a bat—finally, the team had lost its own biggest star, as others had.
Those players included Cardinals right fielder Enos “Country” Slaughter, who was in the service from 1943 through 1945, and therefore does not meet my requirement of playing for his team in at least half of their years of achievement. Even accounting for his three years in the military, I consider Slaughter to have been one of the National League’s three best outfielders from 1939–49, and his best consecutive war-interrupted years, 1940 through 1948, give him a half-century legacy. Without him, the Cardinals have the lowest players score of the teams under consideration in this analysis; with him—by beginning St. Louis’s run in 1941, when they won 97 games and finished 2½ behind Brooklyn—their players score is slightly better (23 to 22) than that of the 1920–24 Giants.
Putting World War II aside for a moment, the 1942–46 Cardinals’ winning percentage of .659 is the closest to the 1906–10 Cubs’ .693 over any five-year period for an NL team. With three consecutive 100-win seasons, two blowout pennant races, and three times leading the league in scoring and four times in fewest runs allowed, the Cardinals were as dominant in their time as the Cubs in theirs. Moreover, the relative balance between offense and pitching as a percentage of team WAR for both the Cubs and Cardinals over their five-year runs is virtually identical. Coincidentally, their records were nearly comparable in run differential against game opponents; the Cubs outscored their game opponents by 226 runs over their five years, and the Cardinals outscored theirs by 221.
At .598, St. Louis had a better winning percentage, going 67–45 against their four runners-up and the 1945 NL champion Cubs, than Chicago’s .560 (98–77) record against its rivals for the pennant, but the 1906–10 Cubs played against eight other teams with 90 or more wins, twice as many as 1942–46 Cardinals. And we cannot overlook that the Cardinals’ two runaway pennants came in 1943 and 1944, when arch-nemesis Brooklyn was particularly hard hit by our country’s call to arms.
1949–56 BROOKLYN DODGERS: “BOYS OF SUMMER” LESS IMPOSING
The 1949–56 Dodgers won five pennants in eight years, but were a hair’s breadth from winning seven, including potentially five in a row (which would have matched the 1949–53 New York Yankees). They had a chance to tie for first and force a playoff on the final day of the 1950 season, but lost to the pennant-winning Phillies, and then of course blew a 13-game lead the next year and lost on Bobby Thomson’s legendary home run.
If extended to an eight-year period during which the 1906–10 core players were intact—which includes 1903 to 1910 for Tinker, Evers, and Chance—the Cubs were not as successful as the 1950s Dodgers. We are focused, however, on each team’s best seasons. Brooklyn had eight years, while Chicago claims only five; the New York Giants captured three straight pennants after 1910.
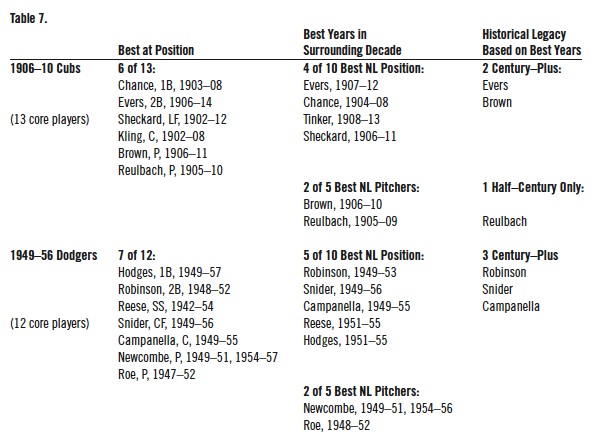
Few teams in history had as many dominant players as the 1950s Brooklyn Dodgers. Their core regulars included the likes of Gil Hodges, Jackie Robinson, Pee Wee Reese, Duke Snider, Carl Furillo, Roy Campanella, Don Newcombe, Preacher Roe, Carl Erskine, and Clem Labine, who were together for all or most of the eight-year run. Seven of Brooklyn’s twelve core players during these years were the best at their position for at least four years, five counted among the league’s ten best position players and two among the five best starting pitchers in the surrounding decade (1948–57), and Robinson, Snider, and Campanella all have a century-plus legacy. These “Boys of Summer” give the 1949–56 Dodgers the highest “players score” of all teams being considered in this analysis, including the 1906–10 Cubs. Moreover, Newcombe’s record over his best consecutive years from 1949 to 1956 suggests he might well have had a century-plus legacy had he not lost two seasons to the Korean War. It would be reasonable to suppose that any team with those four guys, not to mention Reese and Hodges, should get the nod over Tinker-to-Evers-to-Chance and Three Finger Brown. (See Table 7.)
Despite their star power, the Dodgers were not as balanced as the 1906–10 Cubs. While Dem Bums were an offensive powerhouse, leading the league in scoring six times and finishing second the other two years, their pitching was merely good, not great. During their eight-year run, Brooklyn was one of the top three teams (in an eight-team league at the time) in fewest runs allowed five times, only once the stingiest in giving up runs. Chicago, of course, was most conspicuous for its superb pitching and fielding—four times giving up the fewest runs in the league—but was also first (although only once) or second in scoring every year between 1906 and 1910. The Dodgers’ position players had a lopsided 74-to-26 advantage over their pitchers in their percentage contribution to Brooklyn’s team WAR between 1949 and 1956, whereas the 1906–10 Cubs had a much more balanced 58-to-42 ratio making up their team WAR. The Cubs’ combination of
offense, pitching, and fielding play was more impressive. This was reflected in the Cubs outscoring their game opponents by an average of 226 runs during their run, while the Dodgers did so by an average of 167 runs during theirs.
As formidable as the Boys of Summer were, their team did not dominate the league to the extent of the 1906–10 Cubs. They won 100 games only once—in 1953—compared to four 100-win seasons for the Cubs, and won the pennant by blowout margins of eight games or more only twice in winning five pennants (by 13 in 1953 and 13½ in 1955), while the Cubs did so three times in winning their four. The Dodgers were not as dominant despite the Cubs facing a tougher competitive environment for the pennant. Pittsburgh and New York combined for eight 90-win seasons during the five years the Cubs won four pennants, while Brooklyn faced off against only eight 90-win teams over eight years. Only once did the Dodgers have to contend against two 90-win teams (in 1956 when Milwaukee won 92 and Cincinnati 91 to Brooklyn’s 93).
Finally, the Cubs played their toughest rivals better than the Dodgers played theirs. Chicago won four of their eight season series between 1906 and 1910 against teams with 90 or more wins, split two others, and lost only two. For their part, against the eight other teams that won 90 or more games between 1949 and 1956, Brooklyn won the season series only twice, split the season series twice, and had a losing record four times. The Dodgers’ winning percentage against 90-win competition was a losing .480, and they posted losing records against 90-win teams in three of their five pennant-winning seasons.
1972–76 CINCINNATI REDS: ONE-DIMENSIONAL “MACHINE”
The Cincinnati Reds of the mid-1970s are always in the argument about baseball’s best teams, and deservedly so—particularly for their blowout NL Western Division championships in 1975 and 1976 that resulted in back-to-back World Series triumphs. Many would say they were the best National League team in history. Their 108 wins in 1975 is the third-highest victory total in their league’s history (tied with the 1986 Mets) after the 1906 Cubs and the 1909 Pirates. The cornerstone players on the 1972–76 Reds that won four division titles, three pennants, and the two World Series in five years were Joe Morgan, Johnny Bench, Pete Rose, Tony Perez, and Dave Concepcion. The team became even stronger when Ken Griffey Sr. and George Foster became outfield regulars in 1975; they are not counted by me as core players on the 1972–76 Reds, even though they played important roles when the Big Red Machine was at its very best, because they were regulars only the last two years.
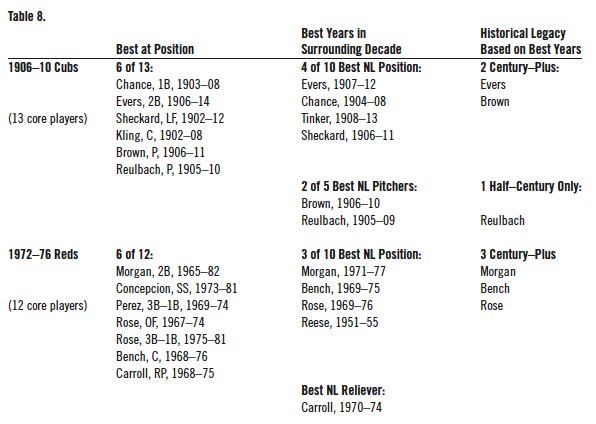
Considering that Bench, Morgan, and Rose all have a century-plus legacy that the Cubs can really only rival with Three Finger Brown (I count Evers as having a century-plus legacy also, but his best consecutive years are not close to their class), and that their overall players score may be depressed relative to the Cubs’ because the National League had expanded from eight to twelve teams—representing a 50 percent increase in potential players competing for best at their position and best in the surrounding decade—it would be hard to dispute that the Reds did not have a better team, at least as far as their players, than the deadball-era Cubs. (See Table 8.)
Cincinnati batters dominated their team’s collective WAR over those five seasons to an even greater extent than did Brooklyn’s sluggers in the 1950s. When compared to the 1950s Dodgers, therefore, the Cubs’ excellence in all facets of the game—pitching, fielding, and offense—made them more multidimensional, and hence better all-around relative to their time, than the 1970s Reds. While the Big Red Machine had a deadly efficient offense (with Rose, Morgan, Bench, and Perez as headliners) combining ability to hit, run, get on base, drive in runs, and hit for power that may even have been more dynamic than any of the great Yankees’ teams, their pitching was much less imposing, even pedestrian. Cincinnati’s adjusted earned run average—which normalizes ERA to the context of the time and the team’s home park—was always around the league average, and only in 1975 much better. The Reds’ starting rotations were weak, especially when either of their two best pitchers—Gary Nolan and Don Gullett—was on the disabled list (which was often). Manager Sparky Anderson earned the moniker “Captain Hook” for his extensive use of his bullpen to secure victories.
The Cubs, however, were more dominant in their league than were the Reds. Most notably, Chicago outscored its opposition—which included two perennial 90-plus-win teams in the Giants and Pirates—by 53%; the Reds scored 29% more than their opponents.
It would be fair to argue on the Reds’ behalf that the major leagues were much more competitively balanced in the 1970s than they were in the first decade of the twentieth century. One-third of the National League teams that took the field of play from 1906 to 1910 lost 90 or more games, compared to less than 25 percent of NL teams from 1972 to 1976. That being established, however, the Cubs still had to compete against a greater number of very good 90-plus wins teams (eight) relative to the league than the Reds. Cincinnati faced off against seven other 90-win teams over five years in what was now a twelve-team league, but only three of those teams (the Dodgers in 1973, 1974, and 1976) were in the Reds’ division. Their winning percentage against such teams was almost exactly the same—.560 for Chicago, .559 for Cincinnati—but the Cubs played 23 percent of their total games from 1906 to 1910 against 90-win teams, while the 1972–76 Reds played 90-win teams in only 13 percent of their games.
All things considered, therefore, these are the saddest of possible words for the Big Red Machine to have to hear: “Tinker-to-Evers-to-Chance” and Mordecai “Three Finger” Brown.
1991–2005 ATLANTA BRAVES: LONGER BUT NOT BETTER
The 1991–2005 Atlanta Braves are famous for winning their division 14 consecutive years (not counting 1994, when division titles were not awarded on account of the players’ strike) and infamous for coming away with only five National League pennants and one World Series championship for their efforts. I split the Braves into two separate teams—1991 to 1997 and 1998 to 2005—based on a wholesale turnover of position players by 1998. Chipper Jones became the Braves’ regular third baseman in 1995, playing only three years on the 1991–97 Braves, and Andruw Jones became a regular in the outfield in 1997, so both are counted as being part of the 1998–2005 Braves.
Both Atlanta teams dominated the National League. In winning six division titles, the 1991–97 Braves had the best record in the league five times, won over 100 games twice—including in the last of the pre-1994 pennant races (when a team had to finish first just to get into the playoffs), when they needed every one of their 104 victories to beat the 103-win Giants—and four times won their division by at least eight games. In winning eight division titles, the 1998–2005 Braves had the league’s best record four times, won 100 or more games four times, and four times finished eight games ahead of their division rivals. On top of that, with Greg Maddux, Tom Glavine, and John Smoltz anchoring the starting rotation from 1993 through 2002 the Braves led the league in fewest runs allowed for 11 consecutive years between 1992 and 2002.
If the strengths of the 1950s Dodgers and 1970s Reds were overwhelmingly centered on their offense, superb pitching was the particular calling card of the first Atlanta team. The balance between position players and pitchers was almost exactly 50/50 in the Braves’ collective WAR between 1991 and 1997. This equilibrium, however, is not a good thing in comparison to the Cubs because, as implied by Bill James when he developed “win shares” to measure players’ contributions to their teams’ success, position players collectively should contribute more. The near 60/40 split between position players and pitchers for both the 1906–10 Cubs and 1942–46 Cardinals seems closer to the optimum for a truly dominant team. The 1991–97 Braves are the only team being considered here that did not have a single position player among the league’s ten best in the surrounding decade. The second Braves team, despite winning only one pennant for their eight division titles from 1998 to 2005, carried over their great pitching—at least until 2003, after which both Maddux and Glavine were gone—but were more well-rounded, with both Joneses having century-plus legacies for their best consecutive years during that run.
The winning achievements and relative dominance of the National League by both Atlanta teams can fairly be said to match up well with the 1906–10 Cubs, notwithstanding their relative paucity of pennants. It’s important to remember that, unlike the Cubs, the Braves had to survive first one and then two rounds of National League postseason series to even get to the World Series. The 1998–2005 Braves compare favorably to the 1906–10 Cubs in numbers of players who were the best at their position and with century-plus legacies. The Cubs, however, were much more dominant in their games; they outscored their opponents by 53 percent from 1906 to 1910, compared to the 1991–97 Braves outscoring their opponents by 24 percent between 1991 and 1997 and 22 percent between 1998 and 2005. More significantly, although a much higher percentage of teams lost 90 or more games in the Cubs’ era, the 1906–10 Cubs still played 23 percent more games against teams with 90 or more wins because of a balanced schedule calling for 22 games against each team, and had a better record (a .560 winning percentage) playing the league’s best competition. The 1991–97 Braves played 18 percent of their games against 90-win teams to the tune of a .524 winning percentage, while the 1998–2005 Braves’ .545 record against 90-win competition (which now also included American League teams on their schedule with the inauguration of inter-league play in 1997), accounted for only 19 percent of their games.
CUBS ONCE HAD THE BEST TEAM IN NATIONAL LEAGUE HISTORY
Whatever misfortunes have plagued the Cubs over the last one hundred years, whatever curse devoted Cubs fans may believe has stricken their team because they have not won a World Series since 1908 and not even been to one since 1945, from 1906 to 1910 the Chicago Cubs had the best team in National League history.
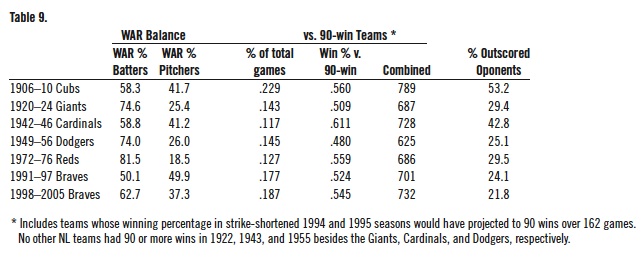
The Cubs were so dominant in all aspects of the game that no other NL team in the modern era over any five-year period is even close to the percentage by which they outscored their opponents. The team that comes closest—the 1942–46 Cardinals—did so during World War II years that stripped the major leagues of both established veterans and promising young players, and only two other teams even approached outscoring their opponents by 30 percent. Finally, though this was the dead ball era and the dregs of the league were probably as bad as they ever were, the 1906–10 Cubs played a much higher percentage of their games against teams with at least 90 victories than the other teams considered, and were very successful in those games; they have by far the best combined total of percentage of games played against 90-win teams and winning percentage against them. (See Table 9.)
Are the 1906–10 Cubs the best team in major league history? Well, there is the matter of the New York Yankees, and given what happened to the Cubs in the 1932 and 1938 World Series, it’s probably best not to go there.
BRYAN SODERHOLM-DIFATTE lives and works in the Washington, DC, area and is devoted to the study of baseball history. His article is adapted from a larger project about the best teams in each league in the 20th century, which can be found on his website www.thebestbaseballteams.com.