

Do Batters Learn During a Game?
This article was written by David W. Smith
This article was published in 2005 Baseball Research Journal
It is common to hear batters and pitchers comment on the value of being able to “make adjustments” during a game. For example, pitchers speak of “setting a batter up” by a certain sequence of pitches, which may take several at-bats to accomplish. Similarly, batters often remark that they “look for” a certain type of pitch or in a certain location after considering what the pitcher has thrown before. Although it makes sense that a player might very well alter his mental approach as a result of earlier success or failure, I decided to go beyond the anecdotal interviews and ask if there was any tangible evidence indicating that these adjustments actually take place.
My approach was to examine matchups between starting batters and starting pitchers. giving the greatest opportunity to discover changes during the course of a game. Given the realities of modern pitcher usage, it is very uncommon for a batter to face the same relief pitcher more than once in a game, and therefore the relievers were excluded. The batting performance of pitchers was also removed. I analyzed every play of every game from 1960 through 2005. which covered 92,271 games and more than seven million plate appearances. The play-by-play information comes from Retrosheet.org.
There are a variety of performance measures used today within the baseball analysis community. I use the three standard aggregate measures: batting average, on-base average, and slugging average. These three quantities reflect different aspects of batter performance, and I therefore suspected that they might not all show the same patterns of change during a game. Table 1 presents the results for the first four matchups within a game for all games from 1960 through 2005. There were a few cases of a batter facing a starting pitcher five times in one game, but these are too rare to be useful in this analysis.
Table 1. Batting by number of appearances within a game, both leagues, 1960-2005
| PA | BA | OBA | SA | |
| 1 | 1530593 | .259 | .328 | .393 |
| 2 | 1456880 | .269 | .331 | .416 |
| 3 | 1151387 | .274 | .336 | .427 |
| 4 | 394251 | .275 | .336 | .418 |
In addition to noting how uncommon it is for a starting batter to face a starting pitcher four times in a game, we see clear patterns of improvement, or batter learning, in all three values as the game progresses. However, the three averages do not increase at the same rate. On-base average rises slowly, only 2.1% from the first to fourth time at bat, while batting average and slugging average go up much more rapidly, 6.1% and 6.4% respectively. The most rapid change in the data is in slugging average from the first to second time up. In the 1950s Branch Rickey and Allan Roth developed a measurement called isolated power to examine extra-base hits separately from singles. Isolated power is simply the difference between slugging average and batting average. For all at-bats over the 46 years studied (not just for the starters), the isolated power is .135 (batting average of .259 and slugging average of .394, see Table 3). For the data in Figure 1, the isolated power values for the four times at bat are .134, .147, .153, and .143. My interpretation is:
- The first time up, batters are more concerned with making contact than hitting with power.
- The second and subsequent times up, they are adjusting with the result that they are able to swing more confidently and with greater power.
- The isolated power of the non-starter appearances is lower than that of the starters.
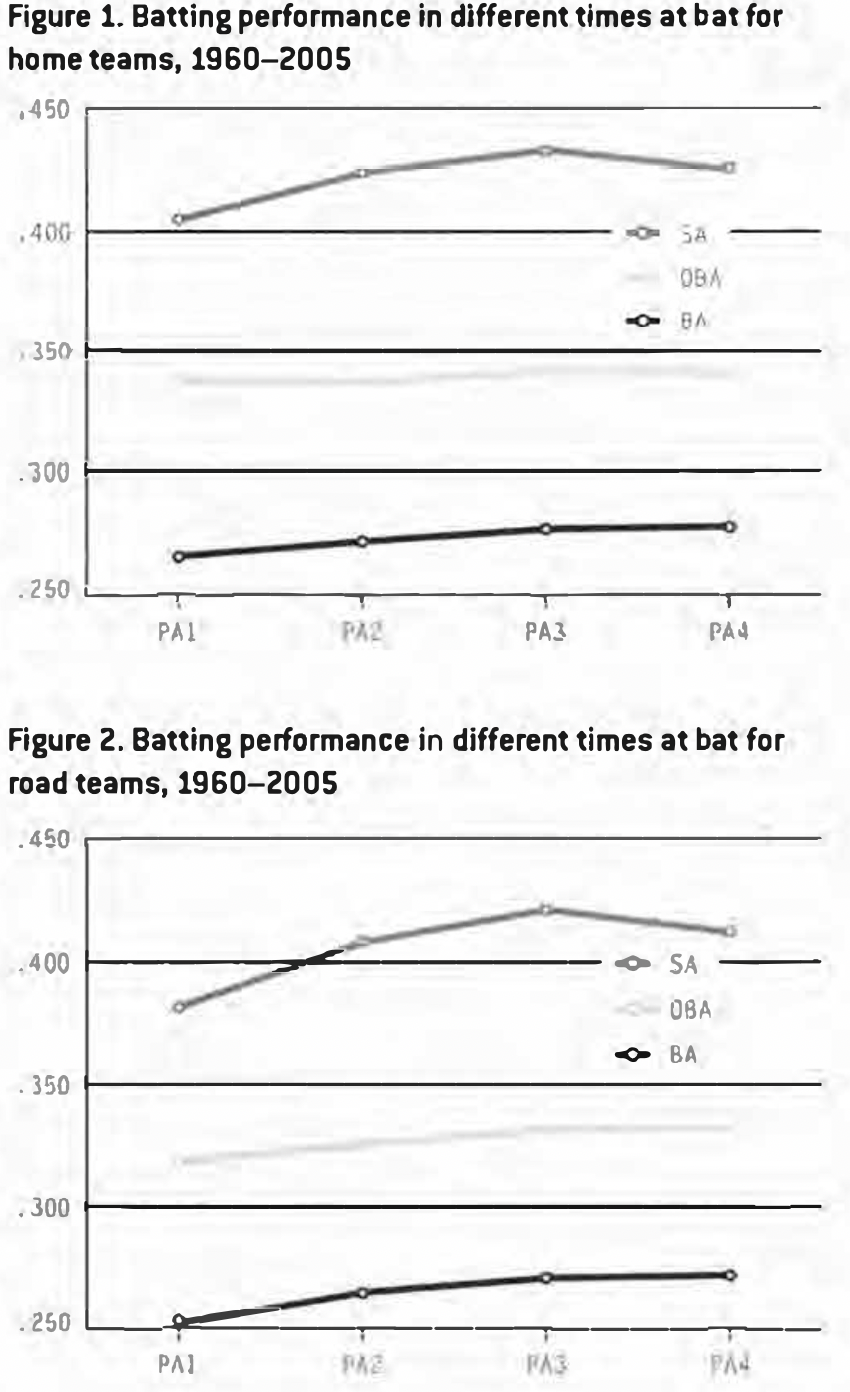
This pattern was remarkably constant over the period studied (data not shown), even though the total level of baseball offense varied considerably over the years. There was also no discernible difference between the two leagues, either before or after the advent of the designated hitter in the American League in 1973. However, there was a definite in the pattern for home and road teams, as shown in Table 2 and Figures 1 and 2.
Table 2. Home and road batting by number of appearances, 1960-2005
Home Teams
| PA | BA | OBA | SA | |
| 1 | 764687 | .266 | .337 | .405 |
| 2 | 725211 | .272 | .336 | .424 |
| 3 | 559561 | .277 | .341 | .433 |
| 4 | 173132 | .278 | .340 | .425 |
Road Teams
| PA | BA | OBA | SA | |
| 1 | 765906 | .252 | .318 | .382 |
| 2 | 731669 | .265 | .325 | .408 |
| 3 | 591826 | .271 | .331 | .421 |
| 4 | 221119 | .272 | .331 | .412 |
Home & Road Combined for Starters vs. Starters
| BA | OBA | SA | |
| Home | .272 | .338 | .420 |
| Road | .263 | .325 | .403 |
| All | .267 | .331 | .411 |
(Click image to enlarge)
There are rather large differences between the two, both in absolute value of the numbers and in the pattern of changes. The home team has an overall nine to 17 point superiority in these three measures, as shown in the bottom portion of Table 2. However, the greatest differences are in the pattern of the changes, as shown in Figure 1 and 2, which come from the data in the first two portions of Table 2. In all three parameters, the rates of increase are steeper for players on the visiting team than they are for those who are playing at home. Interestingly enough, slugging average for all players drops from the third to fourth times at bat. By the fourth time at bat, the performance differences for the home and road players are much more similar than they were earlier in the game.
This pattern is initially surprising, since it is not obvious why the road team batters should display so much more learning than the home team batters. However, we must remember that there are two sides to each matchup and consider the pitchers as well, since both are presumably capable of making adjustments.
One of the great differences usually identified between different parks is the mound, and many visiting pitchers comment that it takes time to get used to a new mound on the road. Therefore, it is reasonable to consider that there are two kinds of learning going on. The first is the mental part of the pitcher-batter confrontation, which we have seen to favor the batter, and the second is the physical adjustment by the pitcher to the mound. Presumably the home team pitchers are more familiar with the mound than the road team pitchers are, and they should have less of this adjustment to do.
Let us consider the home vs. road differences again, remembering that the difference between home and road batters narrows as the game proceeds. By this argument, the learning displayed by the road team batters would therefore result mostly from the mental aspects, since the home team pitchers are not affected as much by the mound. On the other hand, the road team pitchers are starting the game at a relative disadvantage as they deal with the idiosyncrasies of that particular mound.
Therefore, the performance by home team batters starts off at a higher level, but does not increase as rapidly, because there is less room for improvement before they reach the maximum. However, it must be true that the road team pitchers have been successful in their adjustments, or else one would expect that the performance by home team batters would continue beyond what is observed.
There is one additional factor that might affect the batters, and that is the nature of the hitting background. Although the center field background does vary among parks, there is much less variation here than there is in the mound. One way to examine the effect of the hitting background would be to compare the performance of road team batters in the first game of each series to the later games in the series. If the background was a significant factor, then one would expect the first game performance to be different. I did not subdivide the results in this way, so this possibility remains unexplored.
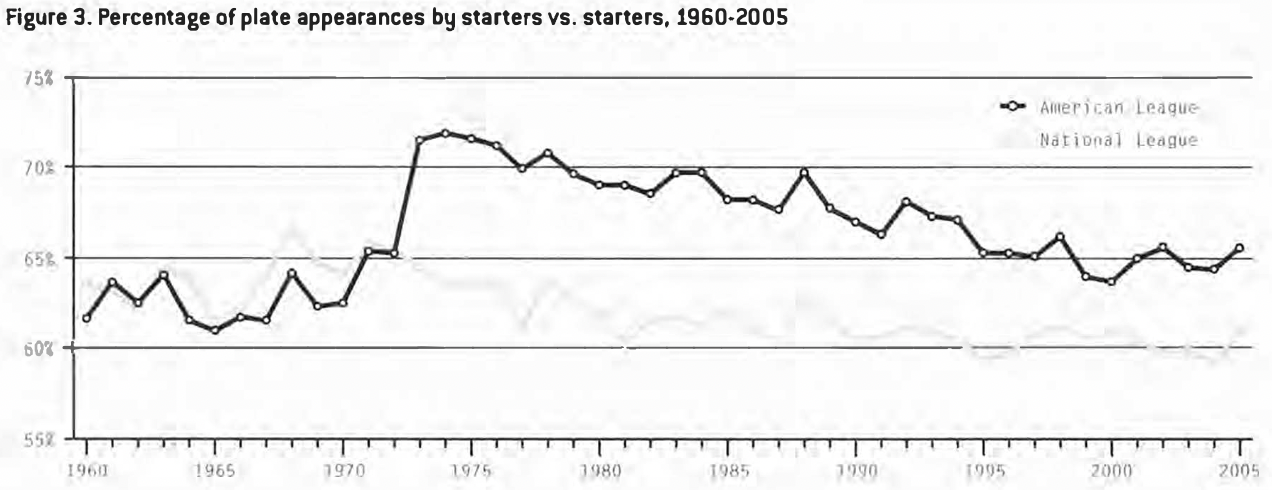
There are many aspects of batter performance which have changed since 1960, including strike zone rule changes, the rise and decline of artificial surface fields, the designated hitter (DH) rule, and profoundly new patterns of relief pitcher usage. It occurred to me that the percentage of plate appearances which were between starters might show variation as well. Figure 3 addresses the DH effect.
From 1960 to 1972, the two leagues were very similar in the percentage of plate appearances that involved starting batters and starting pitchers, with variation from about 61% to 67%. In 1973 with the advent of the DH, the curves for the two leagues diverge sharply, as the American League percentage jumps to nearly 72% while the National League values show little change. Both leagues have seen a continual decline since then, as the difference between the two has narrowed from a maximum of about eight percentage points to the current difference of about four points. The relationship now is essentially what it was in the pre-expansion era. However, even with these striking changes over time, the results in terms of batter learning did not change in a corresponding way (data not shown).
One more interesting feature of this analysis is the different performance levels of the starters and non-starters. Table 3 shows that the starting batters are noticeably more effective than the overall average, as would be expected. However, it must be noted that the overall values include pitchers as batters as well as the effect of specialist relief pitchers.
Table 3. Batting performance of starters vs. all batters, 1960-2005
| BA | OBA | SA | |
| Starter vs. Starter | .267 | .331 | .411 |
| All Batters vs. All Pitchers |
.259 | .326 | .394 |
I would like to emphasize that I presented no information for individual teams or players. It is always true in a study such as this that the results get less clear as the sample size gets smaller, with random statistical noise playing a larger part. I therefore studied aggregates, with home vs. road as the only subdivision. When the results are divided more finely, to single teams or single batters, there will inevitably be many exceptions that cloud the issue. I have chosen to avoid this confusion.
In conclusion I note that I began this study with the question: Do batters learn during a game? It is clear that the general answer is: yes, they do. However, it is also clear that the situation is a little more complicated than that and a better understanding can be obtained by considering other factors. The biggest one I could identify was the effect of playing at home vs. on the road. So the next time you hear a batter say that he improved his performance by making adjustments during a game, there is a good chance you should believe it. On the other hand, if you hear a pitcher say it, then you might be a little suspicious.
Author’s note
A preliminary version of this paper with a smaller data set was presented at the SABR national convention in June 1996.