

2024 SABR Analytics: Watch highlights from MLB Statcast Updates: Weather and Bat Tracking
At the SABR Analytics Conference on Sunday, March 10, 2024, in Phoenix, Arizona, a team from MLB Statcast provided an update on system features related to weather and bat tracking.
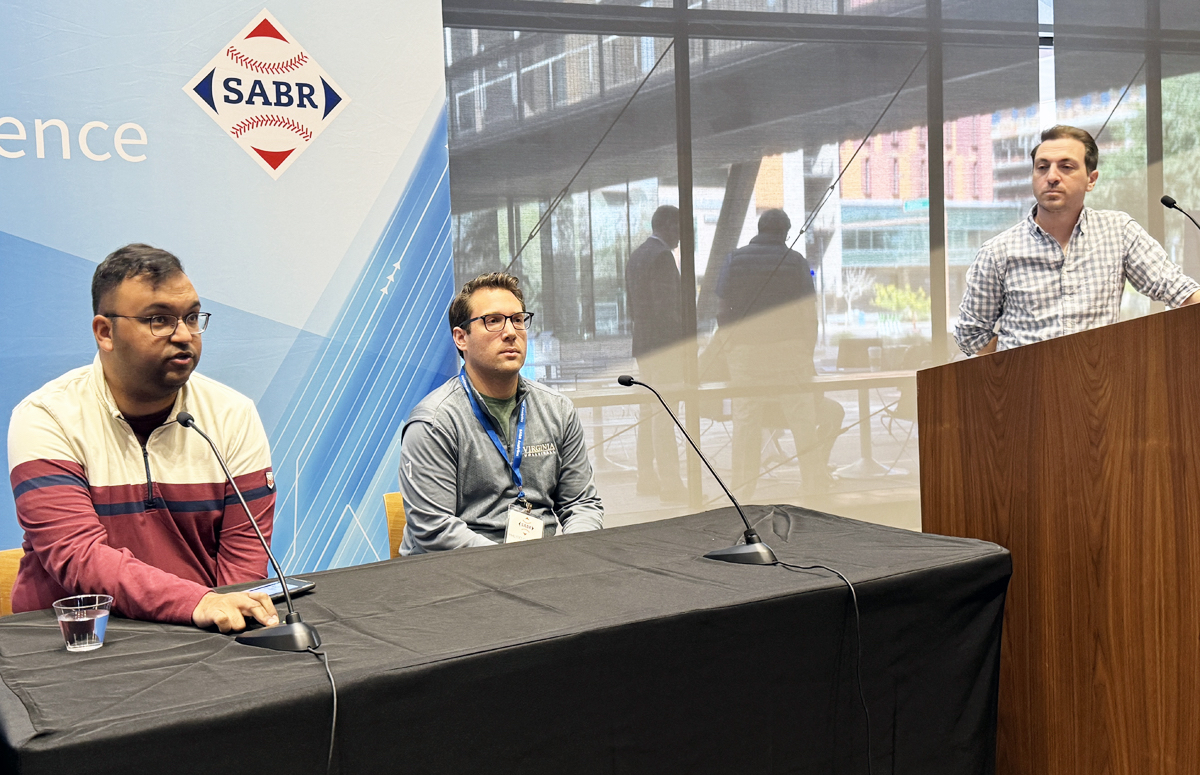
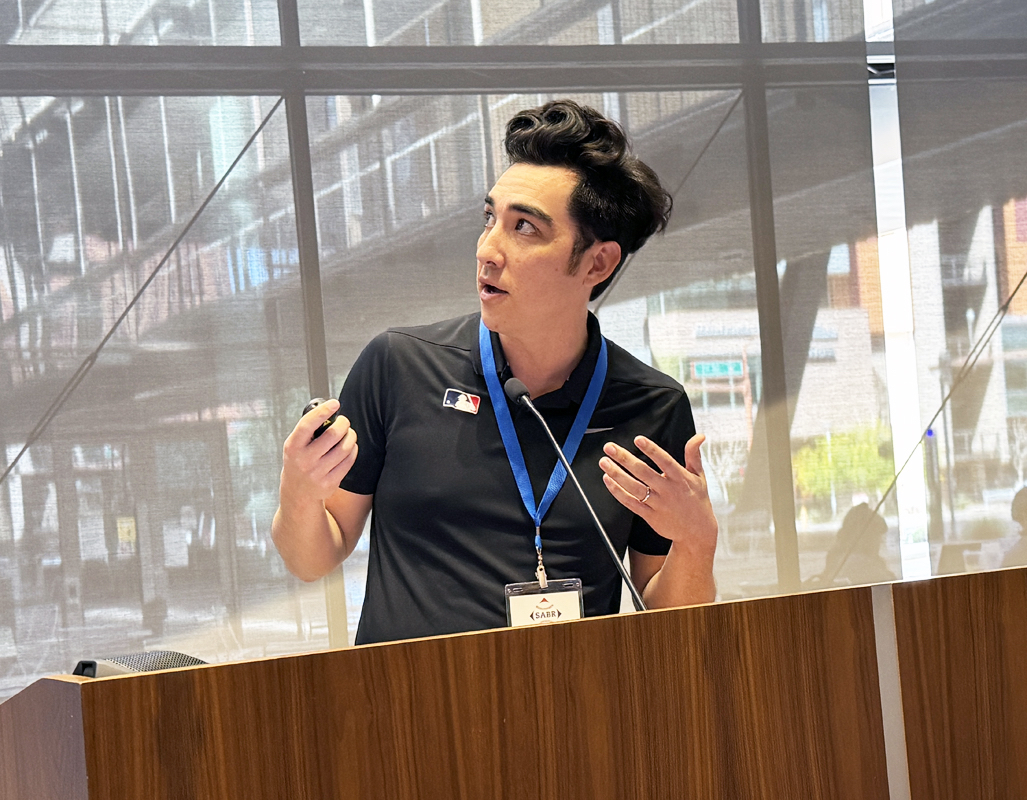
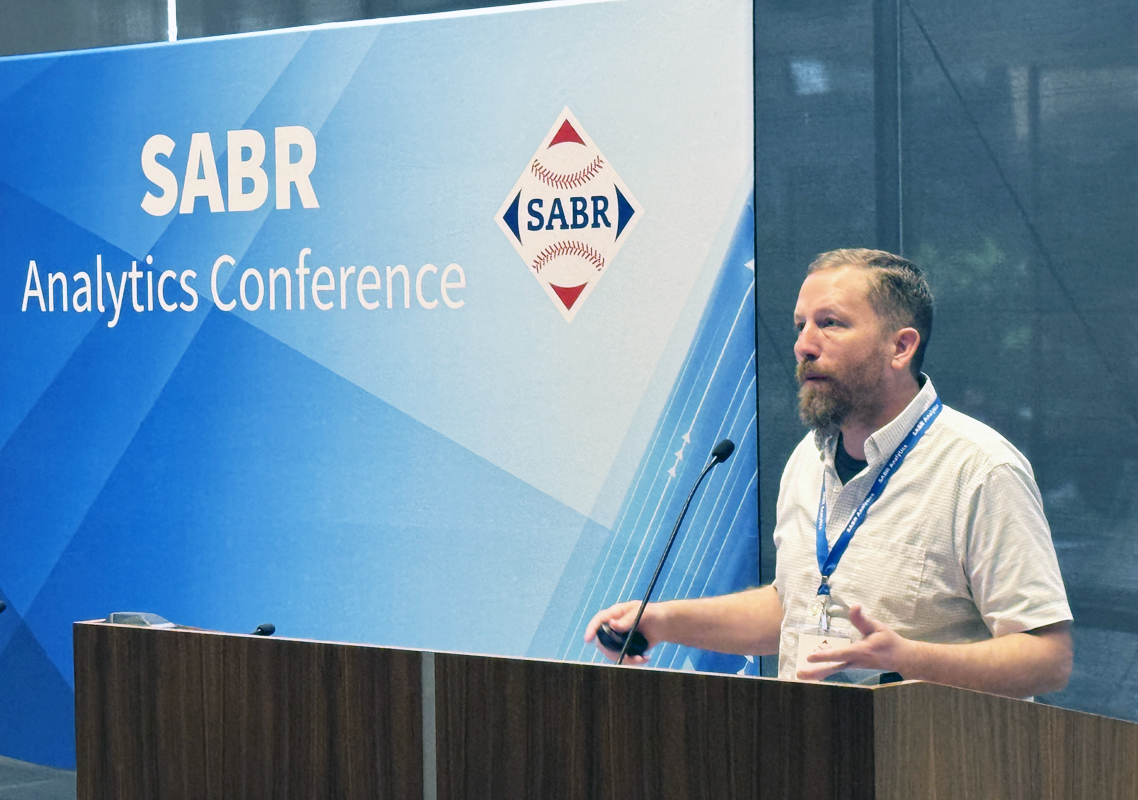
Panelists included: David Adler, Jason Bernard, Graham Goldbeck, Mike Petriello, and Clay Nunnally from Major League Baseball.
- Watch: Click here to watch a video replay of MLB Statcast Updates: Weather and Bat Tracking (YouTube)
Here are some highlights from the panel:
On 2023 updates at Baseball Savant
- Bernard: “We were in the process of debuting minor league game feeds as the WBC (World Baseball Classic) started, so we have that available for every level. … We also have two stolen base prevention leaderboards — one from the pitcher perspective and one from the catcher perspective. Both look at stolen base attempts of second base and each stolen base has a probability of whether the steal will be successful or not. They are aggregated to the specific catcher or pitcher. … We also have a timer infraction leaderboard which shows timer infractions. We know the new rules were a hot topic, so we made sure this was one that we had up there so everyone had at least some transparency on what’s going on
- Bernard: “Last year, when we were here, we previewed our expected home run metric, which we now have a full leaderboard available. You can see, per play, where a home run or a fly ball of 300 feet or more would be a home run in a specific park. … Arguably one of the more important [updates] we’ve done, which is fielding run value, is our more unified way of being able to compare all fielding groups into one cohesive ranking. … One of the more difficult things historically has been finding a way to compare fielders to other fielders and this is our way of doing that.”
On new Baseball Savant features planned for 2024
- Adler: “One of the big things we’ve been working on that will be ready soon is the minor league Statcast search page. We are replicating the major league Statcast search page that you see on Savant so that you’ll be able to search for all of the same big metrics that you can get for a major leaguer, but for minor leaguers. Also, you will be able to do new things like search by level, by MLB organization, by specific minor league team, by minor league ballpark — all that type of stuff that is specific to the minors.
- Adler: “Another thing that’s coming is more seam-shifted wake data. Starting from a couple years ago, you could kind of get at who is having a seam-shifted wake effect by looking at our spin direction leaderboard. … What we are working on adding is the percentage of a specific pitcher’s pitches that are experiencing seam-shifted wake effect. … We wanted to make IVB (induced vertical break) more visible on Baseball Savant now and that’s why we want to get it into the game feed so you can see that along with the regular horizontal and vertical movement that we already show there.”
On new bat tracking-based metrics: hard swing and squared-up
- Petriello: “A hard hit ball is over 95 miles an hour exit velocity, a hard swing will be at 75 [mph]. Why 75? Because you look at run value on the per swing basis – that is below average until you get to 75 and that’s about the average line. Anything above that is above average. … [The squared-up metric] is really going to be about the potential energy that comes out of a swing. It is not going to be specifically about where did you impact it. But it is going to be about taking the swing speed, and to a lesser extent the pitch speed, and you throw it into the big physics blender that Tom [Tango] has done and you know what the maximum exit velocity can possibly be. To get to the maximum exit velocity, by definition, you have to have hit the ball off the barrel of the bat, you just can’t do it off the hands — observed physics say the same thing. When we show on a per swing basis, [the ball] can be 0% squared up to 100% squared up. If I were to say 90% squared up, that means he attained, based on his swing speed and the pitch speed, 90% of the possible exit velocity — which almost certainly tells you about where it hit on the bat.
- Petriello: “What we are going to put up early in the season is not the only thing that will ever be up. We are not going to have, in our first release, attack angles – which I know everybody wants to talk about. … It is in the plan to get there. Some other examples – I know Jason [Bernard] is very excited about – if we can figure out who is early the most, who is late the most, or which pitchers make guys late the most.”
On weather effects that Statcast has started to measure
- Goldbeck: “In 2023, we installed weather sensors high up on each park. In conjunction with CFD models of the park, we can then start to calculate the wind’s effect on a given play. … We have the swirling wind vectors we showed across the entire park as low as around 6-10 feet, so you can actually see the wind’s effect on pitches. Traditionally, we think about the wind’s effect on blowing in home runs or blowing out home runs, but they can also have a strong effect on pitches themselves, too. … [Tailwind] would have more of an effect on the trajectory of the pitch. The pitch out of the hand will be the same speed regardless of where they are, but if you have a stronger tailwind on a pitch, that means the pitch is going to get to the plate faster than it would elsewhere. So you can think that fastball speed probably plays up in these places, whereas, there is less time for the ball to get to the plate, that also means breaking balls probably would break a little less.”
On the future role of analyzing wind effects
- Nunnally: “The bigger picture on wind, which we didn’t know before last year, is how it interacts with pitches and hits in the field of play. We know the prevailing conditions, but we never understood the impact on actual pitch trajectories. … This is the first year we will have a complete dataset on how wind affects drag. … Another thing we can do — now that we have data from all 30 parks and all the plays — is calculate how many home runs are prevented by wind. I think this is a result I wouldn’t have guessed, but this is showing that Kansas City had 37 home runs that were prevented by wind — meaning they would have landed over the fence if it wasn’t windy. And you can kind of see that there is some significant impact on the hitters that play most of their games in Kansas City. … [The effect of wind] is the thing about park factors that we’ve never measured very well before. You could definitely take this, if you are a pitcher in free agency or a player in arbitration, when most of your games happen at one of these parks that have a significant wind impact, that’s real money. I think it is something that will be considered more starting now, when people have access to this data.”
Transcription assistance from Sebastian Kirkpatrick.
For more coverage of the 2024 SABR Analytics Conference, visit SABR.org/analytics.
Originally published: May 1, 2024. Last Updated: March 18, 2024.